Banknifty has given breakout, ready to give 5-6% in short term.Hello everyone, i hope you all will be doing good in your life and your trading as well. Today i have brought an analysis on Banknifty which has given breakout of falling resistance trendline and now it is ready to move 5-6% in short term, Banknifty has taken perfect support from important support zone, It's already taken two times support previously from same zone,. Now price has given successfully breakout with huge volume in recents trading sessions.
Disclaimer:- This analysis is for educational purposes only. Please trade responsibly and consult a financial advisor before making any decisions.
If you found this analysis helpful, don’t forget to like, follow, and share your thoughts in the comments below! Your support keeps me motivated to share more insights. Let’s grow and learn together—happy trading!
BANKNIFTY

Support and Resistance Part -2What is the best support and resistance setting?
Rules For Drawing Support and Resistance
Use swing highs and swing lows in the market to your advantage. ...
Don't worry if the highs and lows don't line up perfectly. ...
Focus on the major (key) levels in the market. ...
Stay within a six-month window.
Tube resistance bands work great for almost any kind of exercise. They're the ultimate solution when it comes to anchored workouts to focus on isolation exercises, and they'll be useful in both upper and lower-body exercise.

Technical Analysis Advanced candlesticks These advanced candlesticks are associated with strong price moves, and often gaps, which cause sharp shifts in direction. Traders can participate by noticing these patterns and acting quickly to get in as the price moves in the new direction. Candlestick patterns do not have price targets, which means traders shouldn't get greedy.

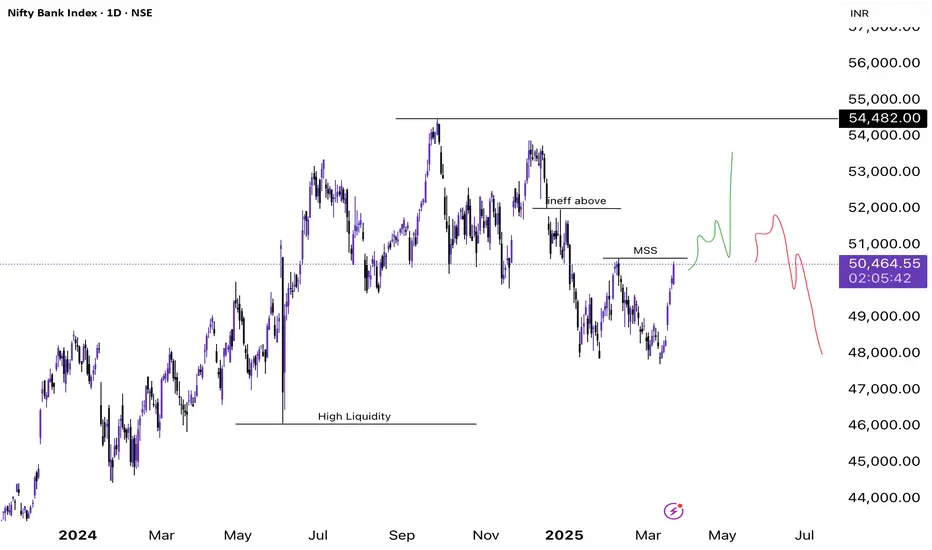
Bank Nifty Technical Analysis Commentary- BNF is currently trading at 50,457 up 5.76%
- BNF has shown some strong recovery post the major drawdown
- BNF is currently trading near a strong POI, if BNF fails to flip this zone to 50,600 and continues to drop then we will enter another distribution mitigating 46,000
- Two paths drawn shows the possible price paths for BNF
- Green path signifies flip above the MSS and weekly candle close above it and we move towards the next high liquid zone sitting at 52,000 to fill the inefficiencies above
The red path shows we will flip above the MSS deviate and fall below harder
KOTAK BANK NEAR FLAG BReakoutKotakBank is nearly Flag Breakout on Monthly Candle (Wait more 7 days to Finish MOnthly Candle with Big Bull Breakout)
Wait for Proper Breakout beacuse its 4 time where Chart is going to test same Trendline.
Flag Pattern Start from 2020- After 5 years its will going to break
If we see fulll chart Stock taking support over 2013 Trendline before two months so there is more more possibility to give breakout
if we see RSI chart its also show Breakout over MOnthly RSI trendline..
## THis is my Just View, take position after all confromations and research by yourself##
also see weekly chart - weekly showing strong big bull canle ( 1more Weekly Candle Require for final conformations)

BANK NIFTY MATHEMATICAL LEVELSThese Levels are based on purely mathematical calculations.
How to use these levels :-
* Mark these levels on your chart.
* Safe players Can use 15 min Time Frame
* Risky Traders Can use 5 min. Time Frame
* When Candle give Breakout / Breakdown to any level we have to enter with High/Low of that breaking candle.
* Targets will be another level marked on chart
* Stop Loss will be Low/High of that Breaking Candle.
* Trail your SL with every candle.
* Avoid Big Candles as SL will be high then.
* This is one of the Best Risk Reward Setup.
For Educational purpose only

BANKNIFTY - RSI DIVEGENCE - LONGBullish RSI Divergence seen on the Nifty Bank Index.
What is happening:
Price Action:
- The price made a **lower low** in February and March, as seen in the downtrend.
- This suggests weakness in price action.
RSI Behavior:
- The RSI (Relative Strength Index) made a **higher low** during the same period.
- This indicates that despite the price making lower lows, the underlying momentum is improving — a classic sign of bullish divergence.
Why It Matters:
- A bullish RSI divergence suggests that selling pressure is weakening and buyers are starting to step in.
- This often precedes a **potential trend reversal** or at least a strong upward bounce.
Confirmation:
- The breakout above the downward trendline could confirm the reversal.
- If RSI rises above 60 and price sustains above key resistance levels, the upward momentum could strengthen further.
This setup hints at a potential bullish move if the breakout follows through with volume.

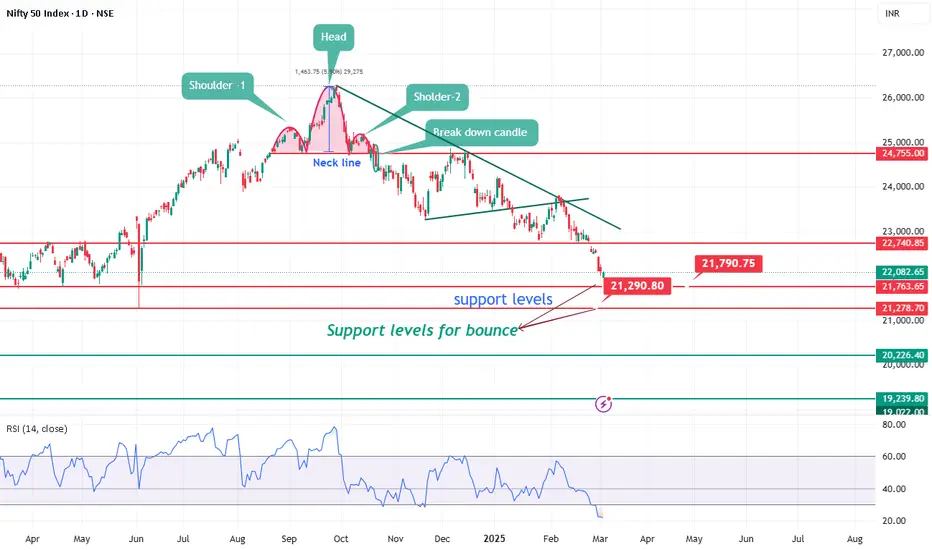
Nifty weekly analysis for 17/03/2025Nifty is trading between 100 EMA (weekly) and 20 EMA (daily). A good support from the weekly moving average is there and resistance on the daily charts.
A continuous support from 22300 level is there as the market has remained in a range whole week.
If the market tried to breach the support level, the support of weekly 100 EMA can be the other support around 22030 else it will take support around 21800.
In case the market starts to recover from the bottom and creates a higher high higher low formation it has to take out the resistance of 22650 and 22758.
Major levels are plotted in the charts. Just wait for the price action to confirm the entry into a trade else another sideways market can be seen.
Inside candle formation on the daily charts is also there and break out/down can be traded accordingly. Different trading approaches can help in capturing a good trade.
Wait for the price action near the levels before entering the market.

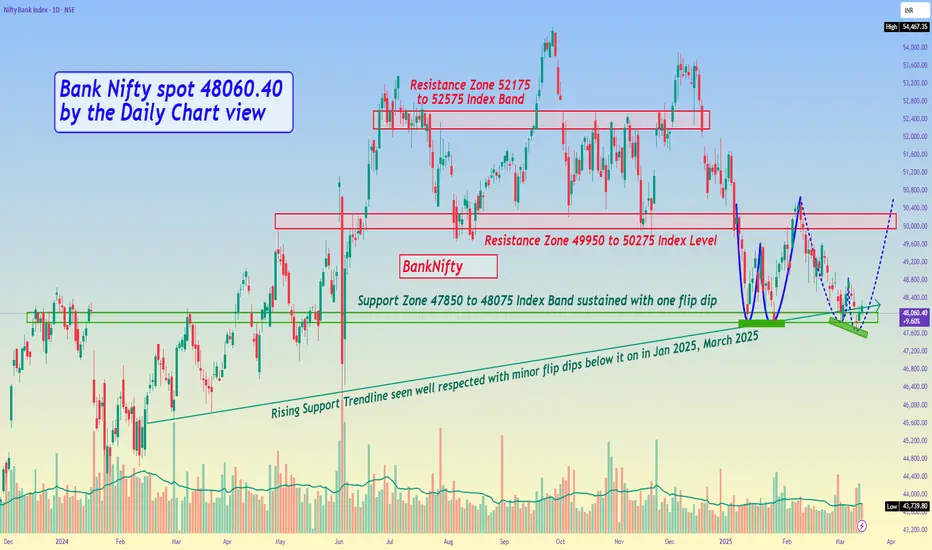
Bank Nifty spot 48060.40 by the Daily Chart view - Weekly updateBank Nifty spot 48060.40 by the Daily Chart view - Weekly update
- Resistance Zone 49950 to 50275 Index Level
- Support Zone 47850 to 48075 Index Band sustained with one flip dips
- 1st Bullish "W" Double Bottom formed and completed at the Support Zone Index Band
- 2nd Bullish "W" Double Bottom been formed by minor flip dip below Support Zone Index Band
- Rising Support Trendline seen well respected with minor flip dips below it in Jan 2025 and March 2025
Bank Nifty: Losing Altitude – Will It Find a Safe Landing!!!Bank Nifty is currently struggling at 47,771, and from the looks of it, the flight path isn’t looking too smooth. The radar is flashing danger zones at 47,075, 45,179, 45,006, and a deep landing strip at 43,591. The question is – will this banking fighter jet find an airstrip to stabilise, or are we in for a full-blown crash landing?
Current Mission Status:
Bank Nifty took off, but it seems to have lost fuel mid-air, struggling to maintain altitude. 47,075 is the first emergency refuelling station, but if that fails, brace for a rapid descent towards 45,179 and 45,006. And if things really go south? 43,591 might be the final crash site where we send the recovery team.
Air Force Strategy for Traders:
🔸 47,075 – The First Landing Attempt: If this level holds, we may see some mid-air stabilisation.
🔸 45,179 & 45,006 – The Panic Button Zones: A failure to hold here could mean total loss of altitude and an emergency ejection.
🔸 43,591 – The Deep Crash Site: If we reach here, expect complete radio silence from the bulls. The bears will be controlling the airspace!
Command Center Advice:
Keep stop-losses secured – No pilot wants to be stuck in a nosedive without an escape plan!
Watch for potential counterattacks at 47,075 – the bulls might attempt an air rescue. 🚁
If 45,179 & 45,006 collapse, consider it an evacuation signal – next stop, 43,591!
The Bank Nifty fighter jet is in distress, and this could turn into a full-blown rescue mission. Will the bulls send reinforcements, or will the bears force an emergency landing? Stay sharp, keep your radars on, and prepare for high-speed manoeuver ahead!
Over and out! 🛫⚡

Nifty weekly analysis for 10/03/2025.Is this the end of the fall or its just a retracement. The market after a while has given some hope of a green week.
It is a retest or a base formation no body knows. Nifty is trading around 22550 levels and looks somewhat positive for the coming week.
Market is still in the down trend and bullish trend will only be confirmed once a 'W' pattern is formed on higher time frame or a break out is done.
On the hourly charts, market remained in a range for the last trading session, the sideways market can continue as it may form a base and trend reverses from here.
In case the market remains in the trend lower levels of 21800-850 might be coming. Else market may start travelling on the higher side hitting the resistance levels.
Major support levels :- 22310-360, 22050-090
Resistance levls :- 21620, 21760
A gap filling trade on the higher side can be seen in the coming week as a gap is pending.
Watch for the price action and trade accordingly. A sideway or volatile market is more probable as the market has been trading in a trend.

Advanced Option Trading With Professionals The 3 5 7 rule is a risk management strategy in trading that emphasizes limiting risk on each individual trade to 3% of the trading capital, keeping overall exposure to 5% across all trades, and ensuring that winning trades yield at least 7% more profit than losing trades.
Why do 90% option traders lose money?
This is because option traders often find themselves directionless, making it difficult to predict market movements accurately. The complex nature of options, combined with the high volatility, leads to significant losses for most traders. It's time to stop option trading.

Banknifty Daily Analysis - 7.3.25📊 Bank Nifty Sentiment Analysis: Key Levels & Market Outlook
Disclaimer: This analysis is for educational purposes only and should not be considered financial advice. Market conditions are subject to change, and traders should conduct their own research before making any decisions.
🏦 Market Overview
🔹 Open: 48,463.8 | 🔹 High: 48,709.05 | 🔹 Low: 48,359.35
🔹 Close: 48,497.5 | 🔹 Previous Close: 48,627.7
🔻 Bank Nifty remained under pressure, closing lower than the previous session. Despite attempts to recover, selling momentum was observed at higher levels, reflecting cautious market sentiment.
📈 Technical Outlook – Key Levels to Watch
📌 Resistance Levels:
🟥 R1 – 48,685 → Crucial Intraday Resistance 🚧
The index experienced selling pressure near this level.
🟥 R2 – 48,872 → Key Bullish Confirmation Zone 📈
A decisive move above this zone could indicate improving sentiment.
🟥 R3 – 49,034 → Breakout Level for Trend Reversal 🚀
If the index sustains above this level, a shift in momentum could be observed.
📌 Support Levels:
🟩 S1 – 48,335 → Immediate Support ✅
A level where market participants have previously shown buying interest.
🟩 S2 – 48,172 → Critical Support Zone ⚠️
A move below this could indicate increased downside pressure.
🟩 S3 – 47,985 → Possible Breakdown Point 🚨
A breach of this level may signal further weakness.
📌 Moving Averages:
❌ 50 EMA: 49,479.42 (🔻 Below trend)
❌ 100 EMA: 50,086.75 (🔻 Below trend)
❌ 200 EMA: 49,986.46 (🔻 Below trend)
💡 Analysis: The index is currently trading below its 50, 100, and 200 EMAs, which is often interpreted as a sign of weak momentum. However, price movements should be observed for further confirmation.
📊 Market Sentiment Overview
🔸 Factors Indicating Weakness:
❌ Trading below key EMAs, indicating a lack of strong upward momentum.
❌ Resistance at R1 (48,685) suggests supply pressure.
❌ The index did not sustain above its previous close.
🔹 Factors Indicating Potential Strength:
✅ S1 (48,335) has provided support in previous sessions.
✅ If the index moves above R1 (48,685), it could indicate improved sentiment.
📉 Overall Sentiment: Cautiously Bearish ⚠️
🎯 Market Observation
📌 Potential Upside Movement:
🔹 If Bank Nifty moves above 48,685, further movement towards 48,872 - 49,034 could be observed.
🔹 A sustained move above 49,034 might indicate improving strength.
📌 Potential Downside Movement:
🔹 If Bank Nifty moves below 48,335, further movement toward 48,172 - 47,985 could be observed.
🔹 A sustained move below 47,985 might indicate increased selling pressure.
Note: This is an analysis of potential market scenarios based on historical price movements and is not a recommendation to buy or sell.
📢 Conclusion
📌 Bank Nifty remains below key moving averages, indicating weak sentiment. However, support and resistance levels should be closely watched for confirmation of further movement. Market participants should remain cautious and manage risk effectively in volatile conditions.
🚀 Stay informed and trade responsibly!

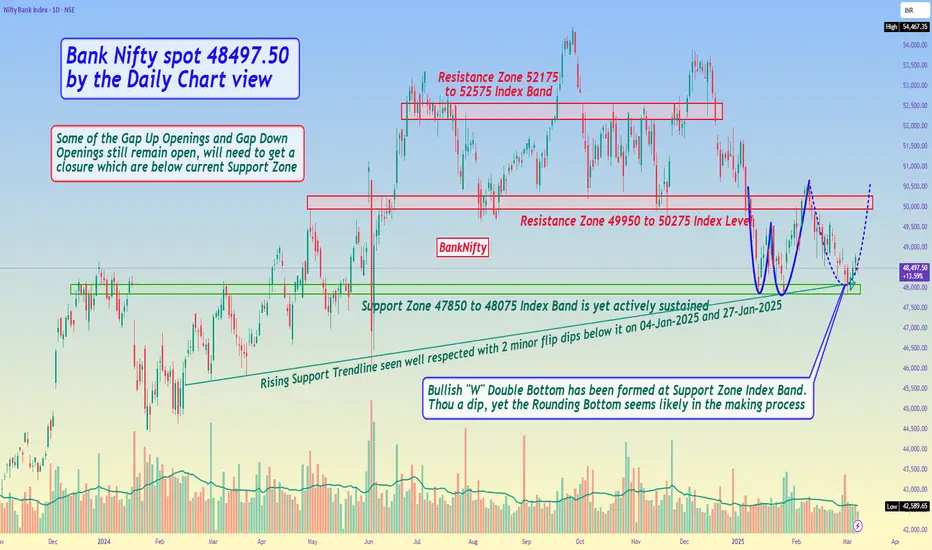
Bank Nifty spot 48497.50 by the Daily Chart view - Weekly UpdateBank Nifty spot 48497.50 by the Daily Chart view - Weekly Update
- Support Zone 47850 to 48075 Index Band is yet actively sustained
- Bullish "W" Double Bottom has been formed at Support Zone Index Band.
- Thou a dip seen for the week, yet the Rounding Bottom seems likely in the making process
BANKNIFTY MATHEMATICAL LEVELSThese Levels are based on purely mathematical calculations.
How to use these levels :-
* Mark these levels on your chart.
* Safe players Can use 15 min Time Frame
* Risky Traders Can use 5 min. Time Frame
* When Candle give Breakout / Breakdown to any level we have to enter with High/Low of that breaking candle.
* Targets will be another level marked on chart
* Stop Loss will be Low/High of that Breaking Candle.
* Trail your SL with every candle.
* Avoid Big Candles as SL will be high then.
* This is one of the Best Risk Reward Setup.
For Educational purpose only

Gold Long Term Neowave ForecastHello Everyone
FX:XAUUSD In this we are going to talk about gold in detail
## As long as we are above 2771, gold will bullish till May-June. But to confirm this we will need to wait for 2 or 3 more weeks, so buy in parts.
## Inner stucture is in correction of traditional ABC structure and still in developing phase. But i have remove them so that who dont understand neowave wont be confused.
## Apart from this i am adding Live link for fast updates. so if you have any query. Kindly leave a comment. I will be happy to guide you further more.
Live Link- in.tradingview.com

Nifty support levels for bounce.Nifty has been corrected 17% from top. As per chart index is in oversold condition on daily chart. There is still space for downside lower levels for support would be 21800 and 21222.
Nifty Trading Strategyy for 03rd March 2025📈 Nifty Trade Setup 📉
💰 Entry Strategy:
🔼 Buy Above: The high of the 1-hour candle that closes above 22,250
🎯 Targets: 22,316 | 22,395 | 22,473
🔽 Sell Below: The low of the 15-minute candle that closes below 22,100
🎯 Targets: 22,029 | 21,934 | 21,855
📊 Trade Explanation:
Why wait for a candle close?
A 1-hour candle closing above 22,250 confirms bullish strength, filtering out false breakouts.
A 15-minute candle closing below 22,100 provides an early signal of bearish momentum.
Advantages of this approach:
Reduces false breakouts and whipsaws.
Aligns with price action confirmation, increasing trade accuracy.
Works well with additional indicators like RSI, MACD, Moving Averages, or Volume Analysis for extra confirmation.
⚠️ Disclaimer:
I am not a SEBI-registered analyst or advisor. The information provided here is for educational and informational purposes only and should not be considered as financial or investment advice. Trading in the stock market involves significant risk, and there is no guarantee of profit. You are solely responsible for your trading decisions, and it is strongly recommended to conduct your own research or consult a SEBI-registered financial professional before making any trading or investment decisions. Past performance is not indicative of future results.

Bank Nifty spot 48344.70 by the Daily Chart viewJust sharing an update in continuation over the last week Bank Nifty Index chart data reading.
Bank Nifty spot 48344.70 by the Daily Chart view
- Support Zone 47850 to 48075 Index Band is still sustained
- Bullish "W" Double Bottom has been formed at Support Zone Index Band.
- Do we expect another Rounding Bottom from the Support Zone or a Breakdown is on the cards ????

BANKNIFTY MATHEMATICAL LEVELSThese Levels are based on purely mathematical calculations.
How to use these levels :-
* Mark these levels on your chart.
* Safe players Can use 15 min Time Frame
* Risky Traders Can use 5 min. Time Frame
* When Candle give Breakout / Breakdown to any level we have to enter with High/Low of that breaking candle.
* Targets will be another level marked on chart
* Stop Loss will be Low/High of that Breaking Candle.
* Trail your SL with every candle.
* Avoid Big Candles as SL will be high then.
* This is one of the Best Risk Reward Setup.
For Educational purpose only

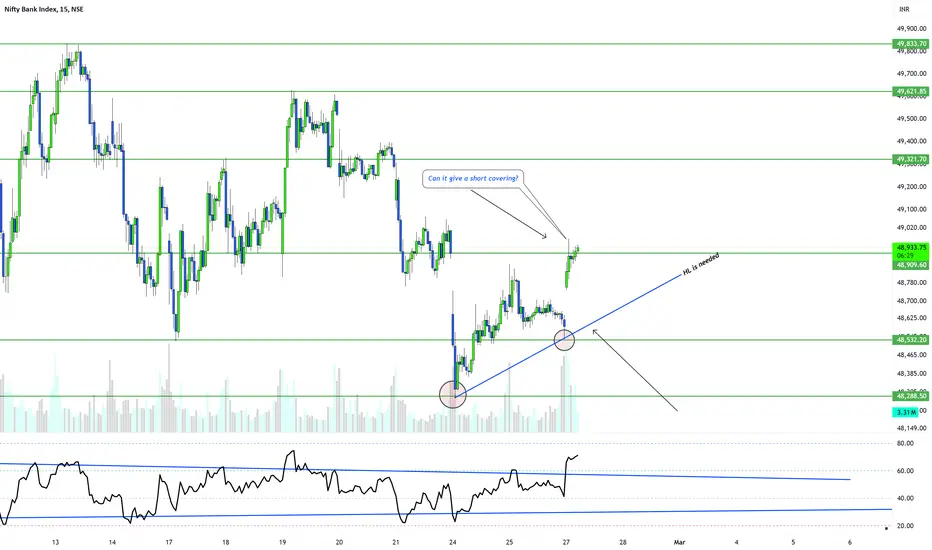
BANKNIFTY! Can it give a big move? Weekly zones!As per the trend BANKNIFTY is trying to sustain above 49000, which is a strong RESISTANCE.
If you want to follow up the trend UPSIDE then one should wait for HLs for a confirmation. Also, the trend changes if any of the big strikes gets eliminated. In this current scenario we are probably waiting for a confirmation.
I have marked the important Support & Resistances to help you in a better way.
INDIA VIX is down right now which is giving a good support to option buyers and Sellers.
As per the study let it close above today's high and give a HL confirmation for a trend change on a 15 mins time frame.
IMPORTANT ZONES TO WATCH : 49000-49100
NOTE: I'm not a SEBI reg. Study before investing.
Nifty Trading Strategy for 24th Feb 2025📊 NIFTY INTRADAY TRADING PLAN 📊
🔹 Strategy:
This plan is based on the breakout of a key level after a confirmed 15-minute candle close.
🟢 Buy Setup (Bullish Breakout)
✅ Entry Condition: Enter a buy position above the high of the 15-minute candle that closes above 22,921.
✅ Targets:
🎯 First Target: 22,966
🎯 Second Target: 23,038
🎯 Final Target: 23,099
✅ Stop Loss: Below the low of the entry candle.
✅ Risk Management: Follow a risk-reward ratio of at least 1:2.
🔴 Sell Setup (Bearish Breakdown)
✅ Entry Condition: Enter a sell position below the low of the 15-minute candle that closes below 22,700.
✅ Targets:
🎯 First Target: 22,653
🎯 Second Target: 22,608
🎯 Final Target: 22,562
✅ Stop Loss: Above the high of the entry candle.
✅ Risk Management: Avoid overleveraging and use a stop-loss strategy.
⚠ Important Notes:
📌 Wait for levels to come into play – If there is a big gap-up or gap-down, do not rush into a trade. Instead, wait for price action confirmation at the key levels.
📌 A lost opportunity could be capital saved – Patience is key! If the setup doesn't align, it's better to stay out than force a trade.
📌 Avoid trading during high-impact news events – Volatility can cause sudden price movements.
🚨 Disclaimer:
This analysis is for educational and informational purposes only and should not be considered financial or investment advice. I am not SEBI-registered. Trading in financial markets involves significant risk, and past performance is not indicative of future results. Trade responsibly and use proper risk management. 🚀📉

Bank Nifty spot 48981.20 by the Daily Chart viewBank Nifty spot 48981.20 by the Daily Chart view
- Repeat Bottoms formed over the past few days 47525 to 48810 Index level
- Bullish "W" Double Bottom has been formed at Support Zone Index Band and is sustained
- Few Gap Up and Gap Down openings remain to get closed below Support Zone 47850 to 48075 for Bank Nifty Index Band levels
