Trading MistakesIt is a high-stakes game where many are lured by the promise of quick riches but ultimately face harsh realities. One of the harsh realities of trading is the “Rule of 90,” which suggests that 90% of new traders lose 90% of their starting capital within 90 days of their first trade.
The 5-3-1 strategy is especially helpful for new traders who may be overwhelmed by the dozens of currency pairs available and the 24-7 nature of the market. The numbers five, three, and one stand for: Five currency pairs to learn and trade. Three strategies to become an expert on and use with your trades.
BANKNIFTY

Advanced Option Trading with Professionals Let's review each part of the professional trader's mind to understand where you want to be, ideally as you develop as an online trader.
Discipline and Consistency. ...
Emotional Control. ...
Continuous Learning. ...
Fundamental Analysis. ...
Technical Analysis. ...
Sentiment Analysis. ...
Goal Setting. ...
Risk Management.
When options are better. Options can be a better choice when you want to limit risk to a certain amount. Options can allow you to earn a stock-like return while investing less money, so they can be a way to limit your risk within certain bounds. Options can be a useful strategy when you're an advanced investor.

Database Trading Options chain can be defined as the listing of all option contracts. It comes with two different sections: call and put. A call option means a contract that gives you the right but does not give you the obligation to buy an underlying asset at a particular price and within the option's expiration date.
In all, it is not gambling but is a type of speculation hence a government employee and PSU servants are not allowed to trade in options.

Advanced TradingOptions are a type of contract that gives the buyer the right to buy or sell a security at a specified price at some point in the future. An option holder is essentially paying a premium for the right to buy or sell the security within a certain time frame.
Technical analysis is a means of examining and predicting price movements in the financial markets, by using historical price charts and market statistics. It is based on the idea that if a trader can identify previous market patterns, they can form a fairly accurate prediction of future price trajectories.

Nifty Trading Strategy for 28th January 2025Nifty Trading Strategy
Buy Strategy:
Buy Above: The high of the 15-minute candle that closed above 22,900
Targets: 22,950, 23,000, 23,050
Stop-Loss: Below the low of the 15-minute candle that closed above 22,900
Sell Strategy:
Sell Below: The low of the 15-minute candle that closed below 22,700
Targets: 22,660, 22,615, 22,565
Stop-Loss: Above the high of the 15-minute candle that closed below 22,700
Disclaimer:
I am not SEBI registered. This analysis is based on historical data and market trends. Past performance is not indicative of future results. Trading and investment involve risks, and you should conduct your own research or consult with a financial advisor before making any decisions.

Option chainOptions chain can be defined as the listing of all option contracts. It comes with two different sections: call and put. A call option means a contract that gives you the right but does not give you the obligation to buy an underlying asset at a particular price and within the option's expiration date.
Nifty option chain is considered to be the best advance warning system of sharp moves or break outs in the index.

Database and Option TradingOptions data captures information on options contracts, including pricing and trading volumes, useful for investment strategies. Discover our guide and top options data providers.
Simply put, when Open Interest increases, it means more money is moving into the futures contract, and when open interest drops, it means money is moving out of the contract. One can draw inference from this example.

Nifty Trading Strategy for 27th January 2025Nifty Trading Strategy
Buy Strategy:
Buy Above: The high of the 15-minute candle that closed above 23,260
Targets: 23,320, 23,375, 23,440
Stop-Loss: Below the low of the 15-minute candle that closed above 23,260
Sell Strategy:
Sell Below: The low of the 15-minute candle that closed below 23,005
Targets: 22,940, 22,880, 22,825
Stop-Loss: Above the high of the 15-minute candle that closed below 23,005
Disclaimer:
I am not SEBI registered. This analysis is based on historical data and market trends. Past performance is not indicative of future results. Trading and investment involve risks, and you should conduct your own research or consult with a financial advisor before making any decisions.

BankNifty Intraday Support & Resistance Levels for 27.01.2025On Friday, BankNifty opened flat to negative and experienced a volatile session. It initially hit a low of 48,347.85, then rallied to the day’s high of 48,858.65 before declining sharply to a new low of 48,203 by the end of the day. The index closed at 48,367.80, losing 221 points compared to the previous close. The Weekly Trend (50 SMA) remains sideways, while the Daily Trend (50 SMA) continues to be negative.
Demand/Support Zones
Near Minor Demand/Support Zone (5m): 48,074.05 - 48,171.10
Far Support Zone: 46,077.85 (low from 4th June 2024)
Far Demand/Support Zone (Daily): 44,633.85 - 45,750.40
Supply/Resistance Zones
Near Supply/Resistance Zone (Daily): 49,230.15 - 50,447.60 (tested multiple times)
Near Supply/Resistance Zone (75m): 49,787.70 - 49,979.05 (inside the Daily supply zone)
Far Supply/Resistance Zone (Weekly): 50,485.05 - 51,979.75
Far Supply/Resistance Zone (75m): 50,904.35 - 51,088.90 (inside the Weekly supply zone)
Outlook
This marks the third consecutive week that BankNifty has closed below the crucial June 2024 election week closing levels, indicating persistent selling pressure. Unless BankNifty finds support in the 47,800–48,000 zone, further downside could unfold in the coming days.
However, a breakout above 49,000 and sustained trading in that range could trigger a bullish move, targeting the 50,000–50,500 zone.
With the Union Budget 2025 approaching, heightened volatility is expected. Trade cautiously and keep an eye on key levels!

BANKNIFTY stuck in a Range in 1 hour timeframeObservations
BANKNIFTY has been consolidating within a defined range for the past 4 trading sessions in one hour candle chart
Support level: 48000
Resistance level: 49660
Price action has been characterized by lack of strong directional bias
Trading Idea
Breakout Strategy:
Long Entry: A decisive break above the resistance level 49660 with increased volume and confirmation from indicators.
Stop-Loss: Below the recent swing low within the range.
Target: Risk-Reward ratio of 1:2
Short Entry: A decisive break below the support level 48000 with increased volume and confirmation from indicators.
Stop-Loss: Above the recent swing high within the range.
Target: Risk-Reward ratio of 1:2
Considerations:
Volume: Increased volume on the breakout can strengthen the move.
Indicators: Consider using indicators like RSI, MACD, or Bollinger Bands to identify potential divergences or confirmations.
News & Events: Be aware of upcoming budget events that could impact market sentiment.
Disclaimer: This is for informational purposes only and not financial advice. Trading involves risk, and you should always conduct your own research and consult with a qualified financial advisor before making any investment decisions.

Nifty Trading Strategy for 24th January 2025Nifty Trading Strategy
Buy Strategy:
Buy Above: The high of the 15-minute candle that closed above 23,280
Targets: 23,320, 23,360, 23,405
Stop-Loss: Below the low of the 15-minute candle that closed above 23,280
Sell Strategy:
Sell Below: The low of the 15-minute candle that closed below 23,195
Targets: 23,155, 23,105, 23,070
Stop-Loss: Above the high of the 15-minute candle that closed below 23,195
Disclaimer:
I am not SEBI registered. This analysis is based on historical data and market trends. Past performance is not indicative of future results. Trading and investment involve risks, and you should conduct your own research or consult with a financial advisor before making any decisions.

BANKNIFTY MATHEMATICAL LEVELS These Levels are based on purely mathematical calculations.
How to use these levels :-
* Mark these levels on your chart.
* Safe players Can use 15 min Time Frame
* Risky Traders Can use 5 min. Time Frame
* When Candle give Breakout / Breakdown to any level we have to enter with High/Low of that breaking candle.
* Targets will be another level marked on chart
* Stop Loss will be Low/High of that Breaking Candle.
* Trail your SL with every candle.
* Avoid Big Candles as SL will be high then.
* This is one of the Best Risk Reward Setup.
For Educational purpose only

Gold Trading Strategy For 24th January 2025Gold Trading Strategy
Buy Strategy:
Condition: Wait for the 15-minute candle to close above 2760.
Trigger: Buy when the price moves above the high of the 15-minute candle that closed above 2760.
Targets: 2773, 2779, 2785
Stop-Loss:
Set a stop-loss order below the low of the 15-minute candle that closed above 2760 to limit potential losses.
Sell Strategy:
Condition: Wait for the 15-minute candle to close below 2747.
Trigger: Sell when the price moves below the low of the 15-minute candle that closed below 2747.
Targets: 2740, 2735, 2729
Stop-Loss:
Set a stop-loss order above the high of the 15-minute candle that closed below 2747 to limit potential losses.
Disclaimer:
This analysis is based on historical data and market trends. Past performance is not indicative of future results. Trading and investment involve risks, and you should conduct your own research or consult with a financial advisor before making any decisions.

BankNifty Intraday Support & Resistance Levels for 24.01.2025On Thursday, BankNifty saw a subdued session, opening flat to positive but struggling to sustain higher levels. It made a low of 48,493 during the first 30 minutes, rallied to a day high of 48,892.70, and then traded sideways for most of the session. As the day ended, it dipped near the day’s low and closed at 48,589, losing 135 points over the previous close. The Weekly Trend (50 SMA) remains sideways, while the Daily Trend (50 SMA) is negative.
Demand/Support Zones
Near Minor Demand/Support Zone (5m): 48,074.05 - 48,171.10
Far Support: 46,077.85 (Low of 4th June 2024)
Far Demand/Support Zone (Daily): 44,633.85 - 45,750.40
Supply/Resistance Zones
Near Supply/Resistance Zone (Daily): 49,230.15 - 50,447.60 (tested multiple times)
Near Supply/Resistance Zone (75m): 49,787.70 - 49,979.05 (inside the Daily supply zone)
Far Supply/Resistance Zone (Weekly): 50,485.05 - 51,979.75
Far Supply/Resistance Zone (75m): 50,904.35 - 51,088.90 (inside the Weekly supply zone)
Outlook
BankNifty continues to struggle around the 48,500 levels, indicating a lack of strong buying momentum. However, the 48,000 - 48,100 demand zone might provide support in the short term. On the upside, resistance around 49,200 - 49,800 needs to be breached for any sustained rally.

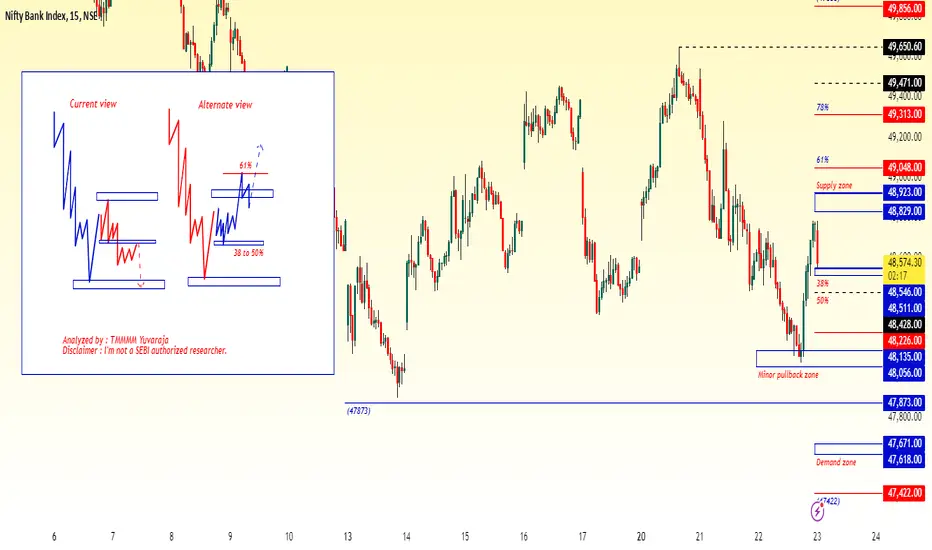
#Banknifty directions and levels for January 23rd:Bank Nifty Current View:
The Bank Nifty current view has two variations:
> First Variation: If the gap-down sustains, it will likely consolidate within the previous day's range. In this sentiment, a correction will only be expected if it breaks the previous bottom, meaning that until the previous bottom is broken, the market bias could remain moderately bullish.
> Second Variation: This is conditional; the initial market should take a solid pullback and could reject around the immediate resistance zone. If this occurs, the market will turn into a correction phase, supported by structural reasons.
Alternate View:
The alternate view is similar to that of Nifty. If the gap-down does not sustain or if the market finds support around the 38%, we can expect some consolidation between the 38% and the upside 61% mark. In this case, the supply zone may not be as effective.
BankNifty Intraday Support & Resistance Levels for 23.01.2025On Wednesday, BankNifty showed resilience, opening on a positive note but dipping to a low of 48,074.05, breaking below the 125m Demand Zone and entering the Far 30m Demand Zone. From there, it rallied strongly during the final trading hour, touching a high of 48,781.75 before closing at 48,724.40, gaining 153 points over the previous close. The Weekly Trend (50 SMA) remains sideways, while the Daily Trend (50 SMA) stays negative.
Demand/Support Zones
Near Demand/Support Zone (30m): 47,950.15 - 48,117.75 (tested)
Far Support: 46,077.85 (low of 4th June 2024)
Far Demand/Support Zone (Daily): 44,633.85 - 45,750.40
Supply/Resistance Zones
Near Supply/Resistance Zone (75m): 49,787.70 - 49,979.05
Near Supply/Resistance Zone (Daily): 49,230.15 - 50,447.60 (tested)
Far Supply/Resistance Zone (75m): 50,904.35 - 51,088.90
Outlook
BankNifty's rally from the 30m Demand Zone highlights robust support around 47,950 - 48,100. On the upside, the 49,200 - 49,400 range presents significant resistance, with further barriers near 49,800 - 50,000. A breakout above these levels could open doors to 50,900+.

Nifty Trading Strategy 23rd January 2025Nifty Trading Strategy
Buy Strategy:
Condition: Wait for the 15-minute candle to close above 23,210.
Trigger: Buy when the price moves above the high of the 15-minute candle that closed above 23,210.
Targets: 23,258, 23,310, 23,360
Stop-Loss:
Set a stop-loss order below the low of the 15-minute candle that closed above 23,210 to limit potential losses.
Trailing Stop-Loss:
Use a trailing stop-loss to lock in profits as the price moves towards the targets. For example, set a trailing stop of 10 points below the current price.
Sell Strategy:
Condition: Wait for the 15-minute candle to close below 23,050.
Trigger: Sell when the price moves below the low of the 15-minute candle that closed below 23,050.
Targets:22,980, 22,950, 22,890
Stop-Loss:
Set a stop-loss order above the high of the 15-minute candle that closed below 23,050 to limit potential losses.
Trailing Stop-Loss:
Use a trailing stop-loss to lock in profits as the price moves towards the targets. For example, set a trailing stop of 10 points above the current price.
Discipline:
Stick to the trading plan and do not deviate from the strategy. Avoid making impulsive decisions based on emotions.
Disclaimer:
I am not SEBI Registered. This analysis is based on historical data and market trends. Past performance is not indicative of future results. Trading and investment involve risks, and you should conduct your own research or consult with a financial advisor before making any decisions.

Bank Nifty index Technical🪂🛬The 🏦Bank Nifty index has recently experienced a significant downturn, closing below the 48,000 mark, A 🐂bullish reversal might be anticipated if Bank Nifty can sustain above 47106, with potential targets at 50600 However, if it falls below 47000, further decline could be expected. The index is currently in a descending channel, indicating a bearish short-term trend, but a breakout above 50700 could signal a shift towards bullish momentum
Hear is Technical📈📉 Chart For your Reference

BankNifty Intraday Support & Resistance Levels for 22.01.2025Tuesday's session saw extreme volatility, with BankNifty opening positive and made day high of 49,543.15. However, it faced heavy selling pressure, dropping to 48,692, followed by a bounce to 49,280.70, and finally sliding to a day low of 48,430.95, entering the 125m Demand Zone. It closed at 48,570.90, losing 780 points over the previous close. The Weekly Trend (50 SMA) remains sideways, while the Daily Trend (50 SMA) stays negative.
Demand/Support Zones
Near Demand/Support Zone (125m): 48,375.60 - 48,610.10 (current price inside the zone)
Far Demand/Support Zone (30m): 47,950.15 - 48,117.75
Far Support: 46,077.85 (low of 4th June 2024)
Far Demand/Support Zone (Daily): 44,633.85 - 45,750.40
Supply/Resistance Zones
Near Supply/Resistance Zone (75m): 49,787.70 - 49,979.05
Near Supply/Resistance Zone (Daily): 49,230.15 - 50,447.60 (tested)
Far Supply/Resistance Zone (75m): 50,904.35 - 51,088.90
Outlook
BankNifty is currently in the 125m Demand Zone (48,375.60 - 48,610.10), which could offer support. If this zone holds, we may see a bounce. However, a break below could lead to further downside.

#Banknifty directions and levels for January 22nd, WednesdayBank Nifty Current View:
The current view for Bank Nifty aligns with Nifty. If the gap-up doesn't sustain or the market breaks the previous low with consolidation, we can expect the correction to continue toward the levels of 48309 to MPZ.
Alternate View:
If the gap-up sustains, we can approach Bank Nifty as a range-bound market as well. Traders can look for breakout entries. For instance, if the market breaks 48848, we can anticipate a move toward 49031.

Nifty Trading Strategy for 22nd January 2025Nifty Trading Strategy
Buy Strategy:
Entry Point:
Condition: Wait for the 15-minute candle to close above 23,280.
Trigger: Buy when the price moves above the high of the 15-minute candle that closed above 23,280.
Targets:
First Target: 23,320
Second Target: 23,360
Third Target: 23,400
Stop-Loss:
Set a stop-loss order below the low of the 15-minute candle that closed above 23,280 to limit potential losses.
Trailing Stop-Loss:
Use a trailing stop-loss to lock in profits as the price moves towards the targets. For example, set a trailing stop of 10 points below the current price.
Profit Booking:
As the price reaches each target, consider booking partial profits to secure gains. For instance, sell a portion of the position at 23,320, another portion at 23,360, and the remaining position at 23,400.
Sell Strategy:
Entry Point:
Condition: Wait for the 15-minute candle to close below 23,970.
Trigger: Sell when the price moves below the low of the 15-minute candle that closed below 23,970.
Targets:
First Target: 23,920
Second Target: 23,870
Third Target: 22,845
Stop-Loss:
Set a stop-loss order above the high of the 15-minute candle that closed below 23,970 to limit potential losses.
Trailing Stop-Loss:
Use a trailing stop-loss to lock in profits as the price moves towards the targets. For example, set a trailing stop of 10 points above the current price.
Profit Booking:
As the price reaches each target, consider booking partial profits to secure gains. For instance, sell a portion of the position at 23,920, another portion at 23,870, and the remaining position at 22,845.
Risk Management:
Position Sizing:
Use proper position sizing to ensure you do not risk more than 1-2% of your trading capital on a single trade. This helps to manage risk and protect your capital.
Diversification:
Avoid putting all your capital into a single trade or asset. Diversify your trades across different assets to minimize risk.
Discipline:
Stick to the trading plan and do not deviate from the strategy. Avoid making impulsive decisions based on emotions.
Disclaimer:
I am not SEBI Registered. This analysis is based on historical data and market trends. Past performance is not indicative of future results. Trading and investment involve risks, and you should conduct your own research or consult with a financial advisor before making any decisions.

BankNifty Analysis
Bank Nifty is currently facing resistance at 49,650. If it breaks above this level and moves past 49,750 , it may turn bullish. The 49,650 level will then act as a support, helping the price to stay up.
Key Levels:
Resistance Level: 49,650 (Current Trend Line)
Breakout Level: 49,750 (Key psychological level for confirmation)
Support Level (if breakout occurs): 49,650 (Will act as a new support)

Bank Nifty: Dynamic Trendline Resistance and Support BreakdownChart Description:
Dynamic Resistance: Highlight the descending trendline acting as a strong resistance. Mark recent rejection points from this line.
Dynamic Support: Add the upward-sloping support line showing recent price bounces.
Key Levels:
47600: Potential target if support breaks, indicating a bearish continuation.
47600: Swing low zone, which could act as a short-term target in the bear trend.
Bearish Breakdown: Indicate potential price action if the dynamic support is breached, targeting levels below 47500.
Risk Management: Add possible stop-loss placement near the trendline resistance for short positions.
Idea Summary:
Watch for price rejection at the dynamic trendline resistance.
A breakdown of the dynamic support line will signal a bearish move.
Target levels: 47600 (swing low) and below 47500 in case of extended bearish momentum.
Disclaimer :
This analysis is for educational and informational purposes only. It is not financial advice or a recommendation to trade. Trading in financial markets involves significant risk, and you should only trade with capital you can afford to lose. Perform your due diligence or consult a financial advisor before making any trading decisions.
