Nifty Trading Strategy for 24th Feb 2025📊 NIFTY INTRADAY TRADING PLAN 📊
🔹 Strategy:
This plan is based on the breakout of a key level after a confirmed 15-minute candle close.
🟢 Buy Setup (Bullish Breakout)
✅ Entry Condition: Enter a buy position above the high of the 15-minute candle that closes above 22,921.
✅ Targets:
🎯 First Target: 22,966
🎯 Second Target: 23,038
🎯 Final Target: 23,099
✅ Stop Loss: Below the low of the entry candle.
✅ Risk Management: Follow a risk-reward ratio of at least 1:2.
🔴 Sell Setup (Bearish Breakdown)
✅ Entry Condition: Enter a sell position below the low of the 15-minute candle that closes below 22,700.
✅ Targets:
🎯 First Target: 22,653
🎯 Second Target: 22,608
🎯 Final Target: 22,562
✅ Stop Loss: Above the high of the entry candle.
✅ Risk Management: Avoid overleveraging and use a stop-loss strategy.
⚠ Important Notes:
📌 Wait for levels to come into play – If there is a big gap-up or gap-down, do not rush into a trade. Instead, wait for price action confirmation at the key levels.
📌 A lost opportunity could be capital saved – Patience is key! If the setup doesn't align, it's better to stay out than force a trade.
📌 Avoid trading during high-impact news events – Volatility can cause sudden price movements.
🚨 Disclaimer:
This analysis is for educational and informational purposes only and should not be considered financial or investment advice. I am not SEBI-registered. Trading in financial markets involves significant risk, and past performance is not indicative of future results. Trade responsibly and use proper risk management. 🚀📉
BANKNIFTY

Bank Nifty spot 48981.20 by the Daily Chart viewBank Nifty spot 48981.20 by the Daily Chart view
- Repeat Bottoms formed over the past few days 47525 to 48810 Index level
- Bullish "W" Double Bottom has been formed at Support Zone Index Band and is sustained
- Few Gap Up and Gap Down openings remain to get closed below Support Zone 47850 to 48075 for Bank Nifty Index Band levels

BANKNIFTY MATHEMATICAL LEVELSThese Levels are based on purely mathematical calculations.
How to use these levels :-
* Mark these levels on your chart.
* Safe players Can use 15 min Time Frame
* Risky Traders Can use 5 min. Time Frame
* When Candle give Breakout / Breakdown to any level we have to enter with High/Low of that breaking candle.
* Targets will be another level marked on chart
* Stop Loss will be Low/High of that Breaking Candle.
* Trail your SL with every candle.
* Avoid Big Candles as SL will be high then.
* This is one of the Best Risk Reward Setup.
For Educational purpose only

Support and Resistance Part 1A support and resistance level is simply a level in a market at which traders find a price to be overvalued or undervalued depending on current market dynamics. This creates a level in the market that can act as support or resistance depending on various factors surrounding each currency.
When it comes to charting support and resistance levels, keep it tidy and focus on the levels closest to your current price action. If you start scribbling levels all over the place, your chart will look like a toddler’s doodle, and you’ll lose track of which levels to keep an eye on and which ones carry more weight.
Support Zones: Rather than a precise price point, support is usually identified as a price zone. Within this zone, numerous market participants often place their buy orders. And a resistance level is a point where it’s likely to stop rising and start falling – these are always located ABOVE the current price.

Bank Nifty | WXYXZ formation | Currently in Z waveWXYX’Z is complex correction. In which WYZ are Corrective waves, X is retracement wave and can take any form.
Here WXY (Can also be considered as A)
X’ (or B) completed (at around approx 78% level) more pain looks less probable.
And now Z should come.
Z can be (61%, 100%, 127% of W or Y) Various books have various method for target calculations.
I generally take latest wave into Consideration for targets which is Y or X’.
Targets are based on Fibonacci relationships.
Disclaimer: I do not claim any profit or loss. I am not sebi registered and I have no guarantee of profits or gains or right predictions. These are just my opinion or thought ideas for learning the trade patterns, and feedback from experts to learn more. Please make any financial decisions after consulting your financial advisors.

BANKNIFTY: Elliott Wave AnalysisBANKNIFTY counting using Elliott Wave theory is done from 13th January.
We can see FLART- ZIGZAG- ZIGZAG CORRECTION marked in the chart.
The top made on 6th February is marked as wave (W) because it has 3 moves in it.
The fall after that was sharp and fast. This is the characteristic of wave (X).
Now, according to my analysis price is standing on wave (B) of wave (Y).
and as per previous observations, wave (Y) always crosses the top of wave (W), so we can expect it to go up to 100% extension.
This not any buying or selling recommendation.
This analysis is based on Elliott Wave theory and Fibonacci.
For educational purpose only.

Crisil Ltd.CRISIL Ltd. (NSE: CRISIL) is currently exhibiting a **Neutral** technical outlook, as indicated by various technical analysis indicators.
**Technical Indicators:**
- **Relative Strength Index (RSI):** The 14-day RSI stands at 38.43, suggesting a neutral market sentiment. citeturn0search3
- **Moving Averages:** The stock is trading below its 5-day, 10-day, 20-day, and 50-day simple and exponential moving averages, indicating a bearish trend. citeturn0search3
- **MACD (Moving Average Convergence Divergence):** The MACD value is -124.85, which is below the signal line, suggesting a bearish momentum. citeturn0search3
- **Stochastic Oscillator:** The Stochastic Oscillator is at 38.63, indicating a neutral market condition. citeturn0search3
**Support and Resistance Levels:**
- **Support:** The stock has support at ₹4,996.55. citeturn0search3
- **Resistance:** The resistance level is at ₹5,455.40. citeturn0search3
**Conclusion:**
CRISIL Ltd. is currently in a neutral technical position, with indicators suggesting neither strong bullish nor bearish momentum. Investors should monitor these indicators closely, as a breakout above resistance levels could signal a bullish trend, while a drop below support levels might indicate a bearish move. It's advisable to consider these technical factors alongside fundamental analysis and broader market conditions when making investment decisions.

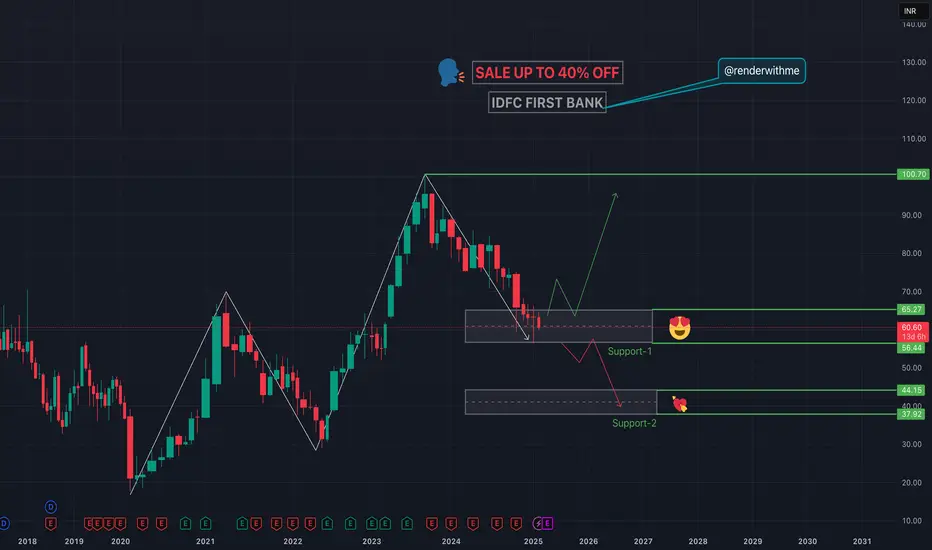
IDFC FIRST BANK - TECHNICAL#idfcfirstbank is an Indian private sector bank based in Mumbai, known for its wide range of banking services including personal banking, loans, accounts, cards, and investments. Here are some key levels in the chart about the bank #BankNifty #Nifty #renderwithme
What is option chain pcr ?The Put-Call Ratio (PCR) is a popular technical indicator used by investors to assess market sentiment. It is calculated by dividing the volume or open interest of put options by call options over a specific time period. A higher PCR suggests bearish sentiment, while a lower PCR indicates bullish sentiment.
The Put Call Ratio (PCR) is a popular metric traders use to gauge market sentiment. It is calculated by dividing the number of put options by the number of call options. A high PCR indicates a bearish sentiment, as more traders buy puts, expecting the market to decline
An options chain displays all available option contracts for a security, organized by expiration date and strike price. Options chains typically show each contract's bid price, ask price, volume, open interest, and implied volatility.

Database trading part 2Trading data is a sub-category of financial market data. It provides real-time information about stock and market prices as well as historical trends for assets such as equities, fixed-income products, currencies and derivatives.
The United Nations Comtrade database aggregates detailed global annual and monthly trade statistics by product and trading partner for use by governments, academia, research institutes, and enterprises
Licensee may not share the IBM Research DiF Dataset with any other party and is responsible for any unauthorized access or use of its copy of the DiF Dataset.” data is by trade secrets. misuse of private information depending on your country. a legal framework that protects trade secrets.

Nitiraj engineers Ltd20% Upper Circuit: Stock jumps after reporting 32,450% QoQ net profit growth in Q3
The shares of a micro cap Electronic stock engaged in manufacturing and selling of Electronic Weighing Scales, Currency Counting Machines, Taxi Fare Meters, etc hits 20 percent upper circuit after posting strong Q3 results with Net Profits surging 204 percent YoY and 32,450 percent QoQ.
keep an eye on it...

Bank Nifty spot 49099.45 by the Daily Chart view*Bank Nifty spot 49099.45 by the Daily Chart view*
- Just an FYI to note, for the current status of the Bank Nifty Index Daily Closure
- Close observation shows Double Bottom formed over past 3 days at 47819 to 48735 Index level
- Falling Resistance Trendline Breakout might just be sustained and we hope for the best to happen
- Bullish "W" Double Bottom formed at Support Zone 47850 to 48075 Index Band is yet been sustained

BANKNIFTY - LONG POSITIONS ON RETRACEMENT?Symbol - BANKNIFTY
CMP - 49300
Bank Nifty has recently approached a crucial resistance zone, positioned between the 50600 and 51000 levels. This zone has acted as a significant barrier to upward movement. Observing the recent price action, Bank Nifty has tested this resistance area multiple times, confirming its strength.
From a technical standpoint, the index has formed a double bottom pattern near 48000 levels, which is a critical support zone. This pattern typically indicates a potential reversal of the previous downtrend, as the price failed to breach the 48000 support level and instead demonstrated a strong recovery. The double bottom formation suggests a buildup of bullish momentum from the support region.
Currently, Bank Nifty has shown a notable retracement from the resistance zone. Given the pattern formation and the recent retracement, the expectation is for the bullish trend to resume. A recovery from the current levels could lead Bank Nifty to retest the 50500 - 51000 resistance zone again. Should the index successfully break above this resistance area and sustain levels above it, the next target is likely to be around the 51800 level.
However, the bullish outlook is contingent upon the index holding its key support levels. The critical support range lies between 48800 - 48600 area. Should Bank Nifty fail to maintain this support and break below it, the trend may turn bearish, triggering a potential sell-off and driving prices lower, with the next possible support zones coming into play at lower levels.
In summary, the technical analysis suggests a favorable bullish scenario, provided the key support levels hold. If the resistance zone around 50800 is breached, further upside momentum toward the 51800 region is possible. However, failure to hold the support zone could lead to a reversal in the trend, and further downside could materialize.

Nifty bounce expected.Nifty is showing divergence on support and bank nifty already showing reversal with divergence.
Nifty is strong till trading above 22700. Buy on dip market.

Nifty Intraday Trading Strategy for 14th Feb 2025📊 Nifty Intraday Trading Strategy – Key Levels 📊
📌 Buy Setup
🔹 Buy Above: 23,185 (Only after confirmation)
🎯 Target 1: 23,220
🎯 Target 2: 23,260
🎯 Target 3: 23,310
📍 Stop Loss: Below the 15-minute candle low after breakout confirmation.
🔹 Conditions for Buying:
✅ A 15-minute candle must close above 23,185 to confirm the breakout.
✅ Enter a buy position only if the price crosses above the high of this 15-minute candle.
✅ Wait for a retest or sustained momentum before entering a trade.
✅ Ensure volume confirmation and market trend alignment before taking a position.
📌 Sell Setup
🔹 Sell Below: 22,964 (Only after confirmation)
🎯 Target 1: 22,910
🎯 Target 2: 22,860
🎯 Target 3: 22,820
📍 Stop Loss: Above the 15-minute candle high after breakdown confirmation.
🔹 Conditions for Selling:
✅ A 15-minute candle must close below 22,964 to confirm the breakdown.
✅ Enter a sell position only if the price drops below the low of this 15-minute candle.
✅ Avoid early entries—wait for a proper close below this level.
✅ Watch for volume confirmation and trend continuation before entering a short position.
⚠ Important Notes:
🔸 Risk Management: Always use stop-loss and proper position sizing to protect your capital.
🔸 Market Conditions: Consider global cues, economic data, and overall sentiment before trading.
🔸 Volatility Caution: Avoid trading during high-impact news events and sudden spikes.
📌 Disclaimer: I am not a SEBI-registered analyst. This analysis is for educational purposes only and should not be considered financial advice. Please consult a certified financial professional before making any trading decisions. Trade at your own risk.

BANKNIFTY MATHEMATICAL LEVELSThese Levels are based on purely mathematical calculations.
How to use these levels :-
* Mark these levels on your chart.
* Safe players Can use 15 min Time Frame
* Risky Traders Can use 5 min. Time Frame
* When Candle give Breakout / Breakdown to any level we have to enter with High/Low of that breaking candle.
* Targets will be another level marked on chart
* Stop Loss will be Low/High of that Breaking Candle.
* Trail your SL with every candle.
* Avoid Big Candles as SL will be high then.
* This is one of the Best Risk Reward Setup.
For Educational purpose only

What is the use of RSI in trading ?Successful trades often occur when the RSI crosses above 30 (indicating a buy signal) or below 70 (indicating a sell signal). Adjusting the RSI period to 9 can make it more sensitive to price changes and be suitable for more active trading strategies.
The RSI is helpful for market participants in identifying trends. In a strong uptrend, the RSI typically stays between 40 and 90, with the 40-50 range acting as support. In a strong downtrend, the RSI ranges from 10 to 60, with the 50-60 range serving as resistance.
The relative strength index (RSI) is a momentum indicator used in technical analysis. RSI measures the speed and magnitude of a security's recent price changes to detect overbought or oversold conditions in the price of that security.

How to make a diverse portfolio in the stock market?How to create a diversified stock portfolio?
A diversified portfolio starts with the understanding that you'll have a variety of asset classes. The percentage you invest in each asset class depends on your risk tolerance, time horizon, and goals. A common guideline is a 60/40 split between stocks and bonds, but other model allocations include: Aggressive.The 5% rule of diversification states that one stock should not make up more than 5% of the investor's overall portfolio. Every investor's financial goals will differ as well as their analysis, so this rule may not matter to certain investors and in fact, some investors may want a large concentration in one stock.

what is the use of candlestick patterns in trading ?What is a candlestick? A candlestick is a way of displaying information about an asset's price movement. Candlestick charts are one of the most popular components of technical analysis, enabling traders to interpret price information quickly and from just a few price bars.
Traders use candlestick charts to determine possible price movement based on past patterns. Candlesticks are useful when trading as they show four price points - open, close, high, and low - throughout the period the trader specifies. Many algorithms are based on the price information shown in candlestick charts.

What is the role of timeframes in trading?A general rule is that the longer the time frame, the more reliable the signals being given. As you drill down in time frames, the charts become more polluted with false moves and noise. Ideally, traders should use a longer time frame to define the primary trend of whatever they are trading
The 5-3-1 strategy is especially helpful for new traders who may be overwhelmed by the dozens of currency pairs available and the 24-7 nature of the market. The numbers five, three, and one stand for: Five currency pairs to learn and trade. Three strategies to become an expert on and use with your trades.

Best Statergies to do Database trading ?9 data-driven strategies for improved trading decisions
Volatility graphs. Volatility surface mapping is one method that helps decide the best approach in any given market. ...
Moving averages and regression analysis. ...
Machine learning. ...
Computer simulations. ...
The Bollinger Bands. ...
AI investing. ...
Unconventional data. ...
Using new data.
A trader needs to collect three types of market data for algo trading; real-time data, delayed data, and historical data. Real-time data is used while a trader executes an order, it is taken into account at the time of the trade.

Bank of Baroda - Technical - Monthly#Bank of Baroda #BoB is one of India's leading public sector banks, established in 1908 and headquartered in #Vadodara #Gujarat It's known for its extensive network both domestically and internationally. Here's a comprehensive chart look at recent developments based on available data:

How to become a profitable trader ?8 Trading Tips to Help You Increase Your Net Profitability
Avoid Overtrading. Traders are ambitious, sometimes too much so. ...
Avoid Under-trading. ...
Take Control of Your Losses. ...
Simplify Your Approach. ...
Trade Robotically. ...
Learn Your Strengths and Weaknesses. ...
Double Down on What's Working. ...
Don't be Afraid to Go Back to Square One.
