BANKNIFTY : Trading levels and plan for 07-Apr-2025📊 BANK NIFTY TRADING PLAN – 07-Apr-2025
Chart Timeframe: 15-Minute
Previous Close: 51,515.25
🎯 Key Zones to Watch:
🟥 Profit Booking Zone: 52,228 – 52,422
🟥 Opening / Last Intraday Resistance: 51,780
🟧 Opening Support Zone: 51,319 – 51,405
🟩 Opening / Last Intraday Support: 50,990
🟢 Support / Sideways Zone: 50,437 – 50,664
🔼 Scenario 1: Gap-Up Opening (200+ points above 51,780)
If Bank Nifty opens above 51,980+ , it will likely be in the bullish zone, entering the Sideways / Profit Booking area (52,228 – 52,422) . This zone may not be ideal for fresh long entries unless there's strong momentum.
📌 Plan of Action:
Wait for a sustained move above 52,228 with a strong candle close (15-min or hourly). Only then consider entering long positions toward 52,370 – 52,500 .
If price opens in this zone and starts rejecting near 52,228 – 52,422 , look for a reversal signal (e.g., bearish engulfing) to take low-risk short trades.
Avoid longs if the price opens too close to 52,400 – it's a high-risk zone for reversals and profit booking.
Safer long entries only on retest and reclaim of 51,780 if breakdown occurs post-gap-up.
💡 Educational Tip: Gap-ups near resistance are often traps. Let the first 15–30 minutes pass and observe if the price holds above the breakout zone. Confirmation is key before jumping in.
⚖️ Scenario 2: Flat Opening (Near 51,515 – 51,542 region)
If Bank Nifty opens flat near the previous close, it’s trading near the equilibrium. Immediate zones to watch are the Opening Resistance at 51,780 and Opening Support Zone at 51,319 – 51,405 .
📌 Plan of Action:
Wait for price direction – a move above 51,780 with strength can lead to a rise toward 52,000 → 52,228+ .
If price slips below 51,405 , it may revisit 51,319 → 50,990 for support.
Avoid trading in chop between 51,319 – 51,780 unless clear structure forms.
Use the “inside range” to fade extremes — buy near 51,319 with reversal confirmation and sell near 51,780 if rejection is seen.
💡 Educational Tip: Sideways markets are excellent for mean-reversion traders but dangerous for breakout traders. Avoid overtrading inside tight ranges and wait for confluence setups.
🔽 Scenario 3: Gap-Down Opening (200+ points below 51,319)
A gap-down below 51,100 opens doors to retest support areas near 50,990 → 50,664 → 50,437 . The market sentiment in this case would likely be weak.
📌 Plan of Action:
Watch if price takes support near 50,990 . A strong bounce can take prices back to test 51,319 – 51,405 .
If breakdown occurs below 50,664 , expect acceleration toward the final support at 50,437 .
Look for reversal signs (like hammer candles) near 50,437 to go long for a dead-cat bounce.
Avoid fresh shorting near 50,437 – it’s a buying zone unless price breaks down sharply with volume.
💡 Educational Tip: Panic gap-downs can present excellent reward-to-risk opportunities if prices bounce from strong demand zones. Be patient and wait for candle confirmation before entering.
🛡️ Risk Management Tips for Options Trading
✅ 1. Avoid Buying OTM Options on Gaps: Gaps increase IV, and premiums are inflated. Wait for a cooldown.
✅ 2. Prefer Spread Strategies: Use bull call or bear put spreads to reduce theta and vega risk.
✅ 3. Use Candle-Based Stop Loss: Never hold hope trades. Exit on 15-min close below key levels.
✅ 4. Position Sizing is King: Don’t risk more than 2% of your capital on a single trade.
✅ 5. Trade Only After Confirmation: The first 15–30 mins are volatile. Let direction establish before entering.
✅ 6. Avoid Selling Options Too Early: Wait for key resistance or support zones to be tested for good premium decay.
🧾 Summary & Conclusion
📍 Bullish Above: 51,780 → 52,228 → 52,422**
📍 Support Zones: 51,319 – 51,405 → 50,990 → 50,664 → 50,437**
📍 Key Trigger Levels:
🔼 Long entry confirmation above 51,780
🔽 Breakdown trigger below 50,990
📌 Avoid trading blindly on open. The best trades form after retest or rejection from the zones . Let the chart give you confirmation. Trade with a risk-defined mindset and avoid emotional decisions.
🧘♂️ Patience and discipline will outperform impulse every single time.
⚠️ Disclaimer
I am not a SEBI-registered analyst . The information and levels shared here are purely for educational purposes . Please do your own research or consult with your financial advisor before making any trading decisions.
Bankniftyanalysis

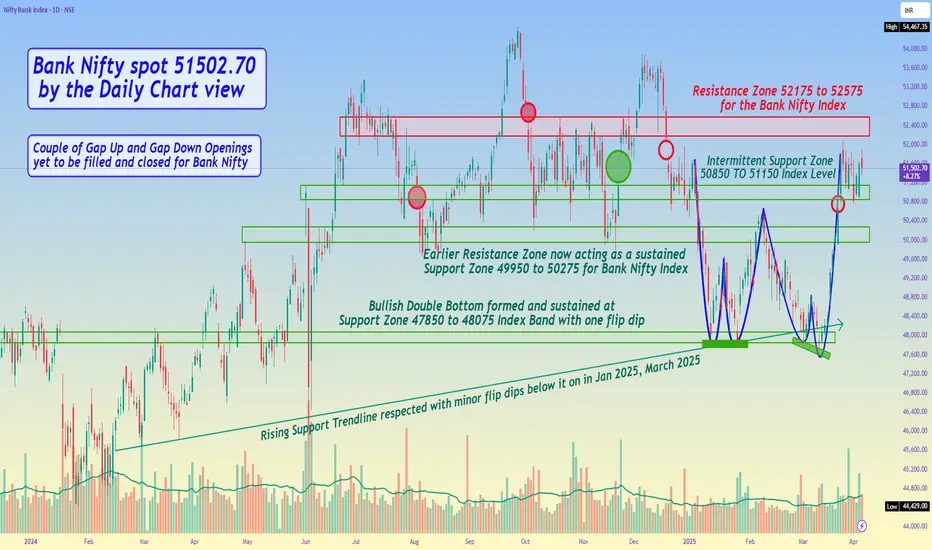
Bank Nifty spot 51502.70 by the Daily Chart viewBank Nifty spot 51502.70 by the Daily Chart view
- Intermittent Support Zone 50850 TO 51150 Index Level
- Resistance Zone 52175 to 52575 for the Bank Nifty Index would remain a good hurdle to cross
- Bank Nifty may be expected to remain under consolidation between Intermittent Support Zone and Resistance Zone prior to any strong breakout attempts to be seen
BANKNIFTY : Trading levels and plan for 04-Apr-2025📌 BANK NIFTY Trading Plan – 04-Apr-2025
📊 Market Overview:
Bank Nifty closed at 51,581.55, showing a steady recovery but still facing resistance from a downward trendline. The opening resistance (51,781) and opening support (51,402 – 51,202) will be crucial in determining the trend for the day.
To navigate this session effectively, we will analyze all potential market opening scenarios and provide an actionable trading strategy.
🔼 Scenario 1: Gap-Up Opening (200+ points above 51,781)
A gap-up above 51,781 signals bullish momentum, but strength near 52,132 – 52,251 (last intraday resistance zone) will determine if the rally continues.
✅ Plan of Action:
If Bank Nifty sustains above 51,781, expect a move towards 52,132 → 52,251. A breakout above 52,251 could trigger further buying towards 52,500.
If Bank Nifty faces rejection at 52,132 – 52,251, expect a pullback towards 51,781, where it may either bounce or break down.
Avoid aggressive long positions near 52,251 unless a strong breakout with volume occurs.
🎯 Pro Tip: If the gap-up struggles to hold 51,781 in the first 15 minutes, profit booking may follow, leading to consolidation or a dip.
⚖ Scenario 2: Flat Opening (Within ±200 points, around 51,581)
A flat opening suggests indecision, where price action around the opening support (51,402 – 51,202) and resistance (51,781) will set the trend.
✅ Plan of Action:
Upside case: If Bank Nifty sustains above 51,781, expect a test of 52,132 – 52,251.
Downside case: If Bank Nifty slips below 51,402, it could test 51,202 (last intraday support), followed by 50,942 if selling intensifies.
No Trade Zone: Avoid trading inside 51,402 – 51,781 unless a strong breakout or breakdown occurs.
🎯 Pro Tip: Wait for a strong 15-minute candle close outside the range before initiating a trade to avoid false breakouts.
🔽 Scenario 3: Gap-Down Opening (200+ points below 51,202)
A gap-down below 51,202 indicates bearish sentiment, with key support at 50,942 being the last buyer’s zone.
✅ Plan of Action:
If Bank Nifty sustains below 51,202, expect a decline towards 50,942. A breakdown below 50,942 could push the index towards 50,700 – 50,500.
If Bank Nifty finds support at 50,942 and rebounds, look for a possible recovery towards 51,202 → 51,402.
Avoid panic shorting on a gap-down open; wait for confirmation before entering trades.
🎯 Pro Tip: A gap-down near a strong support zone could trigger a short-covering bounce. Wait for a reversal signal before taking long positions.
⚠️ Risk Management Tips for Options Traders
🛑 Avoid Over-leveraging – Stick to defined risk per trade and avoid emotional trading.
⌛ Theta Decay Awareness – If the market remains sideways, option premiums will erode rapidly.
🔄 Use Spreads for Risk Control – Consider hedged positions like Bull Call or Bear Put spreads instead of naked options.
📊 Trade at Key Levels – Avoid random trades; focus on high-probability setups.
📌 Summary & Conclusion
📍 Key Levels to Watch:
🟥 Resistance: 51,781 → 52,132 → 52,251
🟧 Opening Support/Resistance Zone: 51,402 – 51,202
🟩 Support: 50,942 → 50,700
🔸 Bullish Bias: Above 51,781, targeting 52,132 – 52,251
🔸 Bearish Bias: Below 51,202, expecting a drop towards 50,942 – 50,700
🔸 Neutral/Choppy: Inside 51,402 – 51,781, wait for a breakout
🎯 Final Advice:
Stick to the trading plan and execute trades only at key levels.
The first 15-30 minutes will define market sentiment—observe price action carefully.
Risk management is crucial—never risk more than you can afford to lose.
📢 Disclaimer
I am not a SEBI-registered analyst. This trading plan is for educational purposes only. Please conduct your own research or consult a financial advisor before making any trades.
🚀 Stay updated with real-time trade setups!

BANKNIFTY - Intraday trading levels and plan for 03-Apr-2025📌 BANK NIFTY Trading Plan – 03-Apr-2025
📊 Market Overview:
BANK NIFTY closed at 51,372.75, recovering from a significant dip. The immediate support/resistance zone (51,402 – 51,372) will be crucial for setting the direction. The price action around 51,751 (last intraday support) and 51,071 (opening support) will determine the market trend.
To trade effectively, let’s analyze all possible opening scenarios and structure a trading plan accordingly.
🔼 Scenario 1: Gap-Up Opening (200+ points above 51,751)
A gap-up above 51,751 signals bullish sentiment, but the price action near the major resistance zone (52,129) will decide whether the rally continues.
✅ Plan of Action:
If BANK NIFTY sustains above 51,751, expect further upside towards 52,129. A strong breakout above 52,129 with volume could push the index towards 52,300 – 52,450.
If the price struggles at 51,751 – 52,129, expect profit booking, leading to a retest of 51,600 – 51,500.
Avoid aggressive longs at 52,129 unless a breakout with strong momentum occurs. Look for either a retest entry or breakout confirmation before entering.
🎯 Pro Tip: If the gap-up fails to hold 51,751 within the first 15 minutes, it may indicate weak bullish strength, increasing the probability of a reversal.
⚖ Scenario 2: Flat Opening (Within ±200 points, around 51,372)
A flat opening suggests indecision, where price action near the opening support/resistance zone (51,402 – 51,372) will determine the trend.
✅ Plan of Action:
Upside case: If BANK NIFTY holds above 51,402, expect a move towards 51,751. A breakout above 51,751 could push the index towards 52,129.
Downside case: If BANK NIFTY falls below 51,372, expect a decline towards 51,256 → 51,071. A breakdown below 51,071 confirms a bearish trend.
No Trade Zone (51,372 – 51,402): Avoid trading within this range unless a clear breakout or breakdown occurs.
🎯 Pro Tip: The first 15-30 minutes will define the direction. Wait for a strong 15-minute candle closing outside the range before taking a position.
🔽 Scenario 3: Gap-Down Opening (200+ points below 51,071)
A gap-down below 51,071 suggests bearish sentiment, with potential downside towards 50,884 (last intraday support).
✅ Plan of Action:
If BANK NIFTY sustains below 51,071, expect a drop towards 50,884. A breakdown below 50,884 could push prices further down to 50,700 – 50,500.
If BANK NIFTY finds support at 50,884 and rebounds, look for a potential recovery towards 51,071 → 51,256. A breakout above 51,256 would signal a bullish reversal.
Be cautious of bear traps – If the market gaps down but quickly recovers, short-covering rallies can trigger a sharp upside move.
🎯 Pro Tip: If the gap-down happens near a strong support zone, wait for bullish confirmation (e.g., reversal candlestick patterns) before going long.
⚠️ Risk Management Tips for Options Traders
🛑 Avoid Over-leveraging – Maintain proper position sizing to control risk.
⌛ Theta Decay Awareness – Sideways movement will erode option premiums; avoid buying options in a choppy market.
🔄 Use Spreads for Risk Control – Instead of naked options, use spreads to hedge and improve probabilities.
📊 Trade at Key Levels – Avoid random trades; focus on well-defined support and resistance zones.
📌 Summary & Conclusion
📍 Key Levels to Watch:
🟥 Resistance: 51,751 → 52,129 → 52,300
🟧 Opening Support/Resistance Zone: 51,402 – 51,372
🟩 Support: 51,256 → 51,071 → 50,884 → 50,700
🔸 Bullish Bias: Above 51,751, targeting 52,129 – 52,300
🔸 Bearish Bias: Below 51,071, expecting a drop towards 50,884 – 50,700
🔸 Neutral/Choppy: Inside 51,372 – 51,402, avoid unnecessary trades
🎯 Final Advice:
Stick to the structured trading plan and execute only at key levels.
Avoid emotional trading—wait for confirmation before entering trades.
The first 15-30 minutes after market open will provide better clarity—observe price action before committing to a trade.
📢 Disclaimer
I am not a SEBI-registered analyst. This trading plan is for educational purposes only. Please conduct your own research or consult a financial advisor before making any trades.
🚀 Stay updated with live trade setups!

Option traderOptions trading is a type of financial trading that allows investors to buy or sell the right to purchase or sell an underlying asset at a fixed price, at a future date. Options trading operates on the basis that the buyer has the option to exercise the contract but is not under any obligation to do so.

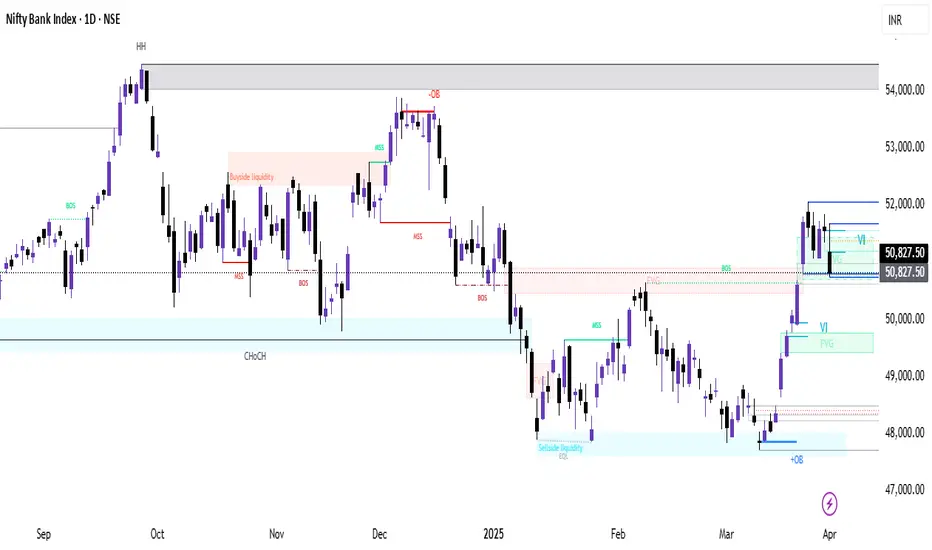
Nifty Bank Index (BANKNIFTY) Analysis & Trade Setup Timeframes & Context
We have three different timeframes: Daily (1D), 4-Hour (4H), and 1-Hour (1H).
1D gives us the macro view, showing key liquidity zones, order blocks (OBs), and break of structure (BOS).
4H refines our zones, helping to confirm areas of interest.
1H is the execution timeframe, where we define entry, stop-loss, and profit targets.
1️⃣ Higher Timeframe Bias - Daily Chart
📌 Key Observations:
A strong rejection from a higher timeframe supply zone near 52,000 - 52,400.
A liquidity grab (buy-side liquidity sweep) followed by a market structure shift (MSS) confirms bearish intent.
Break of Structure (BOS) indicates a downward trend continuation.
Fair Value Gaps (FVGs) suggest imbalance that the price may revisit before continuation.
📌 Bias: Bearish, expecting price to move lower.
📌 Key Levels:
Supply Zone (Resistance): 51,800 - 52,400
Demand Zone (Support): 48,000 - 49,000
Potential Target: 49,000 (near previous liquidity and OB)
2️⃣ Mid-Timeframe Confirmation - 4H Chart
📌 Key Observations:
A strong volume imbalance (VI) after the downward move.
Price has consolidated inside a 1H Fair Value Gap (FVG), signaling a possible retracement.
The previous low at 50,750 is being tested multiple times, suggesting liquidity is building.
📌 Bias: Bearish
Looking for a retracement to 51,200 - 51,400 (FVG area) before continuing downward.
Break below 50,750 confirms further selling.
📌 Key Levels:
Resistance: 51,200 - 51,400 (FVG + OB)
Support: 50,400 (short-term), 49,500 (major)
3️⃣ Entry Plan - 1H Execution Chart
📌 Trade Idea:
Wait for price to retest 51,200 - 51,400 (FVG zone).
If we see rejection (e.g., bearish engulfing candle or liquidity sweep), enter a short trade.
📌 Trade Parameters:
Entry: 51,200 - 51,400
Stop Loss: 51,600 (above OB)
Target 1 (T1): 50,400
Target 2 (T2): 49,500
Risk-Reward Ratio (RRR): ~1:3 or better
📌 Alternative Scenario:
If price breaks above 51,600, we invalidate the short setup.
In that case, we will reassess for a bullish continuation.
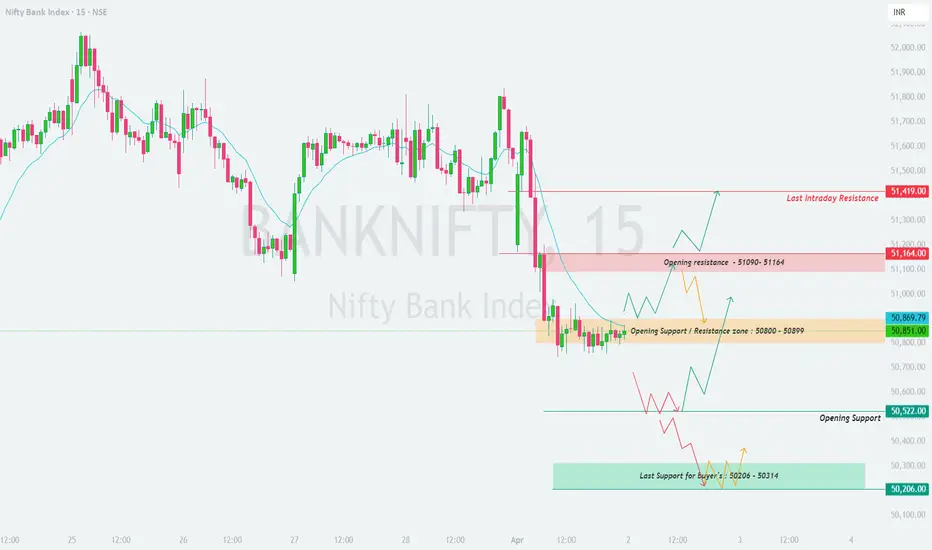
BANKNIFTY : Intraday Trading levels and Plan for 02-Apr-2025📌 BANK NIFTY Trading Plan – 01-Apr-2025
📊 Market Overview:
Bank Nifty closed at 50,851, consolidating near the Opening Support Zone (50,800 – 50,899). This price action suggests that the market is at a critical juncture, where the next move depends on price action confirmation at key levels.
To ensure a strategic and disciplined approach, let’s analyze all possible opening scenarios and their corresponding trading plans.
🔼 Scenario 1: Gap-Up Opening (200+ points above 51,100)
A gap-up above 51,100 indicates bullish momentum, but whether it sustains or reverses depends on the 51,164 – 51,419 resistance zone. This level is crucial as it can either lead to further upside or trigger profit booking.
✅ Plan of Action:
If Bank Nifty sustains above 51,164, expect a rally towards 51,419 → 51,600. If it breaks 51,600, a further bullish move toward 51,750 is possible.
If price faces resistance at 51,164 and starts reversing, expect a pullback toward 50,900. A breakdown below 50,800 can lead to further weakness.
Avoid aggressive longs inside 51,090 – 51,164, as this is a potential rejection zone. Wait for a decisive breakout or a bearish rejection to act accordingly.
🎯 Pro Tip: If the gap-up starts fading within 15-30 minutes, it signals a lack of buyer strength and increases the chances of a reversal.
⚖ Scenario 2: Flat Opening (Within ±200 points, around 50,850)
A flat opening near 50,850 suggests indecision, where price action will determine the next direction. The key battle will be between 50,800 support and 51,090 resistance.
✅ Plan of Action:
Upside case: If Bank Nifty breaks and sustains above 51,090, it may head towards 51,164 → 51,419. Monitor price action near these resistance levels before entering fresh longs.
Downside case: If Bank Nifty breaks below 50,800, it could test 50,522 → 50,314. A breakdown below 50,314 will shift the trend bearish.
Avoid trading inside the No Trade Zone (50,800 – 51,090), as price could consolidate before a breakout.
🎯 Pro Tip: In a flat opening, wait for a strong 15-minute candle close above or below key levels before entering trades.
🔽 Scenario 3: Gap-Down Opening (200+ points below 50,600)
A gap-down below 50,600 could indicate selling pressure, but buyers may step in around the 50,314 – 50,206 support zone.
✅ Plan of Action:
If Bank Nifty sustains below 50,522, expect a decline towards 50,314 → 50,206. A breakdown below 50,206 could lead to a sharp fall towards 50,000.
If Bank Nifty finds support at 50,206 and rebounds, it may recover towards 50,522 → 50,800. A strong close above 50,800 will shift momentum back to the bulls.
Be cautious of bear traps – If the market gaps down but quickly recovers, it could trigger short covering, leading to a strong upside reversal.
🎯 Pro Tip: If the gap-down occurs near a strong buyer’s support zone, wait for a bullish price action confirmation before entering long trades.
⚠️ Risk Management Tips for Options Traders
🔹 Avoid over-leveraging – Use proper position sizing to manage risk.
🔹 Theta Decay Awareness – If the market consolidates, option premiums will erode rapidly.
🔹 Use Spreads for Protection – Instead of naked options, use spreads to limit risk and improve probability.
🔹 Trade at Key Levels – Avoid impulsive trades; focus on defined support and resistance zones.
📌 Summary & Conclusion
📍 Key Levels to Watch:
🟥 Resistance: 51,090 → 51,164 → 51,419
🟧 No Trade Zone: 50,800 – 51,090
🟩 Support: 50,522 → 50,314 → 50,206
🔸 Bullish Bias: Above 51,090, targeting 51,164 – 51,419
🔸 Bearish Bias: Below 50,600, expecting a fall towards 50,314 – 50,206
🔸 Neutral/Choppy: Inside 50,800 – 51,090, avoid unnecessary trades
🎯 Final Advice:
Stick to the structured trading plan and execute only at key levels.
Avoid emotional trading—wait for confirmation before entering trades.
The first 15-30 minutes after market open will provide better clarity—observe price action before committing to a trade.
📢 Disclaimer
I am not a SEBI-registered analyst. This trading plan is for educational purposes only. Please conduct your own research or consult a financial advisor before making any trades.
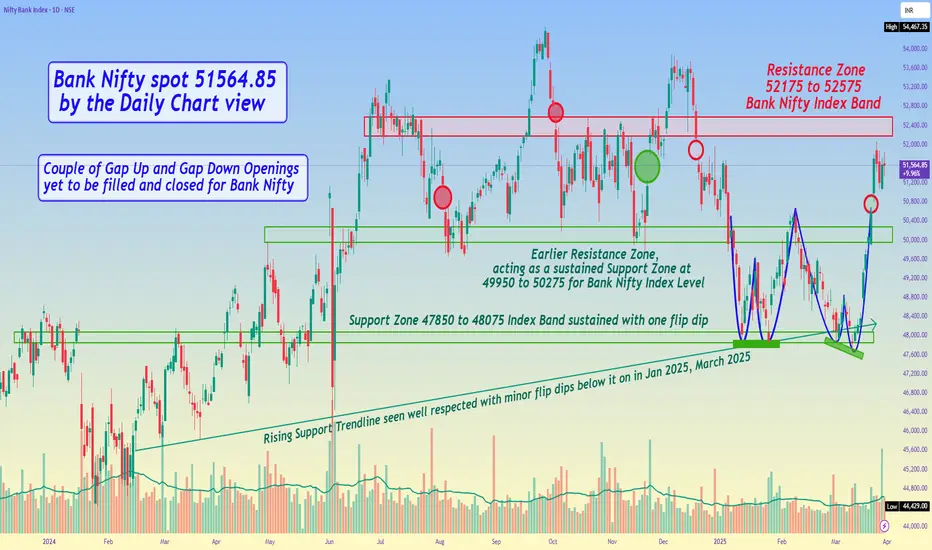
Bank Nifty spot 51564.85 by the Daily Chart view - Weekly updateBank Nifty spot 51564.85 by the Daily Chart view - Weekly update
- Resistance Zone 52175 to 52575 for the Bank Nifty Index Band
- Couple of Gap Up and Gap Down Openings yet to be filled and closed for Bank Nifty
- Earlier Resistance Zone, acting as a sustained Support Zone at 49950 to 50275 for Bank Nifty Index Level
- Both the Bullish "W" Double Bottoms are sustained and well shouldered by the Support Zone Lower Band
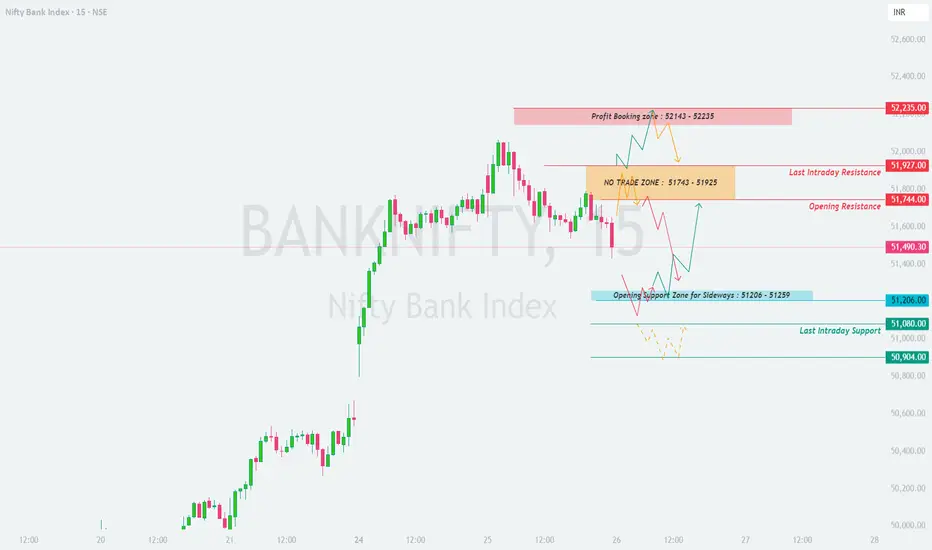
BANKNIFTY : Intraday Trading Levels and Plan for 26-Mar-2025📌 BANKNIFTY Trading Plan – 26-Mar-2025
📊 Current Market Status:
BANKNIFTY closed at 51,490.30, witnessing some selling pressure from intraday highs. The structure remains uncertain, with key resistance and support levels dictating tomorrow's action. Let's break down the plan for different opening scenarios.
🔼 Scenario 1: Gap-Up Opening (200+ points)
If BANKNIFTY opens above 51,700, we need to assess the momentum before jumping in. A gap-up opening near 51,927 (last intraday resistance) might trigger initial profit booking.
✅ Plan of Action:
If prices sustain above 51,927, expect a move towards the profit booking zone at 52,143 – 52,235. A breakout above 52,235 could indicate bullish momentum.
If the index rejects 51,927 and starts reversing, a short opportunity can arise, targeting 51,744 → 51,490 as intraday levels.
Avoid aggressive longs if price remains within No Trade Zone (51,743 – 51,925). Wait for a decisive move.
🎯 Pro Tip: Avoid chasing the gap-up immediately—let the market settle and confirm strength above resistance before going long.
⚖ Scenario 2: Flat Opening (Within ±200 points)
A flat opening around 51,490 means BANKNIFTY is indecisive. Here, it’s crucial to wait for confirmation at key levels.
✅ Plan of Action:
Upside case: If the index breaks above 51,744, we could see a retest of 51,927. A strong breakout above this can push towards 52,143 → 52,235.
Downside case: A breakdown below 51,490 could trigger selling pressure towards 51,206 – 51,080.
Neutral Approach: Avoid trading in the No Trade Zone (51,743 – 51,925) unless a clear breakout occurs.
🎯 Pro Tip: In a flat opening, options traders can look for range-bound strategies like Iron Condors or straddle sells if volatility is low.
🔽 Scenario 3: Gap-Down Opening (200+ points)
If BANKNIFTY opens below 51,206, bearish sentiment might dominate, but we must assess support zones.
✅ Plan of Action:
If price sustains below 51,206, expect a drop towards 51,080 and 50,904. A further breakdown could trigger heavy selling.
If price takes support at 51,206 – 51,259 and rebounds, look for a potential pullback entry with stop-loss below 51,200.
Watch for trap setups—if the market opens low but quickly reverses above 51,206, it could be a bear trap leading to a short squeeze.
🎯 Pro Tip: In a gap-down scenario, avoid panic selling; instead, wait for a retest of breakdown levels before entering trades.
⚠️ Risk Management Tips for Options Traders
🔹 Avoid over-leveraging – Trade within your risk capacity and don't go all in.
🔹 Time decay factor – If taking options trades, be mindful of premium decay, especially near expiry.
🔹 Hedge your trades – Use spreads instead of naked options to reduce risk.
🔹 Wait for confirmation – Don't enter trades blindly; wait for price action signals.
📌 Summary & Conclusion
📍 Key Levels to Watch:
🟥 Resistance: 51,744 → 51,927 → 52,143 – 52,235
🟧 No Trade Zone: 51,743 – 51,925
🟦 Support: 51,206 – 51,259 → 51,080 → 50,904
🔸 Bullish Bias: Above 51,927 for targets of 52,143 – 52,235
🔸 Bearish Bias: Below 51,206 for a move towards 51,080 and lower
🔸 Neutral/Range-Bound: If price remains between 51,743 – 51,925
🎯 Final Advice:
Follow the levels with discipline.
Avoid overtrading in No Trade Zones.
Let the first 15-30 minutes settle before taking aggressive trades.
📢 Disclaimer
I am not a SEBI-registered analyst. This analysis is for educational purposes only. Please do your research or consult with a financial advisor before making trading decisions.
🚀 Stay updated on live trading levels & setups!
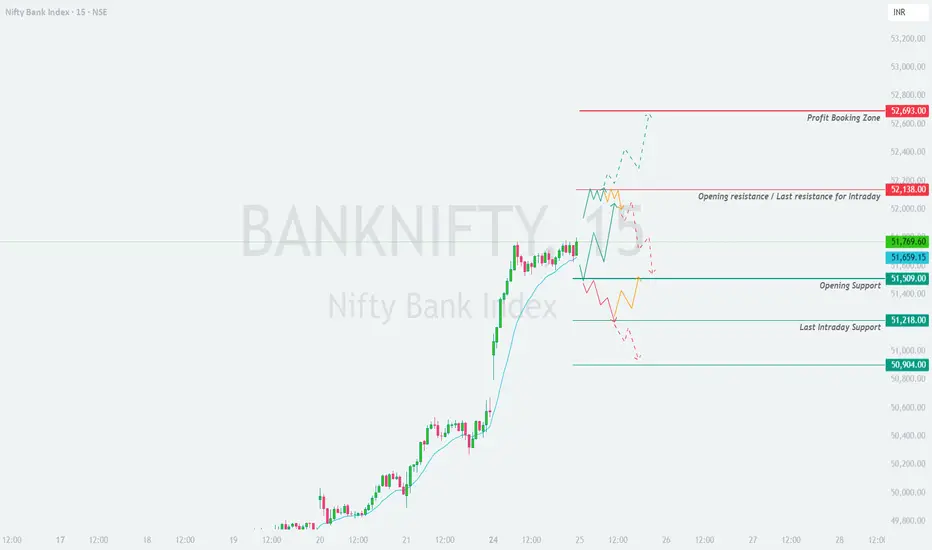
BANKNIFTY : Intraday Levels and Plan for 25-Mar-2025📅 BANK NIFTY Trading Plan – 25th March 2025
⏰ Timeframe: 15-min | 📊 Index Spot Reference: 51,769
🚀 Opening Scenario 1: GAP-UP Opening (200+ points)
If BANK NIFTY opens above 51,969+ (200 points or more):
Monitor price action near the Opening Resistance / Last Intraday Resistance Zone – 52,138 . This is a crucial level where sellers might become active. A strong bullish candle above 52,138 , sustained for 15 mins with volume, could trigger momentum towards the Profit Booking Zone around 52,693 . However, if price shows rejection signs (doji, shooting star, or long upper wicks) at 52,138 , consider shorting with SL above 52,200 on a 15-min candle close basis. The move towards 52,693 is likely to attract profit booking. Use this zone as a potential exit for long positions or consider building short positions only if reversal candles appear. Any failure to hold above 52,138 may lead to a retest of the support zone at 51,659 – 51,509 .
🧠 Tip: Avoid aggressive longs directly at resistance. Wait for confirmation of breakout or signs of reversal. Option traders can use debit spreads (buy ATM CE, sell OTM CE) to limit risk.
📈 Opening Scenario 2: FLAT Opening (within ±200 points)
If BANK NIFTY opens near 51,700–51,800:
A range-bound session is possible early on. Let the first 15–30 minutes play out to gauge direction. Sustained price action above 51,769 can retest 52,138 . Bulls must close candles above this level to expect higher targets like 52,693 . Breakdown below 51,659 increases the chances of testing the Opening Support at 51,509 . Reversal entries can be initiated near support levels if bullish candle patterns appear with confirmation. This zone offers both long and short opportunities based on real-time price reaction. Don’t preempt trades.
🧠 Tip: If expecting a sideways day, option sellers may consider short strangles or iron condors with tight SL. Always manage positions with proper hedge or SL orders.
📉 Opening Scenario 3: GAP-DOWN Opening (200+ points)
If BANK NIFTY opens near or below 51,500:
Immediate support lies near 51,509 . If this breaks on strong bearish candles, expect a fall towards 51,218 and further down to 50,904 . Aggressive sellers might enter if 51,509 is breached decisively. However, wait for confirmation rather than chasing the opening candle. Any recovery attempt will face resistance near 51,659 – 51,769 . Watch for rejection to re-enter shorts. Reversal buyers may consider 51,218 or 50,904 if bullish engulfing or hammer patterns appear. Ideal for scalping trades. Stay nimble, as gap-down days can be volatile and trap both bulls and bears.
🧠 Tip: Avoid buying puts after large gaps – premiums are inflated. Consider bear put spreads or calendar spreads to minimize theta decay.
🛡️ Risk Management Tips for Options Traders:
Never allocate more than 2–5% of your capital on a single trade. Always trade with SL (Stop Loss) in place – do not hold losing positions hoping for recovery. Use spreads instead of naked options to reduce theta impact and protect against sudden reversals. Avoid trading 0-DTE (same day expiry) options unless you’re an experienced scalper. Review your trade post-market and journal the logic – it improves discipline and learning.
📌 Summary & Conclusion:
✅ Upside Levels:
→ 52,138 – Crucial resistance for intraday
→ 52,693 – Strong profit booking zone
✅ Downside Levels:
→ 51,509 – Opening Support
→ 51,218 – Last intraday support
→ 50,904 – Breakdown danger zone
🎯 Ideal Approach:
→ For gap-up: Wait for strength above 52,138 or reversal signs to short.
→ For flat: Follow breakout or breakdown setups near support/resistance.
→ For gap-down: Let price stabilize near supports; trade only on confirmation.
🚨 Avoid emotional trades. Let price action confirm direction. Be flexible and adaptive based on live market structure.
⚠️ Disclaimer: I am not a SEBI-registered analyst. All views shared above are for educational and informational purposes only. Please do your own research or consult your financial advisor before making any investment or trading decision.
NIFTY BANK Prediction for Tomorrow – March 25, 2025What happened on last day:
As we discussed, BANKNIFTY had been consolidating in a wide range, and it finally gave a breakout to the upside.
If we look at the chart now:
The market has broken out above the immediate resistance zone of 50,300–50,500 , and is now trading just above the 200 EMA (1D-tf) . The breakout candle was backed by strong volume , indicating institutional participation.
BANKNIFTY is forming a higher low structure , and has broken a significant resistance from its previous congestion zone.
The 13 EMA, 50 EMA, and 100 EMA are all aligned below the price, with 200 EMA recently reclaimed — supporting a bullish bias.
RSI = 65 , shows good momentum and strength, but bulls will need to defend these levels for continuation.
Price is also trading well above VWAP , reinforcing the short-term bullish sentiment.
Support zone: 49,800 – 50,200
Resistance levels: 51,680, 52,000 (trendline), 54,467 (swing high)
If we look at the OI data:
PCR = 1.3 , clearly shows a bullish sentiment in the derivatives segment.
There is heavy Put writing at 50,000, 50,200, and 50,500 which will now act as immediate support levels.
On the upper side, mild Call writing has been seen near 51,500–52,000, which aligns with the trendline resistance shown on the chart.
We are in the last week of the monthly expiry (27 March) , so these zones will play a decisive role.
If we look at the news & sentiment:
INDIA VIX = 12.6 remains stable.
No negative news on banking or macroeconomics.
FII inflow data shows recovery, and overall sentiment is bullish-to-cautious .
Eyes are on whether BANKNIFTY can close and hold above the 51,000–51,200 levels.
I am expecting
The market to be sideways to bullish with a possible breakout above 51,680 leading to a test of 52,000–52,300 , if sustained.
Reasons:
✅ Breakout above major supply zone with strong volume
✅ Price > EMA(13, 50, 100, 200) confirms bullish alignment
✅ PCR = 1.3 suggests strong bullish sentiment
✅ Above VWAP and RSI > 60 supports momentum
❗Approaching trendline resistance near 52,000
Verdict: Sideways or Bullish
Plan of action:
Sell 51,500 CE and 50,500 PE — create a slightly bullish range.
Exit one leg if price breaks 52,000 or falls below 50,300 with volume.

Bank Nifty Spot will it cross 52670Bank Nifty Spot has corrected almost 4500 points from recent ATH of 54460+ levels
From lower level retracements upto 52670 levels...
Now on every rise upto 52670 Levels will see selling pressure unless it closes above 52670 on D closing basis...
Have marked important levels for your perusal
Like... Share....
Happy Trading....

Sportking India Ltd (SPORTKING) Stock AnalysisGlobalTradeHub | Sportking India Ltd (SPORTKING) Stock Analysis
Fundamental Analysis:
Sportking India, a leading textile manufacturer, benefits from rising demand for yarn exports and domestic apparel consumption. Strong operational efficiency and expansion plans support growth. However, risks include raw material price volatility and global economic slowdowns impacting textile exports.
Technical Analysis:
The stock is testing resistance near ₹1,150. A breakout could push it toward ₹1,250. Strong support lies at ₹1,050, with further downside risk if breached. RSI around 60 indicates moderate bullish momentum.
Key Levels:
- Resistance: ₹1,150 / ₹1,250
- Support: ₹1,050 / ₹980
Conclusion:
Sportking India remains strong in the textile sector. A breakout above ₹1,150 could drive further gains, while dips to support zones may offer accumulation opportunities. 🏭📈

Ajmera Realty & Infra India Ltd (AJMERA) Stock AnalysisGlobalTradeHub | Ajmera Realty & Infra India Ltd (AJMERA) Stock Analysis
Fundamental Analysis:
Ajmera Realty, a key player in real estate and infrastructure, benefits from strong housing demand, urbanization, and government initiatives like affordable housing. The company has a solid project pipeline, but risks include interest rate hikes and sector cyclicality.
Technical Analysis:
The stock is facing resistance near ₹480. A breakout could push it toward ₹520. Strong support is at ₹440, and a breakdown may lead to ₹400. RSI around 60 suggests bullish momentum but nearing overbought levels.
Key Levels:
- Resistance: ₹480 / ₹520
- Support: ₹440 / ₹400
Conclusion:
Ajmera Realty remains strong in the growing real estate sector. A breakout above ₹480 could drive further gains, while dips to support zones may offer buying opportunities. 🏗️📈

Bharat Wire Ropes Ltd (BHARATWIRE) Stock AnalysisFundamental Analysis:
Bharat Wire Ropes, a key manufacturer of steel wire ropes, benefits from rising infrastructure, construction, and industrial demand. Strong order inflows and capacity expansion support growth. Risks include raw material price fluctuations and competition from global players.
Technical Analysis:
The stock is testing resistance near ₹220. A breakout could push it toward ₹240. Strong support is at ₹190, and a breakdown may lead to ₹175. RSI around 62 indicates bullish momentum but nearing overbought levels.
Key Levels:
- Resistance: ₹220 / ₹240
- Support: ₹190 / ₹175
Conclusion:
Bharat Wire Ropes is in a growth phase with strong sector demand. A breakout above ₹220 could fuel further upside, while dips to support levels offer accumulation opportunities. 📊🚀

Bank Nifty spot 48344.70 by the Daily Chart viewJust sharing an update in continuation over the last week Bank Nifty Index chart data reading.
Bank Nifty spot 48344.70 by the Daily Chart view
- Support Zone 47850 to 48075 Index Band is still sustained
- Bullish "W" Double Bottom has been formed at Support Zone Index Band.
- Do we expect another Rounding Bottom from the Support Zone or a Breakdown is on the cards ????

Market Recovery Strategies Amidst Downturns# Market Recovery Strategies Amidst Downturns
Market downturns create uncertainty, but strategic planning helps traders navigate volatility and recover losses effectively.
## 1️⃣ Identifying Market Bottoms
✅ Technical Signs: RSI below 30 (oversold), MACD bullish divergence, and volume spikes signal reversals.
✅ Fundamental Triggers: Earnings growth, government policies, and institutional buying indicate recovery.
## 2️⃣ Key Recovery Strategies
✅ Sector Rotation: Shift focus to recovering or defensive sectors (tech, banking, FMCG).
✅ Portfolio Rebalancing: Move capital to strong stocks and blue chips.
✅ Dollar-Cost Averaging: Invest gradually to reduce volatility risk.
✅ Derivative Hedging: Use Put Options & Covered Calls for risk protection.
✅ Market Sentiment Tracking: Watch Put-Call Ratio (PCR) & VIX for trend signals.
# 3️⃣ Trading Psychology for Recovery
✅ Avoid Panic Selling: Assess market recovery potential before exiting.
✅ Stick to a Strategy: Maintain risk management and long-term goals.
✅ Learn & Adapt: Every downturn is an opportunity to refine trading skills.
Conclusion: Market downturns are temporary—using smart strategies, risk control, and disciplined trading ensures long-term success! 🚀📈

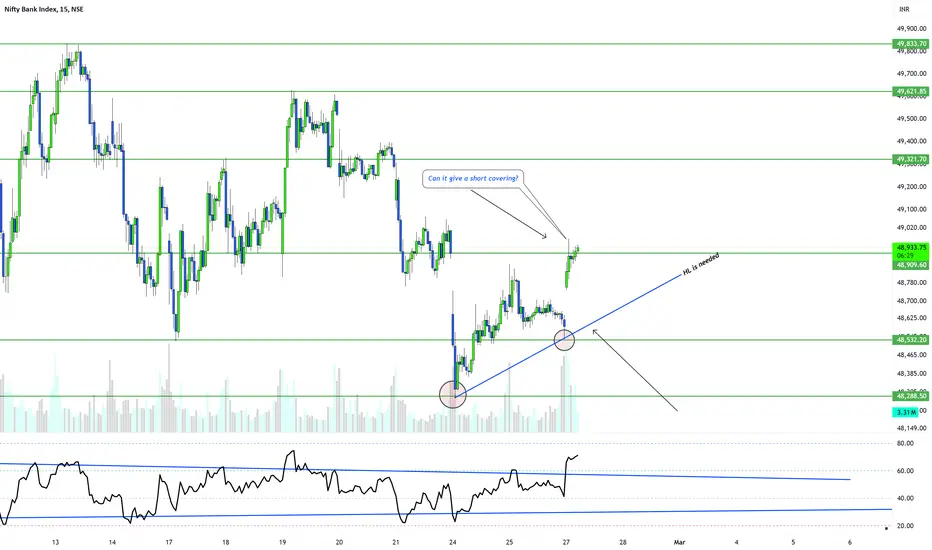
BANKNIFTY! Can it give a big move? Weekly zones!As per the trend BANKNIFTY is trying to sustain above 49000, which is a strong RESISTANCE.
If you want to follow up the trend UPSIDE then one should wait for HLs for a confirmation. Also, the trend changes if any of the big strikes gets eliminated. In this current scenario we are probably waiting for a confirmation.
I have marked the important Support & Resistances to help you in a better way.
INDIA VIX is down right now which is giving a good support to option buyers and Sellers.
As per the study let it close above today's high and give a HL confirmation for a trend change on a 15 mins time frame.
IMPORTANT ZONES TO WATCH : 49000-49100
NOTE: I'm not a SEBI reg. Study before investing.
candlestick patterns **SkyTradingZone** is your go-to source for educational content on trading, covering market insights, strategies, and in-depth analysis. Our goal is to empower traders and investors with knowledge to navigate the markets effectively.
---
# **Candlestick Patterns – Part 1: Basics and Key Reversal Patterns**
Candlestick patterns are one of the most powerful tools in **technical analysis**. They help traders understand market sentiment and predict future price movements based on past price action.
📌 **Why Use Candlestick Patterns?**
✅ They provide **visual insights** into price action.
✅ They help identify **market reversals, trend continuations, and breakouts**.
✅ They work well when combined with **support & resistance, volume, and indicators** like RSI or MACD.
---
## **1️⃣ Understanding Candlestick Structure**
A candlestick consists of **four key components**:
📌 **Open** – The price at which the candle starts.
📌 **Close** – The price at which the candle ends.
📌 **High** – The highest price reached during the timeframe.
📌 **Low** – The lowest price reached during the timeframe.
🔹 **Bullish Candle (Green/White):** When the **closing price** is higher than the **opening price**, showing buyers are in control.
🔹 **Bearish Candle (Red/Black):** When the **closing price** is lower than the **opening price**, showing sellers are in control.
---
## **2️⃣ Types of Candlestick Patterns**
Candlestick patterns can be broadly classified into **two types**:
✅ **Reversal Patterns** – Indicate a possible change in trend.
✅ **Continuation Patterns** – Indicate that the trend will likely continue.
---
## **3️⃣ Key Reversal Candlestick Patterns**
### 📍 **A) Bullish Reversal Patterns**
1️⃣ **Hammer**
🔹 A small body with a **long lower wick** (shadow).
🔹 Appears after a **downtrend**, signaling a potential reversal.
🔹 **Indicates buyers have entered the market aggressively.**
📌 **Confirmation:** The next candle should be bullish with high volume.
🔹 **Example:** If Nifty 50 forms a hammer at a key **support level**, it could signal a trend reversal.
---
2️⃣ **Bullish Engulfing**
🔹 A **large green candle** completely engulfs the previous **red candle**.
🔹 Shows **strong buying pressure**, often leading to an **uptrend**.
📌 **Confirmation:** Must occur at a **support level or after a downtrend**.
🔹 **Example:** If a stock forms a **bullish engulfing pattern near a 200-day moving average**, it’s a strong buy signal.
---
3️⃣ **Morning Star**
🔹 A **three-candle pattern** appearing after a **downtrend**:
✅ First Candle – Large **red candle** (sellers in control).
✅ Second Candle – Small **indecisive candle** (doji/spinning top).
✅ Third Candle – Large **green candle**, confirming reversal.
📌 **Confirmation:** The third candle should close above the first candle’s midpoint.
🔹 **Example:** A **Morning Star on Bank Nifty's daily chart** at a key support zone can indicate a bullish rally ahead.
---
### 📍 **B) Bearish Reversal Patterns**
1️⃣ **Shooting Star**
🔹 A small body with a **long upper wick**.
🔹 Appears after an **uptrend**, signaling a potential reversal.
🔹 Shows that **buyers tried to push prices higher but failed, and sellers took control**.
📌 **Confirmation:** The next candle should be bearish with strong volume.
🔹 **Example:** If **Reliance stock** forms a **shooting star** near resistance, it could indicate a **sell-off**.
---
2️⃣ **Bearish Engulfing**
🔹 A **large red candle** completely engulfs the previous **green candle**.
🔹 Indicates **strong selling pressure** and potential **trend reversal**.
📌 **Confirmation:** Must occur at a **resistance level or after an uptrend**.
🔹 **Example:** A **Bearish Engulfing pattern on the Nifty 50 weekly chart** near a **key resistance level** signals weakness in the index.
---
3️⃣ **Evening Star**
🔹 A **three-candle pattern** appearing after an **uptrend**:
✅ First Candle – Large **green candle** (buyers in control).
✅ Second Candle – Small **indecisive candle** (doji/spinning top).
✅ Third Candle – Large **red candle**, confirming reversal.
📌 **Confirmation:** The third candle should close below the first candle’s midpoint.
🔹 **Example:** An **Evening Star on HDFC Bank’s chart** near all-time highs may signal a bearish reversal.
---
## **4️⃣ How to Trade Candlestick Reversal Patterns?**
📌 **Step 1:** Identify the pattern at a **key support or resistance level**.
📌 **Step 2:** Wait for **confirmation** from the next candle.
📌 **Step 3:** Use **indicators like RSI, MACD, or Volume** for extra confirmation.
📌 **Step 4:** Enter a trade with a **stop-loss below/above the pattern’s wick**.
📌 **Example Trade Setup:**
✅ If a **Hammer pattern forms at a support level with increasing volume**, go **long**.
✅ Place **stop-loss** below the candle’s wick.
✅ Target **previous resistance levels** for profit-taking.
---
## **5️⃣ Common Mistakes to Avoid When Using Candlestick Patterns**
❌ **Trading Patterns in Isolation** – Always combine with support/resistance and indicators.
❌ **Ignoring Volume Confirmation** – A strong reversal needs high volume support.
❌ **Entering Without Confirmation** – Wait for a confirming candle before taking a trade.
❌ **Using Too Many Patterns** – Stick to **high-probability setups** like Engulfing, Hammer, and Shooting Star.
📌 **Pro Tip:** The best traders use **candlestick patterns along with market structure, trendlines, and momentum indicators** for higher accuracy.
---
## **Final Thoughts – Why Candlestick Patterns Are Important?**
🚀 **Candlestick patterns provide an edge in understanding market psychology and potential price movements.**
📌 **To Master Candlestick Trading:**
✅ Learn to identify **reliable reversal and continuation patterns**.
✅ Combine with **key support/resistance levels**.
✅ Backtest patterns to see which works best in different market conditions.
By mastering **Candlestick Analysis**, traders can significantly improve their decision-making and **increase profitability in the stock market!** 📈💰
---
📌 **Coming Up Next in Part 2:** **Continuation Candlestick Patterns (Doji, Spinning Tops, Three Soldiers, etc.) and How to Use Them in Trading.**
🔹 **Disclaimer**: This content is for educational purposes only. *SkyTradingZone* is not SEBI registered and does not provide financial or investment advice. Please conduct your own research before making any trading decisions.

SEBI’s Proposed Tightening of Derivatives Market RulesWhat is SEBI Trying to Do?
SEBI (Securities and Exchange Board of India) has proposed stricter regulations on the derivatives market, which includes stock and index futures & options. This move comes amid growing concerns about retail traders losing money due to high volatility and leverage in derivatives trading.
Key Changes Proposed by SEBI
1️⃣ Position Limits for Single Stock Derivatives
SEBI wants to cap the number of derivative contracts traders can hold for certain stocks.
The limit will be based on a stock’s market cap and daily traded volume.
This could reduce speculation and volatility in individual stocks.
2️⃣ Stricter Rules for Index Derivatives
Currently, traders can trade Nifty and Bank Nifty derivatives easily.
SEBI wants to introduce eligibility criteria so only fundamentally strong indices can have derivatives.
This may impact liquidity and the number of available trading instruments.
3️⃣ Pre-Open Trading Session for Futures
Just like in the cash market, SEBI wants a pre-open session for futures.
This could reduce gap-ups and gap-downs, making trading more stable.
Why is SEBI Doing This?
📉 Retail Traders Are Losing Money – Many new traders enter the market without experience, leading to heavy losses in options trading.
📊 Market Stability – Reducing excessive speculation will prevent stock price manipulation.
💰 Foreign Investment Confidence – Stricter rules can attract more institutional investors by making the Indian market more predictable.
How Will This Impact Traders?
✔️ Option Buyers and Sellers: Limited position sizes may reduce liquidity, affecting option pricing and spreads.
✔️ Intraday Traders: Changes in derivatives rules might lead to lower volatility, affecting momentum-based strategies.
✔️ Institutional Investors: Stricter rules could make Indian markets more attractive to foreign investors.
Trading Strategies Post-SEBI Changes
Focus on Cash Market Stocks: If derivative trading becomes restrictive, more money might flow into quality stocks.
Adapt to New Position Limits: Traders should carefully manage risk if new limits are imposed.
Use Hedging Strategies: If index derivatives face restrictions, hedging with ETFs and sectoral indices might become more important.

what is fundamental analysis ?1. Introduction
Fundamental analysis determines the intrinsic value of an asset by analyzing economic, financial,
and qualitative factors.
It is crucial for long-term investment decisions and involves evaluating financial statements, industry
trends, and macroeconomic factors.
2. Key Components of Fundamental Analysis
A. Quantitative Analysis:
- Balance Sheet (Assets, Liabilities, Shareholder's Equity)
- Income Statement (Revenue, Profit, Expenses)
- Cash Flow Statement (Operational Cash Flow)
- Financial Ratios (EPS, P/E Ratio, ROE, Debt-to-Equity)
B. Qualitative Analysis:
- Business Model & Competitive Advantage
- Management Quality & Leadership
- Market Share & Industry Trends
- Economic Indicators (GDP, Inflation, Interest Rates)
3. Fundamental Analysis vs. Technical Analysis
- Fundamental Analysis: Focuses on company financials, economy, and intrinsic value (Best for
long-term investments).
- Technical Analysis: Focuses on price trends, charts, and indicators (Best for short-term trading).
4. How to Conduct Fundamental Analysis?
- Analyze Economic & Industry Trends
- Evaluate Company?s Financials & Growth Potential
- Compare Financial Ratios with Competitors
- Determine Intrinsic Value Using Valuation Models
5. Advantages & Limitations
? Advantages:
- Identifies long-term investment opportunities.
- Provides deep insights into a company's value.
- Reduces emotional trading decisions.
? Limitations:
- Time-consuming process.
- Not suitable for short-term trading.
- Market sentiment can temporarily override fundamentals.
6. Conclusion
Fundamental analysis is a powerful tool for investors to make informed decisions.
Combining it with technical analysis can improve accuracy and risk management.
Disclaimer:
This content is for educational purposes only and does not constitute financial advice.
GlobalTradeView is not SEBI registered.

What is stock market and technical analysis ?**SkyTradingZone** is your go-to source for educational content on trading, covering market insights, strategies, and in-depth analysis. Our goal is to empower traders with knowledge to navigate the markets effectively.
---
# **Stock Market and Technical Analysis – Class 1: Introduction to the Stock Market**
### **1️⃣ What is the Stock Market?**
The **stock market** is a marketplace where buyers and sellers trade shares of publicly listed companies. It serves as a platform for companies to raise capital and for investors to buy ownership in businesses.
🔹 **Key Stock Exchanges:**
- **NSE (National Stock Exchange) & BSE (Bombay Stock Exchange)** – India
- **NYSE (New York Stock Exchange) & NASDAQ** – USA
- **LSE (London Stock Exchange)** – UK
🔹 **Types of Stock Market Participants:**
✅ **Retail Traders** – Individual traders & investors
✅ **Institutional Investors** – Hedge funds, mutual funds, pension funds
✅ **Market Makers** – Provide liquidity by continuously buying and selling
---
### **2️⃣ How Does the Stock Market Work?**
📌 **Primary Market:** Companies issue shares via **Initial Public Offerings (IPO)**.
📌 **Secondary Market:** Investors trade shares after listing on exchanges.
📌 **Market Hours:** Stock markets operate during fixed trading hours on weekdays.
📌 **Market Orders & Limit Orders:** Orders are placed through brokers to buy or sell stocks.
---
## **Technical Analysis: The Foundation of Trading**
### **3️⃣ What is Technical Analysis?**
Technical analysis is the study of **price action, charts, and indicators** to predict future price movements. Unlike fundamental analysis, which evaluates a company’s financials, technical analysis focuses on historical price patterns and trading volume.
### 🔹 **4. Key Principles of Technical Analysis**
📊 **1. Price Discounts Everything** – All known information is reflected in price.
📉 **2. History Repeats Itself** – Market patterns are based on human psychology.
📈 **3. Trends Exist** – Prices move in trends (uptrend, downtrend, sideways).
### 🔹 **5. Basic Tools in Technical Analysis**
📌 **Candlestick Charts** – Show price action using open, high, low, and close (OHLC).
📌 **Support & Resistance Levels** – Identify key price levels where buying or selling interest is strong.
📌 **Trend Lines** – Help traders identify the direction of the market.
📌 **Moving Averages (MA)** – Smooth price action to identify trends.
---
### **6️⃣ Why Learn Technical Analysis?**
✅ Helps traders identify **buy/sell opportunities**
✅ Works in **all financial markets** (stocks, forex, crypto)
✅ Provides **risk management strategies** to minimize losses
✅ Used by **institutions and retail traders** worldwide
---
### **What’s Next in Class 2?**
In the next class, we will cover:
✅ **Understanding Candlestick Patterns**
✅ **How to Identify Market Trends?**
✅ **Using Indicators for Better Trade Decisions**
Stay tuned for more insights!
---
🔹 **Disclaimer**: This content is for educational purposes only. *SkyTradingZone* is not SEBI registered, and we do not provide financial or investment advice. Please conduct your own research before making any trading decisions.

Support and resistance part 2**SkyTradingZone: Your Ultimate Guide to Trading Education**
# Support and Resistance - Part 2
## Advanced Techniques for Identifying Support and Resistance
In addition to basic methods, traders can use advanced techniques to identify stronger and more reliable support and resistance levels.
### 1. **Fibonacci Retracement Levels**
Fibonacci levels help traders identify potential support and resistance zones based on key retracement percentages (23.6%, 38.2%, 50%, 61.8%, and 78.6%). These levels are widely used in technical analysis to predict price reversals.
### 2. **Pivot Points**
Pivot points are used by day traders to determine intraday support and resistance levels. These are calculated based on previous high, low, and closing prices.
### 3. **Bollinger Bands**
Bollinger Bands indicate price volatility and can help identify dynamic support and resistance levels. The upper and lower bands act as resistance and support respectively during price swings.
### 4. **Multiple Time Frame Analysis**
Using support and resistance levels from different time frames helps traders understand stronger zones. Higher time frames provide more reliable support and resistance compared to lower time frames.
### 5. **Order Flow and Market Depth Analysis**
Analyzing real-time market orders and depth can help traders understand strong supply and demand zones, which act as potential support and resistance levels.
## How to Trade Using Support and Resistance?
1. **Breakout Trading:** If the price breaks through a resistance level with strong volume, it can signal a potential uptrend. Similarly, breaking below support can indicate a downtrend.
2. **Bounce Trading:** Buying near support and selling near resistance is a common strategy.
3. **Retest Confirmation:** After a breakout, the price often retests the broken support/resistance before continuing its trend.
## Conclusion
By mastering both basic and advanced support and resistance techniques, traders can enhance their trading accuracy and improve risk management. Combining these techniques with other indicators increases the probability of successful trades.
---
*Disclaimer: SkyTradingZone provides educational content only and does not offer financial or investment advice. We are not SEBI registered.*
