Nifty Intraday Trading Levels for 07th Feb 2025Nifty Intraday Trading Levels
Buy Setup
📌 Buy Above: The high of the first 15-minute candle that closes above 23,774
🎯 Targets: 23,822, 23,901, 23,935, 23,963, 23,992
🛑 Stop Loss: Below the low of the breakout candle
Sell Setup
📌 Sell Below: The low of the first 15-minute candle that closes below 23,544
🎯 Targets: 23,484, 23,434, 23,385, 23,307, 23,275
🛑 Stop Loss: Above the high of the breakdown candle
⚠️ Disclaimer
I am Not SEBI Registered. This analysis is for educational purposes only and does not constitute financial advice. Trading involves risk, and past performance does not guarantee future results. Always do your own research or consult a financial advisor before trading. 🚀
Bankniftytradesetup

#TATA Consumer ltdTata Consumer
Structure break+ trend continuation are the sign of bullish reversal.
Perfect chart
1107/1234
Im waiting for entry point
as of February 6, 2025, Tata Consumer Products Limited (TATACONSUM) is trading at ₹1,069.85.
echnical indicators suggest a bullish trend for the stock.nalysts have set a median target price of ₹1,190.32 over the next 12 months, indicating potential upside.citeturn0search3
he company has demonstrated consistent financial performance, with a consolidated total income of ₹4,495.16 crore for the quarter ending December 31, 2024, reflecting a 5.51% increase from the previous quarter and a 16.35% rise compared to the same quarter the previous year.
given these factors, the stock's outlook appears positive.
*Please note that this information is for educational purposes only and should not be considered financial advice. Always consult with a qualified financial advisor before making investment decisions.*

NIFTYBANK FRIDAY TRADE PLAN Friday trade plan based on hourly chart.
Banknifty in Impulse diagonal abcde, with e in progress.
Making Higher High
Higher Low
Bullish Structure
Gap up Sustained
RBI Meet repo rate announcement 7 Feb 10 am. Can be volatile keep, trade cautiously.
Disclaimer: I am not SEBI registered analyst. These are not buy/sell recommendations. Trading/investing can be very risky, reach out to a authorised consultant before making any decisions. I do not claim/promise any profits.

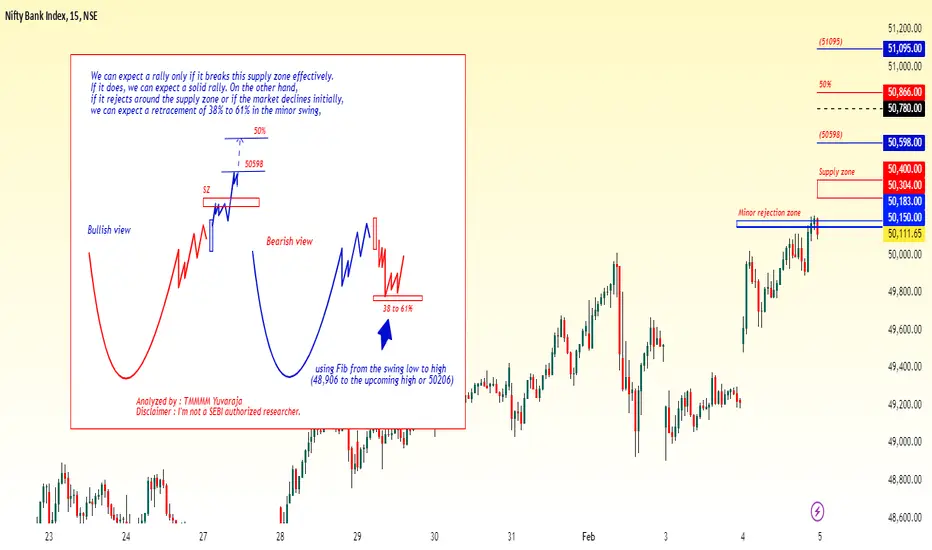
#Banknifty directions and levels for February 5th:In the previous session, Bank Nifty had a solid rally, suggesting further continuation. However, We can expect a rally only if it effectively breaks through this supply zone. If it does, we can anticipate a solid rally. However, if it rejects around the supply zone or if the market declines initially, we can expect a minimum retracement of 38% to 61% in the minor swing, using the Fibonacci levels from the swing low to the upcoming high (from 48,906 to the anticipated high)
Video For New TradersTrading psychology is the emotional component of an investor's decision-making process, which may help explain why some decisions appear more rational than others. Trading psychology is characterized primarily by the influence of both greed and fear. Greed drives decisions that might be too risky.
The London session accounts for about 34% of the daily forex trading volume, making it the most active session. London is one of the world's financial hubs, with the largest financial institutions and banks engaging in huge trading activities in the city. These naturally impact the movements of world currencies.

NIFTY Trading Strategy For 3rd February 2025NIFTY Trading Strategy:
Buy Strategy:
Entry Point: Buy above the high of the 15-minute candle that closes above 23635
Targets:
First Target: 23690
Second Target: 23740
Third Target: 23799
Stop-Loss: The stop-loss will be set at the low of the candle that breaks out above 23635.
Sell Strategy:
Entry Point: Sell below the low of the 15-minute candle that closes below 23305
Targets:
First Target: 23260
Second Target: 23205
Third Target: 23169
Stop-Loss: The stop-loss will be set at the high of the candle that breaks down below 23305.
Time Frame:
15-Minute Time Frame: This strategy is based on the 15-minute time frame, allowing for shorter-term trading opportunities and quicker responses to market movements.
Important Points:
Stop-Loss Orders: Always use stop-loss orders to manage risk and protect your capital.
Monitor Market Conditions: Continuously monitor market conditions and news that could impact the NIFTY index.
Technical Indicators: Consider using technical indicators and chart patterns to confirm entry and exit points.
Disclaimer: I am not SEBI registered. Please conduct your own research and consult a professional financial advisor before making any investment decisions. Trading and investing involve significant risk of loss and are not suitable for every investor.

Support and ResistanceTOP-10 Support and Resistance Indicators
Fibonacci Levels.
Support and Resistance Zones Indicator.
Linear Regression.
Margin Zones Indicator.
Trend Lines.
Fair Value Gaps.
Stacked Imbalance Indicator.
Psychological Levels.
The basic strategy is to buy at the support level and sell at the resistance level, recognizing that these are zones of potential demand and supply changes. How does resistance work?

Database TradingIt comes with limited downside risk, making it a safer investment than futures or margin trading. In addition, option trading can be more complex than other financial instruments, as it requires traders to have a good understanding of the underlying asset and market conditions.
Yes, you can make a lot of money, or lose a lot of money, trading options. Options provide a leveraged payoff on some underlying asset, such a stock. Below are the basics and some points to be aware of. The prices of options are based on the movement of some underlying asset, often stocks.

Management and PsychologyTrading Psychology simply refers to the feelings and emotions of a trader experiences and the associated actions the trader takes as a result. Just like in any other aspect of life, understanding how our mind works can improve our ability to trade better, take more informed, rational decisions and calculated risk.
How do I master my trading psychology?
What is Trading Psychology? ...
1) Create a Trading Plan. ...
2) Take Regular Breaks. ...
3) Don't Quit Your Day Job. ...
4) Accept That You Will Lose. ...
5) Practice, Practice, Practice. ...
6) Use a Take Profit and a Stop Loss. ...
7) Backtest Your Trading Strategy.
More items...

PCR TradingThe Put-Call Ratio (PCR) is a popular technical indicator used by investors to assess market sentiment. It is calculated by dividing the volume or open interest of put options by call options over a specific time period. A higher PCR suggests bearish sentiment, while a lower PCR indicates bullish sentiment.
However, no PCR can be considered ideal, but usually, a PCR below 0.7 is typically viewed as a strong bullish sentiment while a PCR more than 1 is usually considered as a strong bearish sentiment.

option TradingOption trading is largely a skill requiring knowledge of market trends, strategies, and risk management techniques. While there is an element of uncertainty in the markets, successful traders rely on analysis, planning, and discipline rather than luck.
If a person trades for excitement or social proofing reasons, rather than in a methodical way, they are likely trading in a gambling style. If a person trades only to win, they are likely gambling. Traders with a "must-win" attitude will often fail to recognize a losing trade and exit their positions.

Database TradingYou can get started trading options by opening an account, choosing to buy or sell puts or calls, and choosing an appropriate strike price and timeframe. Generally speaking, call buyers and put sellers profit when the underlying stock rises in value. Put buyers and call sellers profit when it falls.
Charles Dow occupies a huge place in the history of finance. He founded The Wall Street Journal – the benchmark by which all financial papers are measured – and, more importantly for our purpose, he created the Dow Jones Industrial Index. In doing so, Dow opened the door to technical analysis.

RSI Divergence Low RSI levels, typically below 30 (red line), indicate oversold conditions—generating a potential buy signal. Conversely, high RSI levels, typically above 70 (green line), indicate overbought conditions—generating a potential sell signal.
Successful trades often occur when the RSI crosses above 30 (indicating a buy signal) or below 70 (indicating a sell signal). Adjusting the RSI period to 9 can make it more sensitive to price changes and be suitable for more active trading strategies.

Technical AnalysisTechnical analysis is a means of examining and predicting price movements in the financial markets, by using historical price charts and market statistics. It is based on the idea that if a trader can identify previous market patterns, they can form a fairly accurate prediction of future price trajectories.
Technical analysis is a strategy for predicting movement in the stock market, or other securities markets, that relies on information from short periods of time. For this reason, day traders or other short-term traders often use technical analysis.

Trading RoadmapOptions are highly sensitive to market volatility. Significant price swings can lead to substantial gains or losses. A trader might buy a put option expecting a stock to drop. If the stock instead surges in price due to unforeseen events, the value of the put option plummets.
Market Volatility: The futures and options markets are known for their high volatility, meaning prices can change rapidly and unpredictably. If you happen to be on the wrong side of one of these price swings, you can lose a tremendous amount of money in a very short amount of time.

MACD Divergence TradingMoving average convergence/divergence (MACD) is a technical indicator to help investors identify entry points for buying or selling. The MACD line is calculated by subtracting the 26-period exponential moving average (EMA) from the 12-period EMA. The signal line is a nine-period EMA of the MACD line.
The indicator is calculated by subtracting a 26-period Exponential Moving Average from the 12-period moving average. There is also a histogram available on the indicator which can also be used as a divergence indicator. As a result, you will then see the MACD line, which shows as an indicator below the price chart.

Advanced Swing TradingThe Put-Call Ratio (PCR) is a popular technical indicator used by investors to assess market sentiment. It is calculated by dividing the volume or open interest of put options by call options over a specific time period. A higher PCR suggests bearish sentiment, while a lower PCR indicates bullish sentiment.
However, no PCR can be considered ideal, but usually, a PCR below 0.7 is typically viewed as a strong bullish sentiment while a PCR more than 1 is usually considered as a strong bearish sentiment.

BANKNIFTY MATHEMATICAL LEVELSThese Levels are based on purely mathematical calculations.
How to use these levels :-
* Mark these levels on your chart.
* Safe players Can use 15 min Time Frame
* Risky Traders Can use 5 min. Time Frame
* When Candle give Breakout / Breakdown to any level we have to enter with High/Low of that breaking candle.
* Targets will be another level marked on chart
* Stop Loss will be Low/High of that Breaking Candle.
* Trail your SL with every candle.
* Avoid Big Candles as SL will be high then.
* This is one of the Best Risk Reward Setup.
For Educational purpose only

Database Option Trading Options are highly sensitive to market volatility. Significant price swings can lead to substantial gains or losses. A trader might buy a put option expecting a stock to drop. If the stock instead surges in price due to unforeseen events, the value of the put option plummets.
Call options give buyers the right, but not the obligation, to buy a stock for a fixed price, on or before some date. Buying call options on a stock can be more profitable — but also more risky in percentage-change terms — than buying that stock itself.

Technical Analysis Technical analysis is a means of examining and predicting price movements in the financial markets, by using historical price charts and market statistics. It is based on the idea that if a trader can identify previous market patterns, they can form a fairly accurate prediction of future price trajectories.
What exactly are the two types of technical analysis? Chart patterns and technical (statistical) indicators are the two main types of technical analysis. Chart patterns are a subjective type of technical analysis in which technicians use certain patterns to indicate regions of support and resistance on a chart.

Option TradingOptions are a type of contract that gives the buyer the right to buy or sell a security at a specified price at some point in the future. An option holder is essentially paying a premium for the right to buy or sell the security within a certain time frame.
When options are better. Options can be a better choice when you want to limit risk to a certain amount. Options can allow you to earn a stock-like return while investing less money, so they can be a way to limit your risk within certain bounds. Options can be a useful strategy when you're an advanced investor.

Option Trading with Option chainOption chains provide specific data related to options contracts, including strike prices, expiration dates, implied volatility, and open interest. Traders use this data to construct options strategies, manage risk, and profit from price movements in the underlying asset.
Top options trading strategies
Covered call. A covered call is a popular options strategy where you own a stock and simultaneously sell a call option on the same stock. ...
Married put. ...
Bull call spread. ...
Bear put spread. ...
Protective collar. ...
Long straddle. ...
Long strangle. ...
Long call butterfly spread.

Data TradingMarket data is a broad category of information about the financial markets, consisting of essential details like price, bid/ask quotes, trading volume, trading period (high, low, open, or closed), etc.
Options trading is a type of financial trading that allows investors to buy or sell the right to purchase or sell an underlying asset at a fixed price, at a future date. Options trading operates on the basis that the buyer has the option to exercise the contract but is not under any obligation to do so.
