Important Video for Trader'sTake regular breaks when you are reading or studying. Reading for short periods of time of about 20-30 minutes should be enough to really focus on the text and take in as much as possible. 7. Read in a positive environment that is comfortable and free of distractions as this will help improve your concentration.
The 60-60-50 RSI strategy is a trading strategy that generates buy/sell signals by analysing the RSI across multiple timeframes. This course will teach you the logic of the 60-60-50 strategy and how to apply it.
Bankniftytradesetup

Divergence Trading An RSI divergence occurs when the indicator and price begin to reach different levels, indicating a change in momentum that precedes a change in price direction. For example, a bullish divergence occurs when the security makes a lower low but the indicator forms a higher low.
What is the best RSI setting for divergence? The default RSI setting is a 14-period, which works well for most traders. However, shorter settings (like 7) increase signal sensitivity, while longer settings (like 21) reduce noise and offer more reliable signals, especially for long-term trading.

PCR TradingThe Put-Call Ratio (PCR) is a popular technical indicator used by investors to assess market sentiment. It is calculated by dividing the volume or open interest of put options by call options over a specific time period. A higher PCR suggests bearish sentiment, while a lower PCR indicates bullish sentiment.
Let's delve into the concept of put/call ratio, which is derived by dividing the put trading volume by the call trading volume. A put/call ratio of 0.74 indicates that for every 100 calls purchased, 74 puts were also acquired.

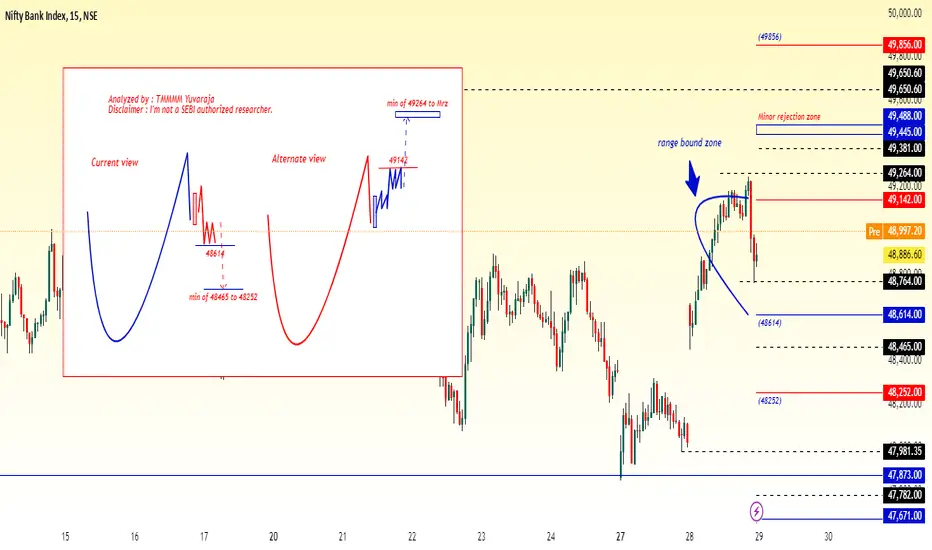
#Banknifty directions and levels for January 30th:Bank Nifty Current View
The current view for Bank Nifty is similar to that of Nifty. If the market pulls back, it could reach a minimum of 49,381 to 49,400, which is a rejection zone. If it consolidates or breaks this level, we can expect further continuation. On the other hand, if it gets rejected sharply there, we can expect a correction of at least 50% to 78% in the current swing.
>For reversal confirmation, we can use the EMA20 on the 15-minute chart. In a directional market, this indicator works well, but if the market starts to grind, it may show some false signals.
Alternate View
The alternate view suggests that if the market starts to decline, it could reach a minimum of 48,850 when it breaks the 38% mark. If this happens, the demand zone will act as strong support, and structurally, we can expect a pullback here. However, we should note that if the market reaches this level in a straight line or consolidates without any pullback, the probability of further downside increases.

Bank nifty showing sign of bounce.Bank nifty is showing divergence on chart. Divergence repeats as like 6Aug 2024 to14 Aug 2014 as per chart. MACD also showing cross over. Bank nifty bounce is expected from here.

#Banknifty directions and levels for January 29th:Bank Nifty Current View:
The current structure in Bank Nifty is similar to Nifty. If the market declines initially, we can expect a correction towards 48614, which is a major support zone. If the market finds support here, it may bounce back to its opening level with a bullish bias.
> On the other hand, if the market breaks this zone or consolidates around it, the correction will likely continue towards 48465–48252.
Alternate View:
If the gap-up sustains, 49142 will act as strong resistance. If the market gets rejected at this level, we can expect a range-bound session. However, if it consolidates or breaks above this level, the rally will likely continue towards 49264, a minor rejection zone.
Nifty Trading Strategy for 29th january 2025Nifty Trading Strategy
Buy Strategy:
Buy Above: The high of the 15-minute candle that closed above 23,050
Targets: 23,090, 23,140, 23,190
Stop-Loss: Below the low of the 15-minute candle that closed above 23,050
Sell Strategy:
Sell Below: The low of the 15-minute candle that closed below 22,850
Targets: 22,803, 22,765, 22,725
Stop-Loss: Above the high of the 15-minute candle that closed below 22,850
Disclaimer:
I am not SEBI registered. This analysis is based on historical data and market trends. Past performance is not indicative of future results. Trading and investment involve risks, and you should conduct your own research or consult with a financial advisor before making any decisions.

RSIThe Relative Strength Index (RSI) is a widely used momentum oscillator in technical analysis that helps traders identify overbought or oversold conditions in a market. Here’s a brief overview:
Interpretation:
Overbought: An RSI above 70 suggests that the asset might be overbought and could be due for a pullback.
Oversold: An RSI below 30 indicates that the asset might be oversold and could be due for a bounce.

Basic to Advanced Trading Road MapRoadmap to being a successful trader
Step 1: Decide on your trading pattern. ...
Step 2: Select the most appropriate stock trading broker for You. ...
Step 3: Choose the best stocks for your investment. ...
Step 4: Determine your risk tolerance. ...
Step 5: Learn to be patient.
It is a high-stakes game where many are lured by the promise of quick riches but ultimately face harsh realities. One of the harsh realities of trading is the “Rule of 90,” which suggests that 90% of new traders lose 90% of their starting capital within 90 days of their first trade.

Advanced Option TradingWhen options are better. Options can be a better choice when you want to limit risk to a certain amount. Options can allow you to earn a stock-like return while investing less money, so they can be a way to limit your risk within certain bounds. Options can be a useful strategy when you're an advanced investor.
Yes, profits from intraday trading are considered business income and taxed according to your income tax slab. How is intraday trading taxed? Intraday trading profits are treated as short-term capital gains, added to taxable income, and taxed based on applicable slab rates.

Lecture For Option Trader or Intraday TraderIntraday trading, also known as day trading, means buying and selling stocks on the same day to profit from price changes. Traders need to close their trades before the market closes. If not, the broker might automatically close them or turn them into regular trades.
Yes, profits from intraday trading are considered business income and taxed according to your income tax slab. How is intraday trading taxed? Intraday trading profits are treated as short-term capital gains, added to taxable income, and taxed based on applicable slab rates.

INDHOTEL
The Indian Hotels Co. Ltd view for Intraday 27th Jan #INDHOTEL
Resistance 790 Watching above 792 for upside movement..
. Support area 770 Below 780 ignoring upside momentum for intraday
Watching below 768 or downside movement...
Above 780 ignoring downside move for intraday
Charts for Educational purposes only.
Please follow strict stop loss and risk reward if you follow the level.

BANKNIFTY MATHEMATICAL LEVELS These Levels are based on purely mathematical calculations.
How to use these levels :-
* Mark these levels on your chart.
* Safe players Can use 15 min Time Frame
* Risky Traders Can use 5 min. Time Frame
* When Candle give Breakout / Breakdown to any level we have to enter with High/Low of that breaking candle.
* Targets will be another level marked on chart
* Stop Loss will be Low/High of that Breaking Candle.
* Trail your SL with every candle.
* Avoid Big Candles as SL will be high then.
* This is one of the Best Risk Reward Setup.
For Educational purpose only

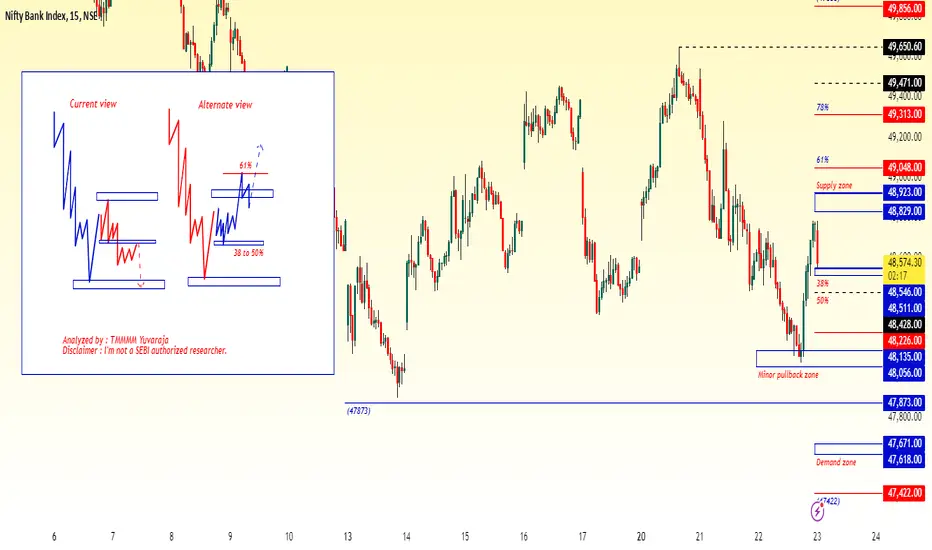
#Banknifty directions and levels for January 23rd:Bank Nifty Current View:
The Bank Nifty current view has two variations:
> First Variation: If the gap-down sustains, it will likely consolidate within the previous day's range. In this sentiment, a correction will only be expected if it breaks the previous bottom, meaning that until the previous bottom is broken, the market bias could remain moderately bullish.
> Second Variation: This is conditional; the initial market should take a solid pullback and could reject around the immediate resistance zone. If this occurs, the market will turn into a correction phase, supported by structural reasons.
Alternate View:
The alternate view is similar to that of Nifty. If the gap-down does not sustain or if the market finds support around the 38%, we can expect some consolidation between the 38% and the upside 61% mark. In this case, the supply zone may not be as effective.
Bank Nifty Levels for Today 22nd-Jan-2025: Key Zones to WatchGood morning guy's i hope you all will be doing good. Let's start analysis of Banknifty:
Bank Nifty is currently trading around 48,626, offering a well-defined trading setup for both buyers and sellers. A breakout above 48,752 could indicate bullish momentum, with potential targets at 48,973, 49,195, and 49,608, while keeping a stop loss at 48,453. On the other hand, if the price breaks below 48,453, it may lead to a bearish move, targeting 48,252 and 47,972, with a stop loss at 48,752. The important support zone between 47,972 and 48,090 remains a key area to watch for price reversals or further breakdowns.
Looking at the indicators, the RSI suggests bearish divergence but hints at a possible recovery from oversold conditions, while the MACD continues to reflect bearish momentum. Traders should focus on price action around these levels to identify potential opportunities.
Disclaimer: This analysis is purely for educational purposes and does not constitute financial advice. Always do your own research or consult a professional advisor before trading.
If you found this analysis helpful, make sure to follow for regular market insights and share your thoughts in the comments below. Let’s grow together as traders!

#Banknifty directions and levels for January 22nd, WednesdayBank Nifty Current View:
The current view for Bank Nifty aligns with Nifty. If the gap-up doesn't sustain or the market breaks the previous low with consolidation, we can expect the correction to continue toward the levels of 48309 to MPZ.
Alternate View:
If the gap-up sustains, we can approach Bank Nifty as a range-bound market as well. Traders can look for breakout entries. For instance, if the market breaks 48848, we can anticipate a move toward 49031.

Bank Nifty: Dynamic Trendline Resistance and Support BreakdownChart Description:
Dynamic Resistance: Highlight the descending trendline acting as a strong resistance. Mark recent rejection points from this line.
Dynamic Support: Add the upward-sloping support line showing recent price bounces.
Key Levels:
47600: Potential target if support breaks, indicating a bearish continuation.
47600: Swing low zone, which could act as a short-term target in the bear trend.
Bearish Breakdown: Indicate potential price action if the dynamic support is breached, targeting levels below 47500.
Risk Management: Add possible stop-loss placement near the trendline resistance for short positions.
Idea Summary:
Watch for price rejection at the dynamic trendline resistance.
A breakdown of the dynamic support line will signal a bearish move.
Target levels: 47600 (swing low) and below 47500 in case of extended bearish momentum.
Disclaimer :
This analysis is for educational and informational purposes only. It is not financial advice or a recommendation to trade. Trading in financial markets involves significant risk, and you should only trade with capital you can afford to lose. Perform your due diligence or consult a financial advisor before making any trading decisions.

#Banknifty directions and levels for January 21st, Tuesday:Current View:
The current view, based on Elliott Wave analysis, suggests that if the gap-up doesn't sustain or if the market faces rejection around the immediate resistance, we can expect a minimum correction of 23% to 38% in the minor swing. This is a major support level, so until the 38% mark is broken, the trend remains bullish. Conversely, if it breaks the 38%, we can consider that a trend reversal.
Alternate View:
The alternate view suggests that if the gap-up sustains and consolidates or breaks the immediate resistance level, then the rally will likely continue. In this case, we can consider that a flag pattern or the third wave of the new impulse.

Nifty Trading Strategy 16th January 2025Nifty Trading Strategy
Buy Strategy:
Entry Point:
Condition: Wait for the 15-minute candle to close above 23,300.
Trigger: Buy when the price moves above the high of the candle that closed above 23,300.
Targets:
First Target: 23,360
Second Target: 23,410
Third Target: 23,445
Stop-Loss:
Set a stop-loss order below the low of the 15-minute candle that closed above 23,300 to limit potential losses.
Trailing Stop-Loss:
Use a trailing stop-loss to lock in profits as the price moves towards the targets. For example, set a trailing stop of 10 points below the current price.
Profit Booking:
As the price reaches each target, consider booking partial profits to secure gains. For instance, sell a portion of the position at 23,360, another portion at 23,410, and the remaining position at 23,445.
Sell Strategy:
Entry Point:
Condition: Wait for the 15-minute candle to close below 23,130.
Trigger: Sell when the price moves below the low of the candle that closed below 23,130.
Targets:
First Target: 23,070
Second Target: 23,010
Third Target: 22,975
Stop-Loss:
Set a stop-loss order above the high of the 15-minute candle that closed below 23,130 to limit potential losses.
Trailing Stop-Loss:
Use a trailing stop-loss to lock in profits as the price moves towards the targets. For example, set a trailing stop of 10 points above the current price.
Profit Booking:
As the price reaches each target, consider booking partial profits to secure gains. For instance, sell a portion of the position at 23,070, another portion at 23,010, and the remaining position at 22,975.
Risk Management:
Position Sizing:
Use proper position sizing to ensure you do not risk more than 1-2% of your trading capital on a single trade. This helps to manage risk and protect your capital.
Diversification:
Avoid putting all your capital into a single trade or asset. Diversify your trades across different assets to minimize risk.
Discipline:
Stick to the trading plan and do not deviate from the strategy. Avoid making impulsive decisions based on emotions.
Disclaimer:
I am not SEBI registered. This strategy is based on historical data and technical analysis. Past performance is not indicative of future results. Trading involves risk, and you should only invest money that you can afford to lose. Always conduct your own research or consult with a financial advisor before making any trading decisions.

Nifty weekly expiry analysis for 16/01/2025For last 2 trading session nifty is consolidating in a box, while banknifty is moving 400-500 points in intraday and tomorrow is it's weekly expiry.
If the market starts trading outside the box, there is high probability of forming a trending day for the index.
Market had respected the round number support of 23k. It can either retest the support or even breach the recent low to test the support trendline.
Major levels (for intraday)
Support :- 23135, 23000
Resistance :- 23285, 23380
Wait and watch the price action for confirming the direction and intensity of the move.

#Banknifty directions and levels for January 14th, Tuesday:Current View:
The current view, based on the structure, is that as per the long correction, this kind of gap-up might not sustain.
> If the initial market declines, it could consolidate between the previous low and today’s opening price, or to the 38% resistance level.
> After that, if it breaks the previous low, then the correction will likely continue.
Alternate View:
The alternate view says:
> If the gap-up sustains or if it breaks the major resistance at 38% with a solid candle, then it could reach a minimum of 50% to 61% in the minor swing.

HUGE SELLING ON CARDS IN BANK NIFTY ? - SHORT TRADE VIEWSymbol - BANKNIFTY
CMP 50080
BN is currently trading at a major support area which is acting as a support zone from last 7 months. This support liquidity zone has tested multiple times & there is Triple top pattern is formed. I am expecting breakdown of this support zone in near future which will trigger huge selling in bank nifty & bank nifty may correct 8-10% from current price.
Hence I am creating short positions Bank Nifty Futures at CMP around 50100
I will add more position around 50500 - 50700 area & I will add more position on breakdown of 49500 - 49400 area as well. SL I am following is above 51K.
Target I am expecting is 49600 & below.
Disclaimer - Do not consider this as a buy/sell recommendation. I'm sharing my analysis & my trading position. You can track it for educational purposes. Thanks!

Banknifty Bullish Harmonic Pattern Moving AVG Support__RSIHello everyone,
banknifty fall consecutive 6 days trading at 8 months low 48700 RSI Positive divergence,
Bullish harmonic pattern and flag in making while nifty W in making So reversal possibilities also Maving avg band support overal confluence support with ocsillators bullish.
bullish reversal banknifty,
Banknifty Bullush Harmonic,
banknifty bullush flag,
Banknnifty RSI oversold and positive divergence,
