BCHUSD - The Squeeze is Tightening. Decision Imminent?BCH is providing a textbook example of Price Compression on the 4H timeframe.
When price gets squeezed between a rising trendline and horizontal levels, volatility usually follows. Currently, BCH is testing the validity of the trendline support.
Key Levels to Watch:
Support Defense: The bulls need to hold the $558 level to maintain the uptrend structure.
Invalidation: A breakdown of this trendline changes the market character from accumulation to potential distribution .
Trading Plan: Watch for volume on the reaction. A low-volume bounce might be a trap, while a high-volume rejection of the trendline confirms weakness.
Trade safe and manage your risk!
BCH

$BCH hasn’t hit a new ATH since 2017: Dead or Utimate Sleeper?SET:BCH hasn’t hit a new ATH since 2017: Dead or the Utimate Sleeper?
SET:BCH ATH: $4,212 (Dec 2017)
CRYPTOCAP:BTC ATHs: $19,800 (Dec 2017), $69,000 (2021), $126,000 (2025)
Observation:
SET:BCH hasn’t touched a new ATH since 2017.
CRYPTOCAP:BTC surged 6x+ after 2017 ATH, but SET:BCH stalled.
Is SET:BCH dead ❓
Key TA Levels:
🔹 Strong accumulation zone: $465 – $375
🔹 Critical support: $375 (holding this is essential)
🔹 Potential upside: $2,000 – $4,000 if momentum returns
Eyes on these levels. SET:BCH could be a sleeper play if it reclaims support.
Pro Tip: Patience + volume confirmation = key before any breakout.
NFA & DYOR

BCH Great Risk Reward Trade 15Septmber2025Hi Folks,
Technically BCH is Strong and ready for upward move!
My indicator has given a good entry and price is still in range so I have entered. Will post trade result in comments section later!
Stay Tuned

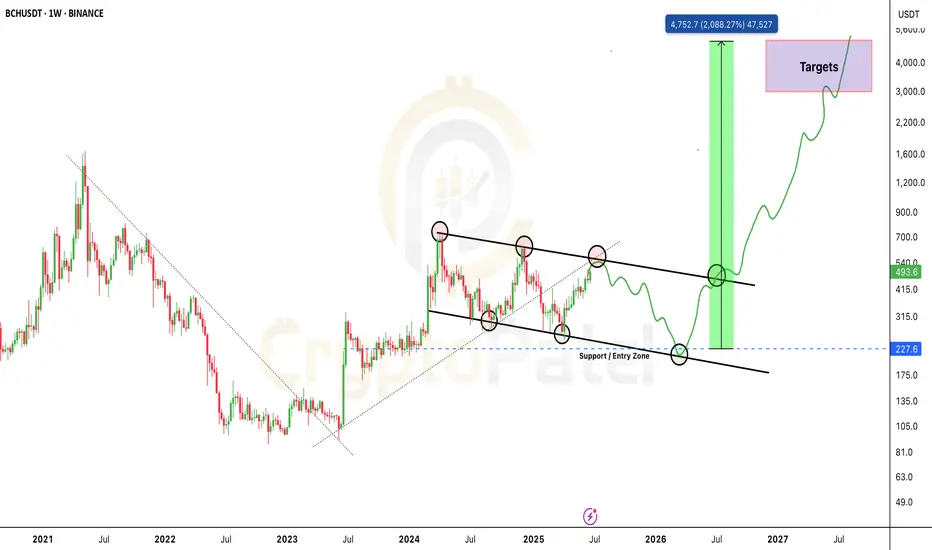
BCH Could 10x in the Next Bull Run — But Not YetBCH Could 10x in the Next Bull Run — But Not Yet
Bitcoin Cash is still trading inside a big falling channel.
Every time price hits the lower zone at Bull Flag, it bounces back up — this is the strong Support / Entry Zone.
Right now, BCH is near the upper Trendline Resistance (~$550-$580).
But IMO, we could see one more retracement before the next big bull run. I’m expecting price to revisit the $250–$210 zone before the next leg up.
However, if BCH breaks and holds above $640, that would confirm a bull flag breakout — turning the structure fully bullish with potential long-term targets between $1,800 – $4,000+ by 2026–2027.
Stay alert. The setup is big — but timing is key.
Note: NFA & DYOR

BCH/USDT — The Final Dip Before a 10x Move?Weekly Chart Analysis | Long-Term Setup
BCH is forming a powerful macro structure that could lead to a massive breakout.
🔹 Descending Channel Structure
The price has been respecting a clean descending channel since 2023.
Each rejection from the upper trendline has led to a higher low — showing clear accumulation.
🔹 Key Entry Zone: $220–$230
This zone has acted as major support multiple times.
If BCH revisits this level and holds again, it could trigger a major trend reversal.
🔹 Breakout Targets: $3,000–$5,000
If the breakout occurs as projected, BCH could rally into this zone in the coming bull cycle.
This would be a potential 10x+ opportunity from the bottom range.
Final Thoughts:
📌 This is not a short-term play.
📌 It’s a macro setup for serious investors and position traders.
📌 The structure mirrors historical accumulation zones seen before massive moves.
💬 What’s your take on BCH long-term?
Comment below and share your chart if you’re tracking it too 👇
BitCoin CASH #BCH READY FOR THE PUMP This one is one of my Fav and has made me a fortune in the past
Looking for the same this time
We will trade the range here and the IDEA that this cup need an HANDLE
And then the CnH will be Ready for the breakout
RANGE (420->786)
220->420 TP1
420->620 TP2
620->786 TP3
786->888 TPX
786->1786
SL 210

Bitcoin Cash: Breakout or Breakdown? Critical Levels to Watch!Yello, Paradisers! Have you noticed the recent patterns forming in BCHUSDT? It's shaping up to be a pivotal moment for Bitcoin Cash. Let’s dive into the details!
💎BCHUSDT has recently taken liquidity and is forming a triangle pattern. On the lower timeframes, BCH has developed a W pattern, which typically signals a higher probability of a bullish move. However, to confirm this and target higher levels, we need a breakout and a candle closing above the resistance zone. This confirmation would significantly increase the likelihood of a bullish continuation.
💎If BCH breaks out and closes candle above the resistance zone, it would validate the bullish W pattern and open the door for higher targets.
💎In the event of a pullback, we can expect a bounce from the support zone, potentially forming a triple bottom, which is another bullish sign.
💎Conversely, if BCH breaks down and closes below the support zone, it will invalidate our bullish outlook.
Stay focused, patient, and disciplined, Paradisers. This is the only way you can make it far in your crypto trading journey. Be a PRO💰
MyCryptoParadise
iFeel the success🌴

Keep a close eye on BCHUSDT as it approaches crucial levels👀💎 Paradisers, #BCH is approaching the supportive trendline and the previously broken resistance area, which might now serve as a support.
💎If #BCHUSDT breaks its higher low and exhibits signs of a Change of Character (CHoCH) and Break of Structure (BOS) from this support zone, we can expect a bounce to the next swing resistance.
💎However, if there is no confirmation and the support zone along with the supportive trendline break down, it will be viewed as bearish. Nonetheless, there is another support zone below this, which is considered stronger. Even so, confirmation is crucial before taking action there as well.

BCH: We might see a rebound from there.🚀💎 Paradisers, #BCH is currently experiencing panic selling, and I am expecting a potential breakdown of the supportive trendline to gather liquidity for an upward trend.
💎If #BCHUSDT breaks below the trendline and exhibits a Change of Character (CHoCH) and Break of Structure (BOS) from the bullish Order Block (OB), which coincides with the Fibonacci 0.618 level, we might see a rebound from this point.
💎However, if the price falls below this level, it would typically be considered bearish. In this scenario, I would recommend not focusing on this move.

BCHUSD under Consolidation - Might turn BearishI feel BCHUSD might turn bearish below 315 because there might be a small distibution phase if the previous resistance is not broken !

BCH Pumped 107% in 10 Days #BitcoinCash Pumped 107% in 10 Days
➡️ Bullish Pennant Breakout
➡️ Breakout + Retest
➡️ Perfect Target as per Chart Pattern
CRYPTOCAP:BCH

BCH/USDT: A Comprehensive Outlook for Traders and Investors
In this technical analysis, we delve into the BCH/USDT trading pair to identify potential trading opportunities for both aggressive players and long-term investors.
1. Resistance Area - 250-257:
The BCH/USDT pair encounters a robust resistance zone between 250 and 257. Historical data indicates that price movements tend to stall or experience pullbacks around this level. Traders should approach long positions with caution, as the price may struggle to break through this barrier in the short term.
2. Aggressive Shorting Opportunity at 235-240:
For aggressive players, shorting opportunities arise at the current price levels of 235-240. As the price approaches the upper range of the resistance area, bearish sentiment could intensify, leading to potential short-term declines.
3. Expected Correction to 195-200 Levels:
Our analysis suggests an impending corrective phase for BCH/USDT, with the price likely to correct towards the support levels of 195-200.
4. Favorable Buying Area - 140-150 Levels:
A compelling buying opportunity emerges at the 140-150 support range. Long-term investors seeking to build positions in BCH may find this area advantageous for accumulating assets.
Remember to adopt prudent risk management strategies to maximize gains and mitigate potential losses. Stay informed, and happy trading!

💡Don't miss the great buy opportunity in BCHUSDTrading suggestion:
". There is a possibility of temporary retracement to the suggested support line (328.0).
. if so, traders can set orders based on Price Action and expect to reach short-term targets."
Technical analysis:
. BCHUSD is in an uptrend, and the continuation of the uptrend is expected.
. The price is above the 21-Day WEMA, which acts as a dynamic support.
. The RSI is at 70.
Take Profits:
TP1= @ 347.2
TP2= @ 360.8
TP3= @ 373.1
TP4= @ 384.2
TP5= @ 396.5
SL= Break below S2
❤️ If you find this helpful and want more FREE forecasts in TradingView
. . . . . Please show your support back,
. . . . . . . . Hit the 👍 LIKE button,
. . . . . . . . . . Drop some feedback below in the comment!
❤️ Your support is very much 🙏 appreciated!❤️
💎 Want us to help you become a better Forex / Crypto trader?
Now, It's your turn!
Be sure to leave a comment; let us know how you see this opportunity and forecast.
Trade well, ❤️
ForecastCity English Support Team ❤️

bch usdt perputal trade daily chart bchtoday i analysis bch ust for binance perputal trade
buy @ 432$ and selling target is 584$ predict basic on trend line and fibinaci tool and moving average ribbons and rsi indicator, wait and i got profit i am so much happy, i am bigginer of crypto try to improve my skill although any correction please comment its so helpful for me in future analysis
thanks and regards

💡Don't miss the great buy opportunity in BCHUSD
Trading suggestion:
". There is a possibility of temporary retracement to the suggested support line (596.1).
. if so, traders can set orders based on Price Action and expect to reach short-term targets."
Technical analysis:
. BCHUSD is in a range bound, and the beginning of an uptrend is expected.
. The price is above the 21-Day WEMA, which acts as a dynamic support.
. The RSI is at 53
Take Profits:
TP1= @ 628.3
TP2= @ 680.0
TP3= @ 722.8
TP4= @ 787.9
TP5= @ 833.2
SL= Break below S2
❤️ If you find this helpful and want more FREE forecasts in TradingView
. . . . . Please show your support back,
. . . . . . . . Hit the 👍 LIKE button,
. . . . . . . . . . Drop some feedback below in the comment!
❤️ Your support is very much 🙏 appreciated! ❤️
💎 Want us to help you become a better Forex / Crypto trader ?
Now, It's your turn !
Be sure to leave a comment; let us know how you see this opportunity and forecast.
Trade well, ❤️
ForecastCity English Support Team ❤️

💡Don't miss the great buy opportunity in BCHBTCTrading suggestion:
". There is a possibility of temporary retracement to the suggested support line (0.01371).
. if so, traders can set orders based on Price Action and expect to reach short-term targets."
Technical analysis:
. BCHBTC is in a range bound, and the beginning of an uptrend is expected.
. The price is above the 21-Day WEMA, which acts as a dynamic support.
. The RSI is at 64.
Take Profits:
TP1= @ 0.01447
TP2= @ 0.01523
TP3= @ 0.01608
TP4= @ 0.01810
TP5= @ 0.01961
SL= Break below S2
❤️ If you find this helpful and want more FREE forecasts in TradingView
. . . . . Please show your support back,
. . . . . . . . Hit the 👍 LIKE button,
. . . . . . . . . . Drop some feedback below in the comment!
❤️ Your support is very much 🙏 appreciated!❤️
💎 Want us to help you become a better Forex / Crypto trader?
Now, It's your turn!
Be sure to leave a comment; let us know how you see this opportunity and forecast.
Trade well, ❤️
ForecastCity English Support Team ❤️

BCHUSD Coinbase - Looking for EntryCOINBASE:BCHUSD has had a lovely history of long up and down trends. Historically they have lasted near half a year at a time in the past. We are back to a downtrend as the price has fallen below the 200 day EMA, Supertrend is red and the Heikin Ashi candles all red. Like most of the larger coins we seem to be at a consolidation period of low volume with horizontal trades going on. It looks like a possible reversal for BCH but we will have more information in the next few days on the long term effects here. It honestly could go either way for this coin but I think we will see a reversal soon, but not enough to see an overall long uptrend. The EMA is below a strong line of resistance and the Supertrend indicator is falling below it to.

💡Don't miss the great buy opportunity in BCHBTC
Trading suggestion:
". There is a possibility of temporary retracement to suggested support line (0.0196).
. if so, traders can set orders based on Price Action and expect to reach short-term targets."
Technical analysis:
. BCHBTC is in an uptrend and the continuation of uptrend is expected.
. The price is above the 21-Day WEMA which acts as a dynamic support.
Take Profits:
TP1= @ 0.0236
TP2= @ 0.0265
TP3= @ 0.0298
TP4= @ 0.0326
TP5= @ 0.0340
SL= Break below S2
❤️ If you find this helpful and want more FREE forecasts in TradingView
. . . . . Please show your support back,
. . . . . . . . Hit the 👍 LIKE button,
. . . . . . . . . . Drop some feedback below in the comment!
❤️ Your Support is very much 🙏 appreciated! ❤️
💎 Want us to help you become a better Forex / Crypto trader ?
Now, It's your turn !
Be sure to leave a comment let us know how you see this opportunity and forecast.
Trade well, ❤️
ForecastCity English Support Team ❤️


💡 Don't miss the great buy opportunity in Bitcoin Cash/BitcoinTrading suggestion:
. There is a possibility of temporary retracement to suggested support line (0.0143). if so, traders can set orders based on Price Action and expect to reach short-term targets.
Technical analysis:
. Bitcoin Cash/Bitcoin BCHBTC is in a range bound and the beginning of uptrend is expected.
. The price is below the 21-Day WEMA which acts as a dynamic resistance.
. The RSI is at 70.
Take Profits:
TP1= @ 0.01610
TP2= @ 0.01760
TP3= @ 0.01890
TP4= @ 0.02040
TP5= @ 0.02330
SL= Break below S2
❤️ If you find this helpful and want more FREE forecasts in TradingView
. . . . . Please show your support back,
. . . . . . . . Hit the 👍 LIKE button,
. . . . . . . . . . . Drop some feedback below in the comment!
❤️ Your Support is very much 🙏 appreciated! ❤️
💎 Want us to help you become a better Forex trader ?
Now, It's your turn !
Be sure to leave a comment let us know how do you see this opportunity and forecast.
Trade well, ❤️
ForecastCity English Support Team ❤️

BCH/USDT Falling Wedge-BCH Falling Wedge pattern completed.
- Waiting for a clear breakout on 4 HR chart and target 0.618-0.786 FIB Level.
- Be careful with the fakeout.

BCH-BTC 10-30%Hello, thank you for your time.
Bitcoin Cash has once again broken out of support around 247-248.
The price reduces the volatility and resembles a compressive spring, forming a triangle. If it breaks up, the first target will be the top of the triangle around 277-280, which is about 10%. The next target is in the area of accumulation of horizontal volume 335-345. The break-down of the triangle will be hindered by the trend one, which in case of the break-down and confirmation will turn into support.
If you find the information useful, I'd appreciate a likes and a subscription.

A trading opportunity to buy in BCHBTCMidterm forecast:
While the price is above the support 0.0235, beginning of uptrend is expected.
We make sure when the resistance at 0.0480 breaks.
If the support at 0.0235 is broken, the short-term forecast -beginning of uptrend- will be invalid.
Technical analysis:
While the RSI uptrend #1 is not broken, bullish wave in price would continue.
A peak is formed in daily chart at 0.0285 on 05/09/2020, so more losses to support(s) 0.0246 and minimum to Major Support (0.0235) is expected.
Price is below WEMA21, if price rises more, this line can act as dynamic resistance against more gains.
Relative strength index ( RSI ) is 50.
Trading suggestion:
There is possibility of temporary retracement to suggested Buy Zone (0.02455 to 0.02350). We wait during the retracement, until the price tests the zone, whether approaching, touching or entering the zone.
Beginning of entry zone (0.02455)
Ending of entry zone (0.02350)
Take Profits:
TP1= 0.0296
TP2= 0.0332
TP3= 0.0403
TP4= 0.0480
TP5= 0.0549
TP6= 0.0652
TP7= 0.0868
TP8= 0.1055
TP9= 0.1245
TP10= 0.1857
TP11= Free
❤️ If you find this helpful and want more FREE forecasts in TradingView
Please show your support back,
Hit the 👍 LIKE button,
Drop some feedback below in the comment!
❤️ Your Support is very much 🙏 appreciated! ❤️
💎 Want us to help you become a better Forex trader?
Now, It's your turn!
Be sure to leave a comment let us know how do you see this opportunity and forecast.
Trade well, ❤️
ForecastCity English Support Team ❤️
Be sure to leave a comment let us know how do you see this opportunity and forecast.
Trade well, ❤️
orecastCity English Support Team ❤️
