💡Don't miss the great buy opportunity in BCHBTCTrading suggestion:
". There is a possibility of temporary retracement to the suggested support line (0.01371).
. if so, traders can set orders based on Price Action and expect to reach short-term targets."
Technical analysis:
. BCHBTC is in a range bound, and the beginning of an uptrend is expe
💡Don't miss the great buy opportunity in BCHBTC
Trading suggestion:
". There is a possibility of temporary retracement to suggested support line (0.0196).
. if so, traders can set orders based on Price Action and expect to reach short-term targets."
Technical analysis:
. BCHBTC is in an uptrend and the continuation of uptrend is expected
💡 Don't miss the great buy opportunity in Bitcoin Cash/BitcoinTrading suggestion:
. There is a possibility of temporary retracement to suggested support line (0.0143). if so, traders can set orders based on Price Action and expect to reach short-term targets.
Technical analysis:
. Bitcoin Cash/Bitcoin BCHBTC is in a range bound and the beginning of uptren
BCH-BTC 10-30%Hello, thank you for your time.
Bitcoin Cash has once again broken out of support around 247-248.
The price reduces the volatility and resembles a compressive spring, forming a triangle. If it breaks up, the first target will be the top of the triangle around 277-280, which is about 10%. The next
A trading opportunity to buy in BCHBTCMidterm forecast:
While the price is above the support 0.0235, beginning of uptrend is expected.
We make sure when the resistance at 0.0480 breaks.
If the support at 0.0235 is broken, the short-term forecast -beginning of uptrend- will be invalid.
Technical analysis:
While the RSI uptrend #
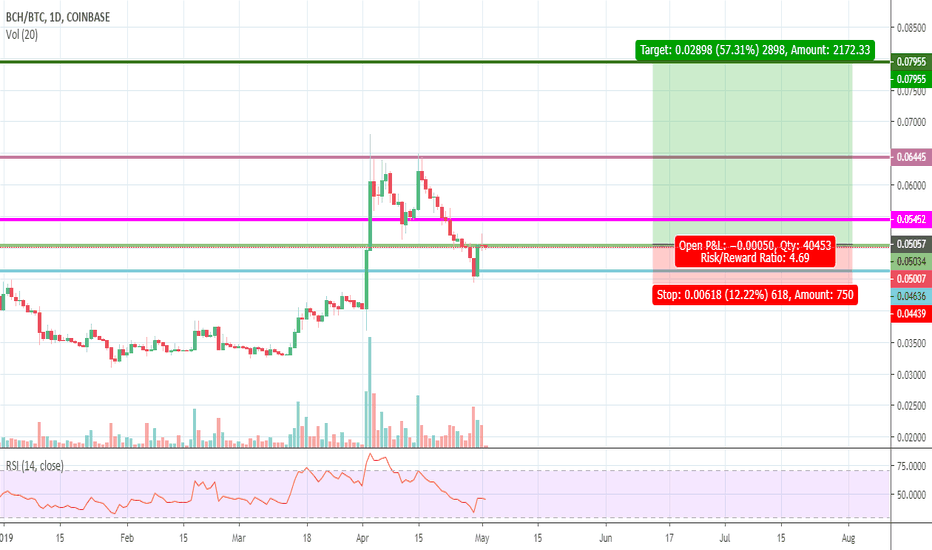
BCH at supportBCHBTC is currently sitting .5 fib support level after bouncing up from .618fib level. The indication is of another leg up. If the uptrend is resumed. 0.05452 will be first resistance then 0.06445. If BCH goes above 0.06445 then a final target is 0.07955. A long entry can be pushed at the moment but
BHCBTC - technical Analysis - market move - Price?Hello guys, we had analyse BCH/BTC market and found falling wedge pattern and had drawn target price as per pattren breakout and got small bearish divergence and market may move till D-wave. As we know falling wedge is a bullish pattern but market condition is not good but you can trade according
BCHBTC Latest Technical Analysis 40% Target projection.We are doing Analysis of BCHBTC on Daily Timeframe .
With the Help of trend line , I have made trend line
Support and Resistance Levels
Note: This is only for Educational Purpose this is not an Investment advice.
Please support the setup with your likes, comments and by following on Trading V
See all ideas
Displays a symbol's price movements over previous years to identify recurring trends.


