DRREDDY FallingIn a very similar to Nifty (I shared an idea on it just 4 hours back), there's an observation of Stochastic Triple Divergence in NSE:DRREDDY indicating a bear trend. A short position is recommended with a target of 2004(t1) & 1904(t2). A stoploss of 2100 is highly recommended. Selling range should be (2040-2070).
Bearish-divergence

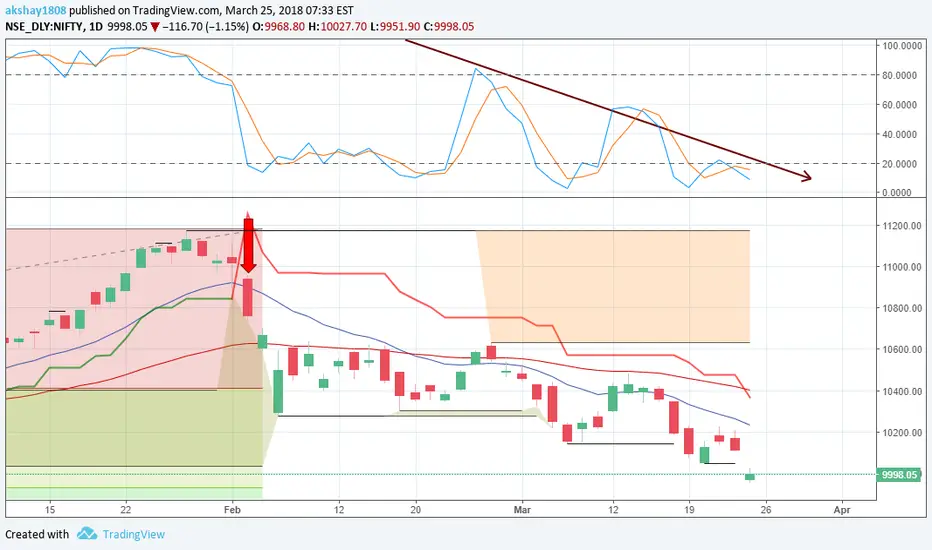
One last fall in NiftyIts a cliche but falling in NSE:NIFTY is inevitable. Bearish divergence in Nifty is clearly seen that indicates a short term but a very steep fall in next week. Year end closing will be bad hurting Returns on Investment of lot of mutual funds.
Short in opening trade on monday above 9980 (or upto 9965) with a target of 9933 (t1), 9686 (t2), 9548 (t3).
A stop loss of 10100 is recommended.
Triple Bearish Divergence in SunPharmaAs seen in above charts triple stochastic divergence is seen in NSE:SUNPHARMA giving a confidence of clear bearish phase.
Short NSE:SUNPHARMA at 530 with a target of 511(T1), 498(T2) & 466(T3). Stop loss of 542 is recommended.


Be Cautious!! { Negative RSI Divergance }On the daily charts of Piramal Enterprise, Negative RSI Divergance has been formed...
Looking towards price, it is standing on important support...
RSI Negative Divergance is indicating that it may break that support,
If it breaks that support we may see more down side..
Targets will be 2760/2700/2650/2600
SL will be 2800
If it dosent break that then target will be 2920/2970/3150
SL 2820
Note: Do your own study before making any position...
Please Like, Follow and Comment your views below...


Federal Bank Regular Bearish DivergenceMACD and RSI going down. Prices have seem to take a hit at 92.50.
Short with Target of 87.50
