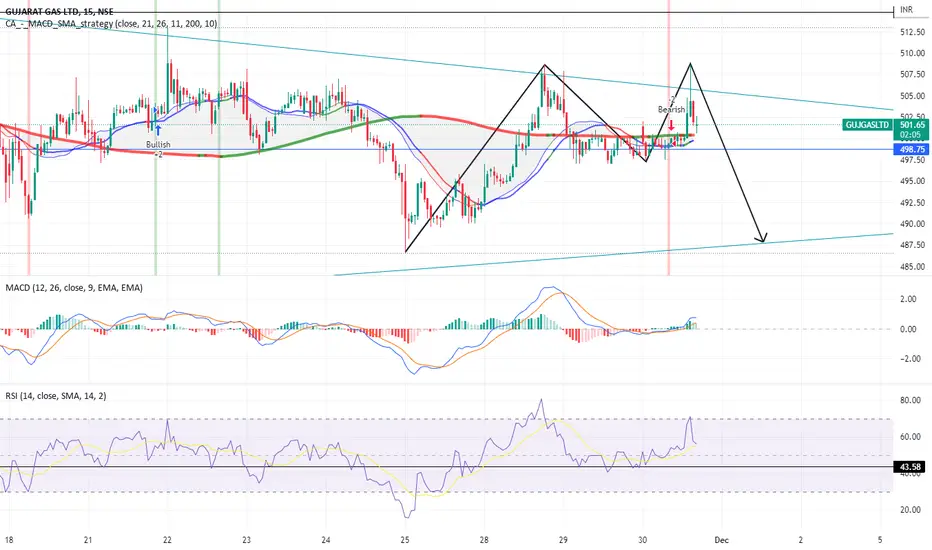
Bearish M pattern for short term / intraday Making bearish M pattern in short term with small bullish pattern.
Entry : 500 - 497
Exit : 490
SL : pre-heigh
Bearish Patterns
Laurus labs looks bearsihAs seen in above chart Lauruslab is in complex correction Wave WXY, wave Y is in progress which is subdivided into ABC , in which wave C is in process can go down till 410-390 one can keep it has target.
Risk management is Imp, use stoploss, Happy trading.

ETH analysis for short termETH has given a breakout of a rising wedge, Lets wait for a rejection from the supply zone and can look for a downside of up to 1040$ for the short term and 1110 for trading
If this analysis helped you then do follow and like.

Bitcoin Short-Bearish Pennant BreakoutBitcoin is making a pennant pattern which is about to breakout. It's a bearish pennant ,formed in 4h time frame.A bearish pennant usually breaks out downward but during the mixed emotions of the market and its' volatility can be cause of uptrend too.Also the market is on downtrend for a long time so a up move can be expected too.
But the major signs is in favour of bear market so keep an eye guys.wait for the move.The targets of upward is 18916 and 20997.and the downward target is 15640 and jump to 12133.Happy Trading.

INDUS IND BANK - DESCENDING TRIANGLE & DOUBLE TOPIndus Ind Bank is facing multi year resistance and price has already formed a double top
inside the descending triangle.
With the market looking very weak , this trade looks good to be taken with a risk reward
of 1:5.
Cheers.
priceNpedia

Natural Gas Resistance & Support LevelNatural Gas Resistance Level is 495 & 520 & crucial Support Level is 465

NIFTY will reach below 16400 NIFTY will reach below 16400 soon or later.
current resistance is 17200
support 17800

ETH LTF Play for (Shorts)HTF Trend is Bearish . Therefore, I am only looking for shorting options. There is Liquidity just above the Key-Level (Purple Zone) and a possible Order Block on HTF. That will be my POI (Point of Interest).
If the price reacts and rejects from that level, i will open shorts around $1330. Let's see.

Nifty50 - Overall Still Bearish - Sell On Rise CandidateNSE:NIFTY is still a sell on rise candidate on DTF & WTF basis. Overall view still bearish as the index is still trading below 20/50/100 EMA
Any upside will be just a pullback retracement rally,. Potential bearish pole and flag patten in the making and such pattens do attract 38.2%, 50% and 61.8% levels which are depicted using Fibo levels. A 72.8% retracement is a possible stretch and remote possibility
T1 - 15989
T2 - 16180
T3 - 16450
Downside open to 15110 levels again
Interestingly on weekly time frame on June 13th, NIFTY formed a falling window candlestick pattern and as of July 1st closing, it has formed Downside Tasuki gap . As per the pattern analysis, bears are still strong as the bulls were not able to close the gap within 3 weeks of trades of falling window candlestick patten being formed. Sure you can see a retracement on the upside but higher level bears will bring in the supply making it a Sell On Rise candidate
Disclaimer -
- The view expressed here are my personal views. I am publishing this for my own records and what I see on charts.
- If you're referring to this, please consider this ONLY FOR educational & research purposes.
- Past performance is not a guarantee for future predictions
- Any decision you take, you need to take responsibility for the same. DO NOT consider this as an investment suggestion.
- It's your hard earned money. Treat it wisely
- Trade / Invest keeping in mind your trading style, goals and objectives, time horizon & risk tolerance
- Do your own analysis and consult your financial advisor before investing.
TIA!

SOLARINDS Inverted Hammer is form near resistance area. Inverted Hammer is form near resistance in SOLARINDS. if on daily timeframe red candle is form in next trading session then this stock will be more bearish in upcoming days. if it will break the resistance zone and sustain above then only thinking for buying this stock for swing trading. as of now looking bearing.

BajajAutoBearish Wolfe wave with double top pattern.
For confirmation price has to go inside the channel signaling a false breakout scenario.

BATA WAS IN SET GET READY FOR BREAKOUT OR breakdown DISCLAIMER FOR EDUCATION PURPOSE ONLY bata was in setup be ready for uptrend and downtrend comment for any charts analysis for stocks

Maruti Maybe Short Term Bearish Trend Maruti near all time high and resistance
find attached chart we might go for handle invalid closing above ATH
Weekly RSI Negative divergence
if you are holding positions be cautious
2 days continuous selling from higher levels

TATA STEEL_BEARISHTata Steel ltd seems falling wedge pattern. Its bearish pattern. If price does not sustain above 106, it will move downward.

Bitcoin short-Double top breakoutBitcoin is forming a double top pattern in 1h time frame.The pattern is already retested two levels.If the wave breaks the support 1,a short trade can be initiated with the risk to reward ratio of 1:3 as seen on the image.It can take retest the level of support 2 and support 3 as well,so be patient.Also,US fed reports are coming so market can be volatile.

XAUUSDHello dear traders.
Gold has given mixed signals. In my opinion it is still under bearish pressure but with lack of strong downtrend momentum right now.
10Y and 30Y yields and DXY are green, so this has already pushed prices down fomr the multiple times checked 1670 level. 1670 was great for 50 pips sell.
On the other hand there is the 4H ascending trendline and at the moment while price lies at the support. It could easily bounce back up.
But, my blue arrows indicate a weakness to form higher highs. In conjuction with long spike bullish candles, I see that insitutions have not initiated their real direction.
They do scalp and they do close their profits in a short period of time.
We can go long from 1660 to 1668-1670 with SL below the last support or we may enter long even better after the break & retest of the resistance level.
Try to avoid trading during today's high impact news of USA. Keep an eye of this data to be released, in order to decide which will be the most logical direction.
Otherwise,
If the support is broken, we go short accordingly.
GL!!

RELIANCE_INDS_H&S_BearishReliance Industries looks like a head-and-shoulders formation. If the price breakout the neckline & sustains below the 2600 , the pattern will be activated. See downside upcoming target 2440.

BITCOIN CHARTbitcoin follows DECENDING WEDGE when it break the wedge it follows the arrow which i drawn.


Nifty: Is Nifty Feeling the October heat near resistance zone?Nifty
- We are looking at daily candlestick chart
Observations
- On 16 Sept Nifty opened gap down between 17877 to 17796
- coincidently Nifty 76.4% retracement level is also around same level 17777
- for 4 consecutive days Nifty is struggling at 17800 levels
- With 1 hour's trade to go today volume is on a lesser side
Given the conditions, fresh longs in Nifty can be avoided.
Have bought a few Put options for 24 November expiry.
Review points for me - View gets invalidated if Nifty trades above 17880
Please follow your risk management measures
Take care & safe trading...!!!
Disclaimer
-The view expressed here is my personal view
- Past performance is not a guarantee for future predictions
- I have been wrong in the past and can be wrong again in future too
- Use this for educational purpose
- Any decision you take, you need to take responsibility for the same
- It's your hard earned money. Treat it wisely
- Trade / Invest keeping in mind your trading style, goals and objectives, time horizon & risk tolerance
- if trading in F&O, understand that F&O trading involves risk
- Do take proper risk management measures
- Do your own analysis and consult your financial adviser if need be

ICICI Bank: Chart set up and trading strategyICICI Bank
We are looking at daily candlestick chart pattern
Observations
- ICICI Bank chart reflects it made a gravestone doji on September 15, 2022 (indicates previous buyers were happy to sell at 936 odd levels)
- subsequently we saw profit booking in the stock
- now the stock is back at 920-940 odd levels
- we see ICICI Bank still not making a decisive move above the September 15 high
View going forward
- so far as ICICI Bank is below 945 odd levels we might see ICICI Bank rangebound
- support at 868 / 844
Given the set up one may consider a Bear Call Spread strategy in ICICI Bank
Sell 960 Call option currently around 12
Buy 1000 Call option currently around 4
Net receivables 8 points
Lot size 1375
Net profit potential Rs 11000 per strategy lot
Margin requirement - approximately 93500
Yield Potential - 11.75% approximately
Review point for me: If ICICI Bank closing is above 943.
It gives ample scope to adjust / exit in case stock moves otherwise. Pls follow your Risk management measures.
Take care & safe trading...!!!
Like and follow for more trading ideas like these
Disclaimer
- The view expressed here is my personal view
- Past performance is not a guarantee for future predictions
- I have been wrong in the past and can be wrong again in future too
- Use this for educational purpose
- Any decision you take, you need to take responsibility for the same
- It's your hard earned money. Treat it wisely
- Trade / Invest keeping in mind your trading style, goals and objectives, time horizon & risk tolerance
- if trading in F&O, understand that F&O trading involves risk
- Do take proper risk management measures
- Do your own analysis and consult your financial adviser if need be

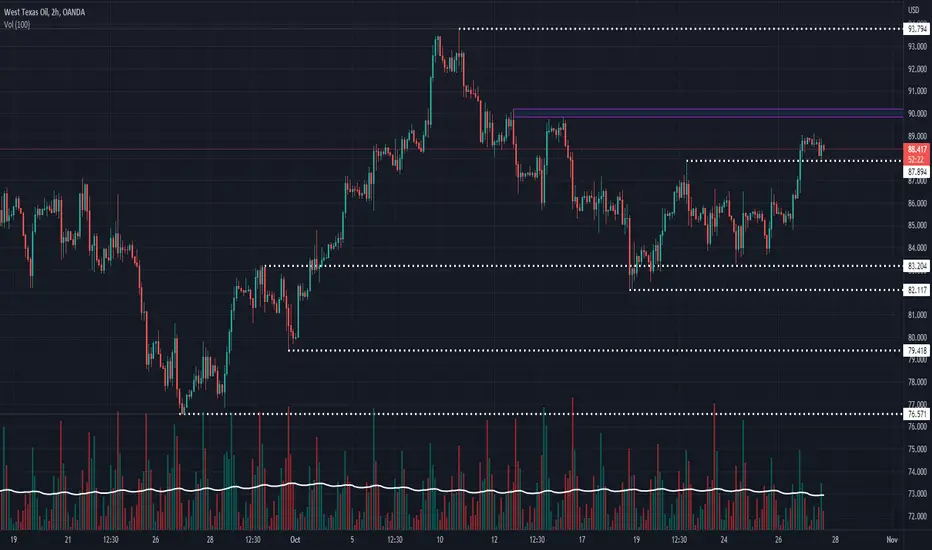
Update on the WTICOUSD(Crude Oil) WTICOSUD(Crude Oil) is showing some interesting movement on major levels. Major upper and lower levels could be breached in the future.
Crude Oil is showing a strong upward movement in the 1Hour chart breaching the level of $87.894. It seems that the counter is consolidating, if the price retests the levels of $87.80 and makes any type of bullish pattern or sign, then the counter can be stated to buy on dips. However, if the price cuts under the $87.80 price mark you can say it’s a falls breakout. It seems to me that the levels from $87.894 to $82.117 are the consolidation zone because of the major support mark of $83.204 to be pressed as per ‘Hourly’ charts like 1H,2H,3H, and 4H respectively.
If the price retests the $87.80 mark shows singings of a bullish move. I see overhead resistances at the price mark of $90.00 and $94.00.
• $90.00 can be considered as overhead resistances since the recent fall after the first structure change breakout. Price was rejected twice from the zone of $90.189 to $89.826 and a major fall was seen, hence the mark of $90 as per the hourly chart
• $94 mark was considered, because of the major fall seen from this mark after the first structure change breakout.
After the signs of a retest of the $87.80 mark, the counter can be considered as “Buy On Dips”(BOD). Then after the First Structure Change in the 1Day chart if the price sustains above the price mark of $94 you can consider the counter going in an uptrend.
There is also the major possibility of the breakdown of crude, considering fundamental things. The major support level that you can see as of now is $83, if the price breaches the zone of $83.204 to $82.117 this counter can be considered as a sell-on really and the price can be seen touching the support levels of $79.418 & $76.571 as well.
In my opinion, if the price breaches the mark of $76.5 and continues to move, and also if the major level in the 1day chart breaks down, then Crude would continue the Downtrend and we can say that this was just a consolidation phase.
Furthermore, support levels in daily and weekly charts are $66.391, $62.069, $33.501 & $11.104 as far as I can see, after creating a Multi Time Frame view(MTF) from an “only chart analysis perspective”. practically speaking these levels aren’t possible in today’s economical times.
“WTICOUSD” is the code for ‘crude oil’ on the ‘trading view’ platform source known as “OANDA” to see the chart I’m talking about.