Nifty: Gap Analysis and Follow upAfter having a bad trading month in April, in May we traded less but got the view and trade right of Nifty moving up from 15800 odd levels to 16600-16800 odd levels.
In my last post, it was suggested that Nifty might not move high any further.
Accordingly we had covered our Long position and created a short position.
Today Nifty has filled up the gap zone which had got created on 30th May 2022.
Short positions created earlier may Consider to book profits and wait for the next cue.
So far so good...Nifty movement has been exactly as per what Technical Analysis guided us. Now it is interestingly poised here.... If Nifty holds on to this level, Nifty might try to recovery again. However if we see no follow up buying, then it might be a case of Nifty filling previous gap that was created on 6th May 2022 (highlighted in red colour) and we might see continuation of down trend.
Hence, here I would wait and watch before I take the next trade...
Take care & safe trading...!!!
To trade with me...
Like and Follow me
Disclaimer
- The view expressed here is my personal view
- Past performance is not a guarantee for future predictions
- Use this for educational purpose
- Any decision you take, you need to take responsibility for the same
- It's your hard earned money. Treat it wisely
- Trade / Invest keeping in mind your trading style, goals and objectives, time horizon & risk tolerance
- if trading in F&O, understand that F&O trading involves risk
- Do take proper risk management measures
- Do your own analysis and consult your financial adviser if need be
Bearish Patterns


S&P 500 BULL TRAP IN PLAYS&P 500 is looking extremely dicey, we have formed a lower low on weekly and the drive up is most likely to trap retail traders and form a lower high. Watch how this plays out in the coming weeks.

HAVELLSHavells forming head and shoulder pattern on weekly timeframe
tomorrow if failed to hold 1145 then expect bears to take control for correction

EVENING STAR PATTERN IN DAILY TIME FRAME M_M all time high & good time for short.Because market are bearish & sideways.

Nifty: Chart set up, Technical Analysis view and strategy When Nifty was sub 16000 levels this is what was posted
Hit the play button and see the magic of Technical Analysis.
Now Nifty is near 200 day EMA
current levels have also acted as Support in the past
can the same zone act as resistance now?
Will Nifty fly higher or would it stop?
Only time will tell...
We are not that bullish from here on .
We have covered up our Nifty long position and have a initiated a trading strategy in morning to trade the new situation.
Our strategy gives us protection of 550 points to be wrong and yet not be in loss till expiry.
F&O trade is risky so trade with proper risk management in place.
Take care & safe trading...!!!
Life & Follow
Disclaimer
- The view expressed here is my personal view
- Past performance is not a guarantee for future predictions
- Use this for educational purpose
- Any decision you take, you need to take responsibility for the same
- It's your hard earned money. Treat it wisely
- Trade / Invest keeping in mind your trading style, goals and objectives, time horizon & risk tolerance
- if trading in F&O, understand that F&O trading involves risk
- Do take proper risk management measures
- Do your own analysis and consult your financial adviser if need be

Nifty 15 Min OverviewThis is a nifty Over View for 03-06-2022. It is not a recommendation. Trade at your only risk Management.

Banknifty Overall ViewJust a overall view of bank nifty. Just for educational purpose and trying to crate awareness of Technical Analysis. Focus on process not on results.

HINDALCO - BearishHINDALCO - Bearish
1st Double top, now inverted pennant flag pattern....
Let's see will it break up or downwards...
Educational purpose...

Mahindra Logistics - Inverted Flag PatternMahindra Logistics - Inverted Flag Pattern
Looks Bearish....
Educational purpose...

APLLTDParallel channel has been downward bearish since early 2021
720 is crucial on closing basis for further fall

BTC wait for longs and shortsAs, we see BTC/USDT has been consolidating from last 14 days, so
1) If BTC/USDT breaks green trendline than it would be good to short on retest, and it is also forming a flag pattern (which is a continuation pattern) so we might see big correction with minimum 10% of move downside
2) But if bulls manage to break out of this kind of side-wise trend than it will show big move upside
So, huge moves are coming, if we break this sidewise trend (probably downside)
price might consolidate(or retest or take pullback) before breaking out
(Don't open any position on wick)
(Don't take trades based on this idea, even I don't trade according to my idea)
(Do your own analysis)
(NOT A financial advice)
(High chances of loss if you follow my idea)

KPIT TECH - Short term Bearish KPIT TECH - Short term Bearish
Good support at 425
Bullish only when it crosses more than 480
Educational purpose ...

LTTS LTTS 3368 from 3957 now it is ready to break 3345
then it will try to touch low level mentioned on the chart

Nifty - Demand Zones! We are at a very crucial juncture. If 15700 breaks, we might see 14900. If that breaks, 13000 will be the next support. If that breaks, 10200 seems like a solid wall.

PVRPVR showcase a trendline breakdown on daily chart today with good red candle yes volume is missing in todays candle so we will wait for proper retesting, Hoping bearish sentiments and past selloff will lead this to 1500.
Create short positions around 1730
SL as per your R:R
PShort


Mcdowell-n - short term bearishMcdowell-n - short term bearish
When it crosses 1000 will the bullish tread starts...
Educational purpose...

Bear Flag EUR/CHFBearish flag can be seen in 1hr time frame with bearish trend lets see how this pattern works

Nifty 50 Outlook for the Expiry week May 23 – May27Falcon Analytics Outlook Nifty 50 for the Expiry week ( May 23 – May27 )
As Discussed in Last Weekly Analysis Nifty sold off from major resistance @ 16387 while the major support for the week @ 15560 was not breached.
Technically for this week on the daily charts we see major support on the downside for Nifty50 index lies at 15726 levels,
whereas major resistance on the upside is capped around 16386 levels.
If Nifty50 index breaches major support on the downside and closes below it, we may see fresh break down and index can drag towards major support on lower side around 15474/15222 and and if breaches major resistance on the upside and closes above it, we may see fresh breakout and index can head towards higher levels around 16542/16794.
Currently Nifty50 index is trading Below 200 day EMA @ 16783 suggests long term trend is Bearish .
Range for the week is seen from 15222 on downside and 16794 on upside.
Below Mentioned Spot Levels can be used to trade Long Or Short during the week ahead.
( All Spot Levels)
RESISTANCE 4: 17046
RESISTANCE 3: 16794
RESISTANCE 2: 16542
RESISTANCE 1: 16386
WEEKLY PIVOT LEVELS: 16134
SUPPORT 1: 15882
SUPPORT 2: 15726
SUPPORT 3: 15474
SUPPORT 4: 15222
All above views for education purpose only.
Regards,
MD .

BANKNIFTY ANALYSIS TO KNOW SYMBOL: NSE:BANKNIFTY
Banknifty is at a crucial point in the weekly time frame, it has closed below the support zone after hovering over that for almost 1 Year.
Selling can be accelerated after a retest is done. Still, if the price closes above 34500 somehow it can be a temporary relief and after some time.
Bears can again try to push BNF down because this year it's the second attempt so one has to be cautious on both the Sides and book profits fast.


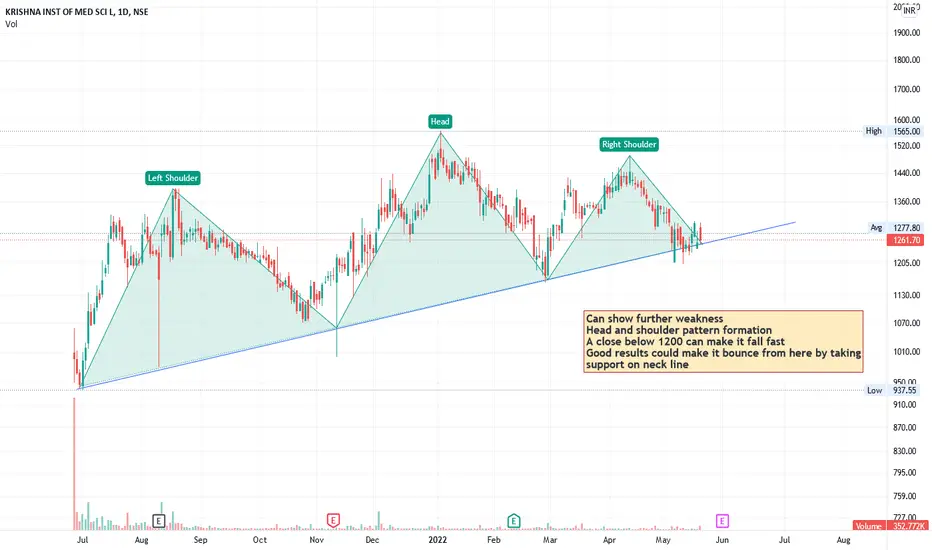
KIMS made head and shoulderCan show further weakness
Head and shoulder pattern formation
A close below 1200 can make it fall fast
Good results could make it bounce from here by taking
support on neck line