BTC/UsDT Short sideHere is a description of the downside scenario as depicted:
1. The Short Entry Point: The short trade is set up to begin at the approximate current price level, which is around $122,000 to $123,000. This suggests a trader is anticipating that the current strong bullish move has reached its peak and a reversal is imminent.
2. The Stop-Loss (Risk):
• The top boundary of the red box, which extends into the red area above the entry, represents the stop-loss level.
• This red area is relatively small compared to the profit target, suggesting a favorable Risk/Reward ratio.
• The stop-loss price appears to be around $126,864.5 (the highest point in the image is $126,864.5). If the price moves above this level, the trade would be closed for a manageable loss.
3. The Take-Profit (Reward/Target):
• The lower boundary of the red box, which extends significantly downwards, represents the take-profit or target area for the short trade.
• The profit target line appears to be around the $108,500 to $108,800 level, which is a key low from late September.
• This is where the trader would expect to close the trade for a profit if the anticipated downside move materializes.
4. The Context: The "downside chart" fundamentally represents a trade where the trader is betting on a significant price decline back toward the prior support levels after the large recent rally.
In summary, the downside chart (the red box) illustrates a hypothetical short position where a trader is risking a small amount of profit from the recent rally to potentially capture a much larger drop in price, targeting the strong support zone established just before the recent V-shaped recovery.
The term "downside chart" in this context refers to the short trade setup that has been drawn on the chart, which is visualized using the large red shaded box.
This setup represents a trader's prediction that the price of BTCUSDT will reverse and fall significantly from its current high.
Here is the breakdown of the downside trade setup:
• Entry Point (Current Price): The trade is initiated for a short position (selling) near the current market price, which is around $122,379.1. This is the belief that the recent powerful rally is exhausted and a reversal is starting.
• Stop-Loss (Risk): The area above the entry point, colored in the brighter red on the chart, represents the Stop-Loss level.
• The stop-loss price appears to be around $126,864.5 (the high shown in the top right).
• This is the level where the trade would be automatically closed to limit the loss if the price continues to rise against the short position.
• Take-Profit (Reward/Target): The large green shaded area below the entry represents the Take-Profit or profit target for the short trade.
• The target price is set significantly lower, near the prior support/lows from late September, likely around the $108,500 to $108,800 range.
• This is where the trader expects to close the short position to realize a profit.
• Risk/Reward Ratio (R:R): By comparing the distance from the entry to the stop-loss (the risk, in red) versus the distance from the entry to the take-profit (the reward, in green), the trade demonstrates a favorable Risk/Reward ratio. The reward (green box) is visually much larger than the risk (top red portion), suggesting the trader is attempting to risk a small amount to potentially gain a large profit.
In summary, the downside chart is the visual representation of a bearish trading strategy, expecting a move down from over $122k to the support area near $108k.
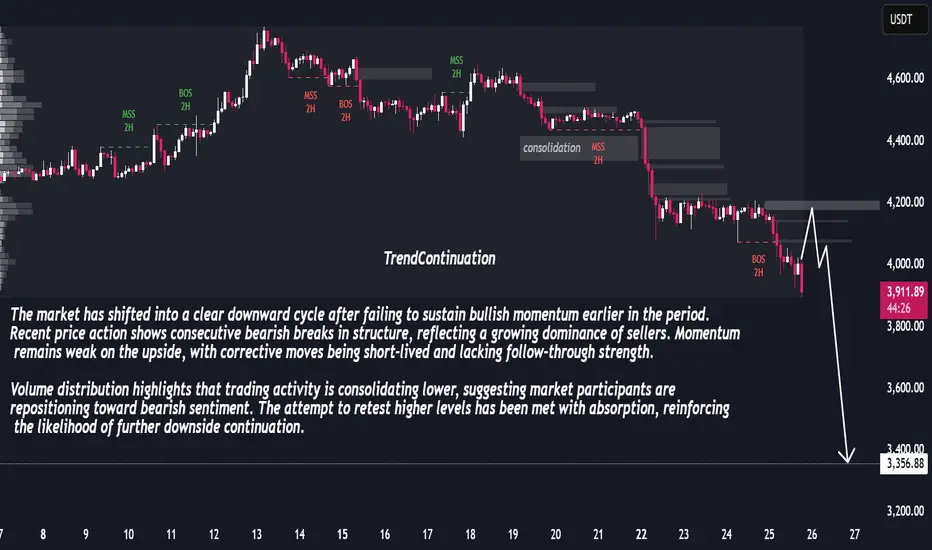
Bearishmomentum

Liquidity Shift Suggests Extended Bearish CycleThe market is showing a progressive decline after losing upward strength. Recent swings indicate a decisive bearish control, with successive shifts in structure confirming the downward pressure. Attempts to recover higher levels have been shallow, reflecting exhaustion on the buy side and stronger liquidity flow toward sellers.
Market behavior suggests that rallies are being used as opportunities to exit or reposition short rather than initiate sustained bullish momentum. This is consistent with the overall weakening tone across the chart, where volatility spikes have favored downward extensions.
Looking ahead, if the current pace of distribution continues, the market is likely to maintain a bearish trajectory with potential for deeper declines as liquidity seeks out lower price ranges.
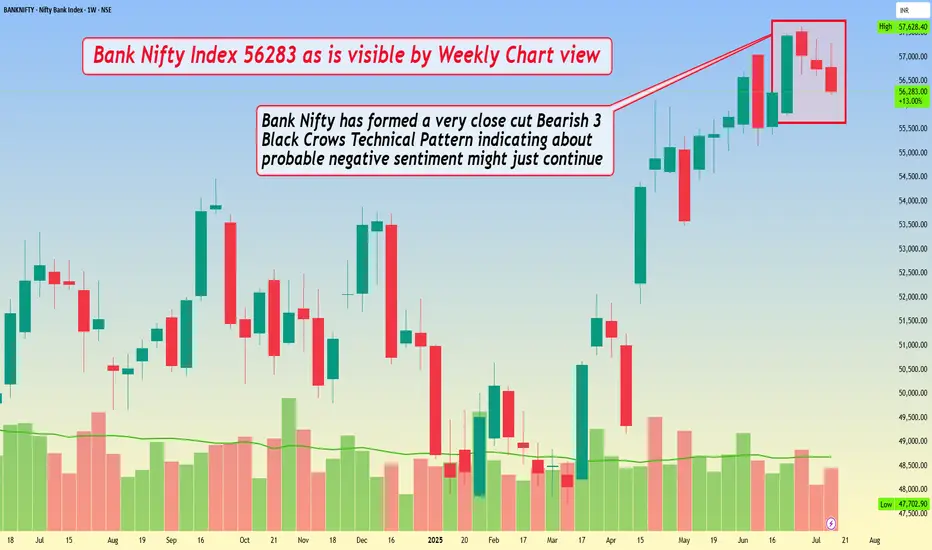
Bank Nifty Index 56283 as is visible by Weekly Chart viewBank Nifty Index 56283 as is visible by Weekly Chart view
- Bank Nifty has formed a very close cut Bearish 3 Black Crows Technical Pattern indicating about probable negative sentiment might just continue
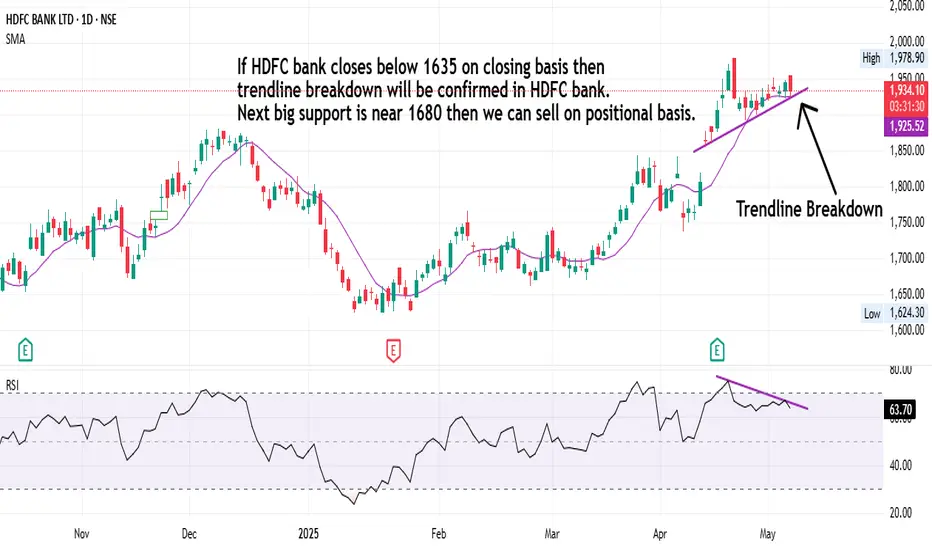
HDFC Bank Swing Trading Strategies!If HDFC bank closes below 1635 on closing basis then trendline breakdown will be confirmed in HDFC bank. Next big support is near 1680 then we can sell on positional basis.
ANGELONE - SHORT VIEWWe can look to Short Angel One near 3180 once there is a Negative Candle formation.
Targets are pretty good and risk reward is favourable too. Final Targets can be 2345.
Disclaimer: All information give is for educational purposes. Please consult your financial advisor before investing.
If you like such content please subscribe and share it with your Trader Friends or Family Members.
For more such content. Stay Tuned.

ICICI bank to test Pivot Levels , Selling may Continue till 1280After two Consecutive Selling sessions , it may or may not be a bearish moment in immediate session but to test pivot levels at 1280 and may bounce back to Higher Prices ,
Forming Lower lows consecutively , but didn't step into oversold zone still as per RSI ,
the 3 month trendline and Moving averages on daily chart shows it may test the pivot levels sooner ,
FII net buyer today but still prices were lower , if trend continues the FII may become selllers too , before going up , the prices may see some correction till 1280 in near future .
May hold buying or go short for short term .

Might Continue to be Bearish.It has Broken Below a Symmetrical Triangle and Also a Strong Support Zone of 200.

Bearish Trend Might Continue.As i have Drawn the the Elliott Waves 5 Waves were Completed and now the Stock is in A,B,C Correction Wave Last Phase(C) which might Drag it more further downwards to the levels of 280. A Descending Triangle formation is Also seen. Price Action Suggests Continuation of Down trend. Let Wait and Watch.

BITCOIN on Last Lower-Low DipAs per 1-day chart analysis, CRYPTOCAP:BTC performing well as per my previous perditions, already posted and mentioned below with its last Lower-Low soon around GETTEX:52K - GETTEX:48K , while it is already completed its second-final mark of $53.5k that lies between $55k- GETTEX:52K as per given charts.
so, need to take a little while more patience upto july month end, to completing its last Lower-Low mark and then from august onwards, #Bitcoin will starts moving slowly sideways with #Altcoins rally starts and slowly from sept. onwards fully mode of #BullRun 2024-25 cycle will be starts into their #Elliot #ImpilsiveWave upto next 7-8 months...
anyways,
always #DYOR before investing in #Crypto and Trade by using #StopLoss at this situations.
and,
always follow share & comment on my every post to get more updates...

Bitcoin's Last downtrend Coming Soon...#Bitcoin at Daily Chart Analysis
CRYPTOCAP:BTC market is still in volatility mode, and has made its lower-high, but it is currently finished their last uptrend cycle with some major ups & downs and finished at $71.8k approx..!
After that, its last down cycle is start to running, which will at least retest the previous level of $56k-$58k here or it can also break-out and will go to $55k to GETTEX:52K for the last timer lower-low. within next 12-15 days, it means you will be easily say that the next Downtrend upto $55k-$60k approx..!
After that, Bitcoin's #BullRun cycle will start completely in Uptrend mode from mid of July onwards, which will be starts on #Elliott Impulsive Wave Cycle for the next 6-8 months..!
Rest, do your research and invest and trade by using #DYOR & #StopLoss
and,
Comment, Like, Share, Follow on Posts..

NIFTY 4TH APRIL TRAP TRADING ANALYSISThe market (NIFTY50) is currently trading at 22416. However, it's important not to blindly follow the buy or call side under the yellow box, as it signifies a sideways zone. For the past two days, I've observed a sideways market with premiums not showing significant increases.
Here are the levels and analysis for the NIFTY Expiry on April 4th (TRAP TRADING):
Point 1: Avoid using the maximum amount in the Yellow zone, ranging from 22325 to 22500.
Point 2 (BULLISH): Consider going for the CALL side or bullish positions once the market crosses 22500. The targets will be:
Target 1: 22613
Target 2: 22650
Target 3: 22694
Point 3 (BEARISH): Go for the PUT side or bearish positions when the market crosses 22325. The targets will be:
Target 1: 22185
Target 2: 22150
Target 3: 22108
Note: Selling side momentum can be captured effectively as selling often yields better results than buying. However, it's crucial not to be biased towards any side. Wait for a level break and then align with the market. The market will consistently provide favorable outcomes, whether in terms of profit or learning.

NESTLEIND - Evening StarNESTLEIND - Watch out for a good breakdown/ shorting opportunity in 1D timeframe.
A few points to note:
1. There is a weekly reversal sign (bearish - Evening star pattern)
2. The stock is below 50DMA
3. Ascending wedge pattern - Usually is a bearish sign.
4. Overall on a higher timeframe, the stock is rallying - hence it is wise to be cautious and have a hedge.

Vodafone Idea : View on penny stock Alert! Bearish Pattern Spotted! 🐻
📊 Pattern: Broadening Pattern
📌 Symbol/Asset: IDEA
🔍 Description: Stock is making Broadening pattern and we can see resistance around 20-22 levels.
In history stock has corrected 50% from the rise so will this time we will see correction of 50% or more ??
23 is crucial resistance level and if stock not able to breakout then we might see good fall.
👉 Disclosure: We are not SEBI registered analysts, this is not a buy or sell recommendation.

Bitcoin at Bearish Divergence#BITCOIN 1-day Chart Analysis
As per present CRYPTOCAP:BTC movements under FWB:27K -$28k range, it's unable to break out $28.5k due to very lower volume into market and manipulators trying to do some Pump-Dumps in Market but its very much chances to breakout into another divergence towards $24k soon in #BearishZone.
Anyway, lets see, where it will be move next,
but, Always Trade with using of #StopLoss and #DYOR, its just #NFA
and.
Must Share. Like, Comment on it...

INDUS IND BANK - DESCENDING TRIANGLE & DOUBLE TOPIndus Ind Bank is facing multi year resistance and price has already formed a double top
inside the descending triangle.
With the market looking very weak , this trade looks good to be taken with a risk reward
of 1:5.
Cheers.
priceNpedia

tata powerTata power looking Bearish in Big time frame in 1week candel there form Head & Shoulder Sell bellow 200.

Bearish Pennat TradeThis is best example of bearish pennat trade.
if you want to learn chart pattern please comment.

Bajaj Auto: Bearish potential weekly double top & -ve newsChart wise double top break down potential exit on weekly charts and any 3447 previous swing low broken
Could see more downfall. The momentum on short term and medium term has entered bear zones .Trend
Indicators also bearish on all timeframes. Bollinger band spill out happened on weekly charts as well indicator
bearishness ahead. Entry could be on daily on breach of the previous swing low support break.

Axis Bank : Failed Inverted H&S patternAXiIS bank showing failed inverted head and shoulder pattern.this neckline
resistance was attempted to be broken in 2019 and two times in 2021 but failed
daily momentum is in bear zones and weekly and monthly momentum also has gone sideways.
trend indicators are bearish on all timeframes
A trade opportunity exit with initial target till next swing low and stop loss at neckline for swing or positional trades

#heromotorcorp potential short if H&S pattern breaks support#heromotorcorp weekly seems to have a head and shoulder pattern
watch out for neckline of same and whether if major support band currently it is reaching whether if it gets broken
and if so could be shorting opportunity if a breakdown red candle confirmed closes below it.
remember there is also a support available below near 2250 and only if it break do we have prolonged bearishness.
daily and weekly lost momentum to dip into bearish region.

#shreecement potential short candidate if falls from support#shreecement selling with high volume since a week. Momentum and trend in short term is bearish.
another red below the support zone where it is currently good give a short opportunity
that could more than 10%.

APOLLO HOSPITALS | BEARISH | DESCENDING TRIANGLE BREAKOUTApollo Hospitals has break out his support level.
Sellers can take trade. Target and SL have been mentioned in the chart itself.
