Bajaj Finance cmp 990.45 by Daily Chart viewBajaj Finance cmp 990.45 by Daily Chart view
- Support Zone 955 to 980 Price Band
- Resistance Zone 1005 to 1030 Price Band
- Bearish Head & Shoulders by neckline just above Support Zone
- IF ..... Support Zone brake then basis Bearish H&S downfall expected
- Support Zone tested, hoping it sustains, expect upside reversal by past data
Bearishsetup

ACTUSDT – Sell Setup (Futures | Intermediate)ACTUSDT – Sell Setup (Futures | Intermediate)
ACTUSDT is showing clear signs of weakness after failing to sustain above the recent resistance zone. Price action suggests sellers are regaining control, with lower highs forming and momentum shifting to the downside. A sell-stop entry at 0.02797 is planned to confirm continuation below support. If bearish momentum accelerates, price is expected to move toward 0.02739 as the first target, followed by 0.02677, which aligns with the next demand zone. The stop loss at 0.02884 is placed above the invalidation level to protect against false breakdowns. Overall, the structure favors continuation selling as long as price remains below resistance and broader market sentiment stays neutral to bearish.

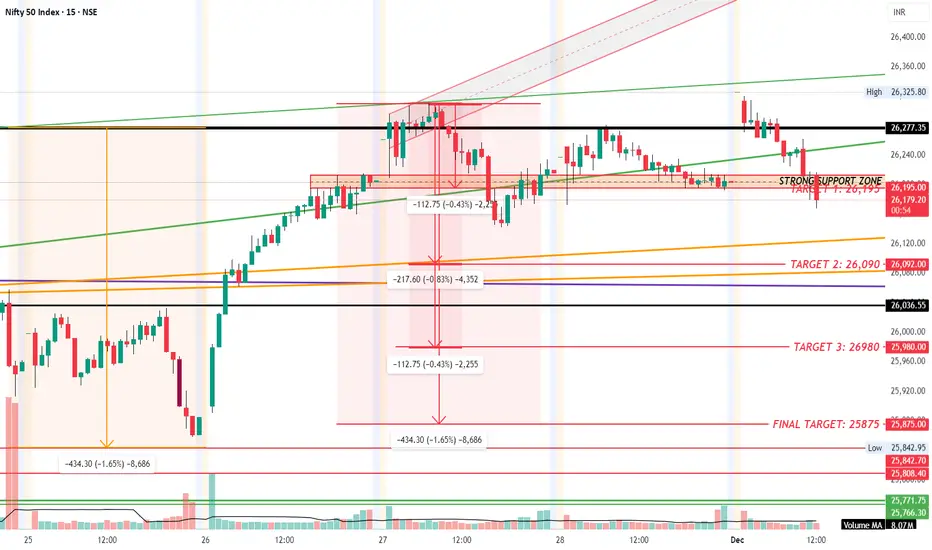
NIFTYNIFTY MADE HIGH WITH DOUBLE TOP along with DIVERGENCE, with stong support at 26200 level, if it breakdown this level we can expect NIFTY to fall below 26000 with final taget of 25,900
HAL – Trendline Rejection & Short SetupPrice has approached a major descending trendline and shown clear rejection near the supply zone. The structure is still respecting lower highs, indicating sellers are active at the top of the range.
I’ve taken a short position based on:
Retest of the descending trendline
Rejection from the previous supply zone
Overall bearish momentum within the channel
Good risk–reward towards the major demand zone around 4360
Invalidation:
Idea becomes invalid if price breaks and sustains above the trendline + supply zone.
Targets:
Major support / demand zone around 4360
Further downside if structure breaks
This is a technical analysis–based idea, not financial advice.
Let’s see how price reacts in the coming sessions.

Symmetrical Triangle breakdown 🔎 Overview
The Symmetrical Triangle is a contraction pattern formed when the market prints Lower Highs (LH) and Higher Lows (HL) inside two converging trendlines.
After a strong impulsive bullish move (flagpole), price enters consolidation as volatility shrinks — this creates the triangle.
Momentum shifts only when price breaks out of the structure.
A Symmetrical Triangle is a neutral pattern that can break in either direction, allowing momentum to expand upward or downward once price closes beyond the trendline.
In this chart, price breaks the lower trendline and touching the HL-Swing, confirming a bearish continuation.
⸻⸻⸻⸻⸻⸻⸻⸻⸻⸻⸻⸻⸻⸻⸻
📊 Chart Explanation
1️⃣ Strong Uptrend ( Flagpole )
Price starts with a sharp impulsive rally, forming the base structure before the triangle.
2️⃣ Initial Pullback → First LH + HL
After the rally, price begins contracting, creating alternating Lower Highs (LH) and Higher Lows (HL).
3️⃣ Lower High Swings
Multiple LH points show that buyers are losing strength on every upward attempt.
4️⃣ Higher Low Swings
HL points indicate buyers defending the lower boundary, but with weaker force as the structure tightens.
5️⃣ Converging Trendlines (Triangle Structure)
Upper trendline: Drawn by connecting successive LHs.
Lower trendline: Drawn by connecting successive HLs.
Both lines converge toward the apex, indicating decreasing volatility and market indecision.
6️⃣ Price Consolidation Zone
Inside the highlighted box, candles remain tight and range-bound — a classic compression zone before breakout.
7️⃣ Breakout Confirmation Rule
A valid breakout is confirmed only when a full candle closes beyond the upper or lower trendline and interacts with the nearest LH (for bullish break) or HL (for bearish break).
This shows that the breakout is strong enough to violate the previous swing structure, confirming directional momentum.
A full candle close below the lower trendline confirms bearish continuation.
This signals sellers have regained control and trend continuation is likely.
8️⃣ Bias After Breakdown
Since the prior move was strong bullish but the structure broke downwards, the pattern resolves as a bearish reversal of the short-term structure and continuation of immediate downside momentum.
⸻⸻⸻⸻⸻⸻⸻⸻⸻⸻⸻⸻⸻⸻⸻
🟢 Summary
Symmetrical Triangle is confirmed by alternating LH + HL swings.
Trendlines converge → volatility compression.
A confirmed breakdown close below the lower trendline = bearish continuation signal.
Price structure and swings are correctly identified as per textbook pattern rules
⸻⸻⸻⸻⸻⸻⸻⸻⸻⸻⸻⸻⸻⸻⸻
⚠️ Disclaimer
📘 For educational purposes only.
🙅 Not SEBI registered.
❌ Not a buy/sell recommendation.
🧠 Purely a learning resource.
📊 Not Financial Advice.

Pivot Points - Traditional🔎 Overview
Traditional Pivot Points are widely used reference levels derived from the previous session’s High, Low, and Close.
They help traders identify equilibrium , short-term trend direction , and key reaction zones where price may bounce or reverse.
The central Pivot Point (P) acts as the day’s balance line, while Resistance (R1–R5) and Support (S1–S5) levels map out potential price behavior for the current session.
---------------------------------------------------------------
📊 What the Levels Represent
🔹 Pivot Point (P)
1. A pre-calculated central level reflecting market equilibrium.
2. Price above P → bullish bias.
3. Price below P → bearish bias.
🔹 Resistance Levels (R1, R2, R3…)
• Highlight potential upside reaction zones.
• Useful for spotting breakout targets, continuation levels, or reversal points.
🔹 Support Levels (S1, S2, S3…)
• Mark potential downside reaction zones.
• Identify areas where buyers may step in or momentum may slow.
---------------------------------------------------------------
🟩 Bullish Bias
1. Price opens above Pivot Point (P) → early buyer control.
2. Long Opportunity (Pullback) : A retest and bounce from the Pivot confirms support.
3. Strong Momentum : A breakout above R1 strengthens the bullish structure.
4. Trend Continuation : Sustained price action above R2 reflects strong upside momentum.
---------------------------------------------------------------
🟥 Bearish Bias
1. Price opens below Pivot Point (P) → early seller control.
2. Short Opportunity (Pullback) : A retest and rejection from the Pivot confirms resistance.
3. Strong Momentum : Breakdown below S1 signals rising bearish pressure.
4. Trend Continuation : Consistent action below S2 suggests a short-term downside trend.
---------------------------------------------------------------
📝 Summary
• Pivot Points offer a structured roadmap for short-term price behaviour.
• P = balance line; R-levels = upside targets; S-levels = downside zones.
• Bias depends on where price opens relative to P.
• Helpful for traders using structure, pullbacks, and breakout confirmation in lower timeframes.
---------------------------------------------------------------
⚠️ Disclaimer
📘 For educational purposes only.
🙅 Not SEBI registered.
❌ Not a buy/sell recommendation.
🧠 Purely a learning resource.
📊 Not Financial Advice.

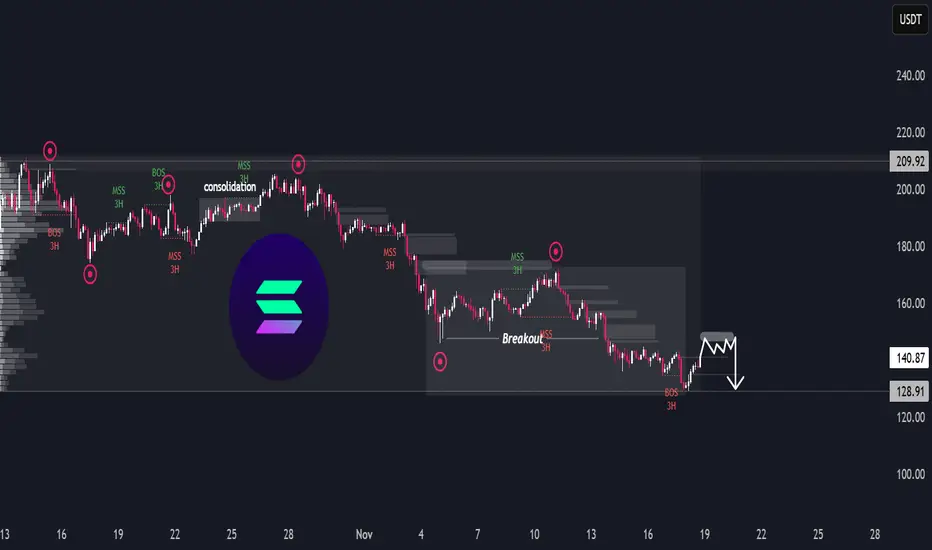
SOL/USDT – Downside LoadingSOL/USDT – Downside Loading
The chart shows a prolonged distribution phase followed by a steady macro decline, with multiple structure breaks confirming a persistent bearish flow. After the earlier consolidation in the upper range, each attempt to reclaim previous highs has been met with a shift in momentum, leading to progressive downside sequences.
The recent breakout from the lower range transitioned into continued weakness, indicating sellers remain in firm control. Despite short-term rebounds, the overall behaviour reflects a market that is unwinding previous demand zones rather than building new ones.
At the current level, SOL is forming a tight corrective pattern, suggesting price is building liquidity before the next directional move. Given the broader trend context, this type of compression typically precedes continuation rather than full reversal. The chart’s projection implies a potential liquidity sweep on the minor rally, followed by renewed downside pressure once short-term buyers are exhausted.
Overall, the environment still favours the bearish continuation scenario unless the market shows a decisive shift in character backed by sustained strength — something not yet present.
Gold 30-Min Chart: Sellers Active Near Resistance!Gold is once again testing its falling resistance trendline, which has already rejected the price several times in recent sessions. Each time the price touches this trendline, selling pressure increases, showing how strong this resistance zone is.
Currently, the price is near $4070–$4080, where short-term traders should stay alert. If the price fails to break above this resistance, a pullback toward the $4000–$3980 support zone looks likely. This area has previously acted as a strong demand zone, where buyers may re-enter.
However, if Gold breaks and sustains above this trendline resistance, we could see a fresh upside momentum building up toward $4115–$4135 levels. For now, the structure looks weak near resistance, and traders should wait for a clear breakout or rejection confirmation before taking any position.
Disclaimer: This analysis is for educational purposes only and should not be taken as financial advice. Please do your own research or consult your financial advisor before investing.
Analysis By @TraderRahulPal | More analysis & educational content on my profile.
If you found this helpful, don’t forget to like and follow for regular updates.

Gold Retracement After 200-Point Fall — Watch for a Rejection!Price Action in Focus | Short Setup on Key Resistance Zone
Gold (XAUUSD) posted a sharp 200-point drop from the all-time high at 4380 on Friday. The current move looks like a technical retracement, not a reversal — a classic dead-cat bounce scenario? 🐈📉
📍 Key Resistance Zone: 4280 – 4300
Price is now testing this zone, which previously acted as a breakdown level. If sellers step in here, we could see another leg lower.
🔍 Short Bias Setup (Not Financial Advice):
🧭 Sell Zone: 4280 – 4300
❌ Invalidation (SL): Above 4321
🎯 Targets: 4241 and 4221
💬 Watching for bearish confirmation before executing — candle wicks, volume spike, or RSI divergence could seal the deal.
⚠️ This is a technical idea, not financial advice. Always manage risk and confirm with your own strategy.
🔔 Follow for live chart updates, breakdowns & strategy threads!
Your feedback drives our content and keeps everyone trading smarter. Let’s make those pips together! 🚀
Happy Trading,
– The InvestPro Team

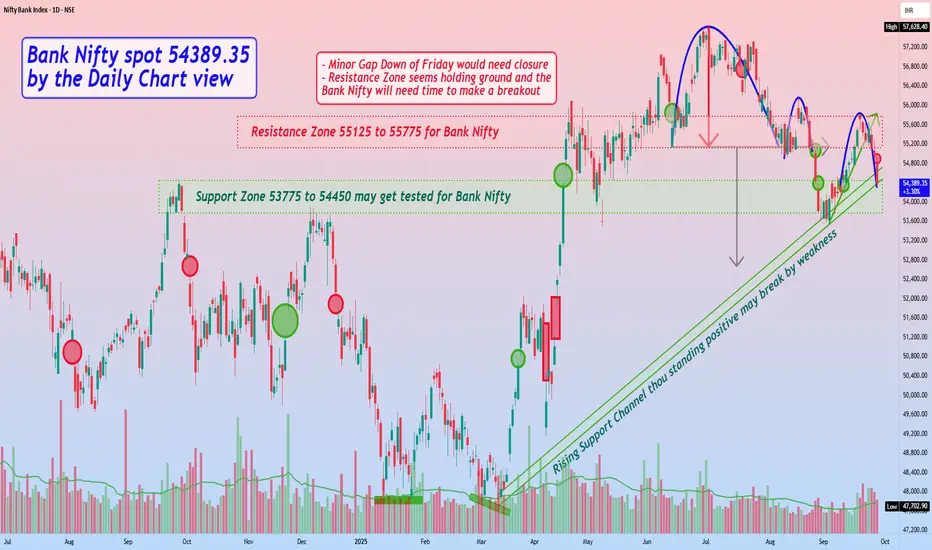
Bank Nifty spot 54389.35 by Daily Chart view - Weekly updateBank Nifty spot 54389.35 by Daily Chart view - Weekly update
- Minor Gap Down of Friday would need closure
- Resistance Zone 55125 to 55775 for Bank Nifty
- Bearish Rounding Top has made again at Support Zone neckline
- Rising Support Channel thou standing positive may break by weakness
- Support Zone 53775 to 54450 may get tested for Bank Nifty by ongoing weakness
- Resistance Zone seems holding ground and the Bank Nifty will need time to make a breakout
Caution ahead of US PPI report | Priority on Sell setups🟡 XAU/USD – 10/09 | Captain Vincent ⚓
🔎 Captain’s Log – Market Context
US 10-year bond yields rebound, signaling the market is awaiting key inflation data.
At 07:30, US PPI report will be released – a crucial figure that could strongly influence FED rate expectations.
Investors are also eyeing US CPI in the coming days to assess the inflation outlook.
The US Supreme Court accepted Trump’s appeal, but this news has not yet had a notable impact on Gold.
⏩ Captain’s Summary: Ahead of inflation data, Gold often tends to correct lower due to cautious sentiment.
📈 Captain’s Chart – Technical Analysis
Storm Breaker (Key Resistance):
Bearish OB: 3654 – 3660 (short-term upper cap)
ATH Watchtower: 3700 – 3702 (Sell Zone – possible new ATH test)
Golden Harbor (Strong Support):
Buy Zone: 3601 – 3602
OB Dock: 3582 – 3585
Currently, price is around 3640 – 3645, after a technical rebound from support. High probability that Gold will retest nearby resistance before a downward correction.
🎯 Captain’s Map – Trade Scenarios
⚡ Quick Boarding (SELL – Daily Priority)
Entry 1: 3654 – 3660
SL: 3668
TP: 3654 → 3650 → 3618 → 3610
Entry 2 – ATH Test: 3701 – 3703
SL: 3711
TP: 3688 → 3675 → 3665 → 365x
✅ Golden Harbor (BUY – Only at deep support)
Buy Zone: 3601 – 3603
SL: 3592
TP: 3610 → 3620 → 3630
⚓ Captain’s Note
“The golden ship faces turbulent seas today as it sails near Storm Breaker 🌊 (3654 – 3660) . Before the fierce winds called US PPI , sailors should prioritize dropping anchor with short-term SELL positions at resistance. Golden Harbor 🏝️ (3601 – 3603) remains a safe haven below, but only when the ship corrects deeply should it dock. On this voyage, Quick Boarding 🚤 is for scalp maneuvers, while the main current is still steered by the stormy waves of inflation.”

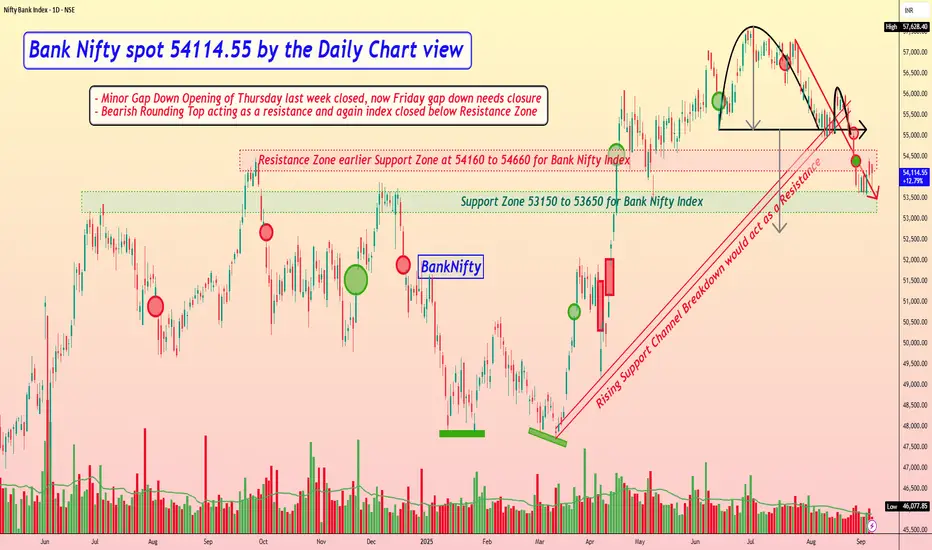
Bank Nifty spot 54114.55 by the Daily Chart view - Weekly updateBank Nifty spot 54114.55 by the Daily Chart view - Weekly update
- Support Zone 53150 to 53650 for Bank Nifty Index
- Rising Support Channel Breakdown would act as a Resistance
- Resistance Zone earlier Support Zone at 54160 to 54660 for Bank Nifty Index
- Bank Nifty Index trending within the Support and Resistance Zone since last week
- Bearish Rounding Top acting as a resistance and again index closed below Resistance Zone
- Minor Gap Down Opening of Thursday last week closed, now Friday gap down needs a closure
#Nifty may see fall on Monday?Nifty appears to be in its minuette wave 4 and may resume its downtrend move on September 1 to complete wave 5.

IGL may come down!We may have a C wave of a flat pattern currently unfolding in IGL. It can witness a correction for some time.
**This is an educational market outlook, not investment advice. Please consult a SEBI-registered advisor before taking any investment decisions.**

BTCUSD Weekly – Supply Pressure vs Key Support (110K in Focus)On the weekly timeframe, BTC is trapped between major supply (117K–119K) and key support (110K–112K).
Supply Zone: Price has faced multiple rejections near 117K–119K, showing strong seller presence.
Order Block/Resistance: The yellow zone around 113K is acting as an active selling area, preventing BTC from reclaiming higher ground.
Support Zone: BTC is currently testing the 110K–112K support zone. If this level holds, we could see another attempt to reclaim 113K.
Scenarios:
1. Bullish Breakout (less likely unless strong volume appears):
Needs to reclaim 113K and break above 119K.
Target zone → 126K–134K.
Stop loss for longs → below 110K.
2. Bearish Breakdown (higher probability if 110K fails):
If 111K–110K zone breaks, BTC likely retests the 103K–106K demand zone.
If that fails → extended move possible toward 97K.
Stop loss for shorts → above 113.5K.
Bias: Neutral to Bearish unless BTC reclaims 113K with strong volume.

Nifty 50 spot 24,363.30 by the Daily Chart view - Weekly updateNifty 50 spot 24,363.30 by the Daily Chart view - Weekly update
- Support Zone 23850 to 24100 for Nifty Index
- Resistance Zone 24450 to 24700 for Nifty Index earlier Support Zone
- Bearish Rounding pattern top for Nifty 50 Index from ATH 26277.35 to 24073.90 diff 2,203 points
- Nifty 50 Index took reversal from 21964.60 just tad above from expected low of 21870 by 2203 points
- Bearish Rounding Top has repeated from the recent high of 25669.35 to 24473 having a difference of 1196 points
- *Will the same downfall behavior happen and see history repeated for Nifty 50 Index going down till 23276 and then reverse upside*
- *Stock Markets Domestically and Globally, are bearing the brunt of adversely affecting and negatively playing Tariff Tantrum Trumpet*

Bank Nifty spot 55004.90 by Daily Chart view - Weekly updateBank Nifty spot 55004.90 by Daily Chart view - Weekly update
- Fairly decent Support Zone 54160 to 54660 for Bank Nifty Index
- Current Resistance Zone 55050 to 55450 for Bank Nifty Index, earlier Support Zone
- Bearish Rounding Top pattern has sustained for Bank Nifty Index ATH to current Resistance Zone earlier a Support Zone
- Bearish Rounding Top from ATH 57628.40 ending 55149.30 by 2479 points of Bank Nifty index in active downplay mode
- *Will the Bank Nifty Index continue this breakdown journey from the active Resistance Zone and dive down further on too*
- *Stock Markets Domestically and Globally, are bearing the brunt of adversely affecting and negatively playing Tariff Tantrum Trumpet*
NIFTY Technical Breakdown – Rising Wedge Pattern🔻 NIFTY Technical Breakdown – Rising Wedge Pattern
The Nifty 50 has broken down from a rising wedge pattern on the daily timeframe, a bearish reversal formation that often signals distribution at the top.
📉 Key Observations:
Rising wedge breakdown after extended rally
RSI bearish divergence confirming weakness
MACD crossover turning negative
Volume gradually decreasing during the rise, indicating exhaustion
ADX flattening, showing weakening trend strength
📌 Support Levels to Watch:
23,783 – Key swing support
22,798 – Previous breakout zone
📌 Sectoral Rotation:
Defensive sectors like Pharma & FMCG are gaining strength
FII selling pressure, rising DXY, and global uncertainty continue to weigh on sentiment
⚠️ Outlook:
Caution warranted in the short term. Watch for sustained close below 24,900 for further downside confirmation. Macro and global cues to play a key role ahead.
💬 What’s your view on Nifty's near-term direction?
#Nifty50 #TechnicalAnalysis #RisingWedge #MarketOutlook #TradingView #ChartStudy #IndiaMarkets #BearishSetup #NiftyBreakdown #Puneet0130
Opening Range Breakdown – Intraday Bears’ Favorite Setup!Hello Traders!
Today, let’s explore one of the most reliable setups for intraday traders – the Opening Range Breakdown (ORB) . This strategy is widely used by professional traders to catch early downside momentum when the market shows weakness right after opening. If executed correctly, it offers quick profits and tight risk management. Let’s break down how it works and how to trade it with confidence.
What is Opening Range Breakdown (ORB)?
The ORB strategy focuses on the first 15 to 30 minutes of market open . The idea is to mark the high and low of this initial range and look for a breakdown below the low – which signals bearish pressure. This setup works best on volatile days or when there’s negative sentiment in global cues.
Mark the Opening Range:
Track the high and low of the first 15 or 30 minutes of the market open.
Wait for a Breakdown Candle:
Look for a strong bearish candle closing below the opening range low with rising volume.
Enter on Confirmation:
Take a short entry just below the breakdown candle with stop-loss above the opening range high.
Target Previous Day’s Support or VWAP:
Your exit target could be based on previous day’s support, VWAP, or risk-reward ratio like 1:2.
Volume Confirmation is Key:
Avoid low volume breakdowns. Strong volume is what separates real breakdowns from fake-outs.
Ideal Conditions for ORB
Gap Down Open or Weak Global Cues – ORB works well when sentiment is already negative.
High Beta Stocks or Indices like BankNifty – These respond sharply to breakdowns.
No Major Support Below the Breakdown Level – Clean charts increase trade reliability.
Risk Management Tip
Keep your position size small and risk predefined. Don’t chase entries. Let the candle confirm the breakdown and only then execute.
Conclusion:
ORB is a favourite among experienced traders due to its simplicity and effectiveness. If you’re an intraday bear looking for high-probability setups, Opening Range Breakdown is something you must master.
Have you used ORB before? Let me know your experience or results in the comments!
Shorting BTCUSD After Trendline Failure & Bearish RetestPlanning to short BTCUSD as price has rejected from the descending trendline resistance after breaking the minor ascending trendline support. The confluence of trendline rejection and bearish retest suggests potential downside continuation.
Entry Zone: ~107,300–107,350
Stop-Loss: Above 107,550 (recent high)
Target: 106,550 support area
Risk-to-Reward Ratio: ~1:2 (Min) 1:4 (Final Target)
Quote:
"Trendline confluence and failed bullish continuation often lead to deeper pullbacks."
📊 Summary of the Idea
✅Reason for Entry: Multiple rejections at trendline + structure breakdown.
✅Confirmation: Retest rejection candle.
✅Invalidation: A clean breakout and hold above the descending trendline.

Nifty - Inverted Cup & HandleNifty is creating a bearish Pattern,
Breakout Point is below 23260 level, a bounce should be seen till 23800-900 max from here.
Sell on Rise

ANGELONE - SHORT VIEWWe can look to Short Angel One near 3180 once there is a Negative Candle formation.
Targets are pretty good and risk reward is favourable too. Final Targets can be 2345.
Disclaimer: All information give is for educational purposes. Please consult your financial advisor before investing.
If you like such content please subscribe and share it with your Trader Friends or Family Members.
For more such content. Stay Tuned.

SELL SIlverWith reference to earlier shared ideas for silver, we continue to sell silver for a very short period of time in 15m timeframe.
A beautiful M-Pattern is formed and it's neckline is being tested.
Please follow the Targets given.
Do your analysis before taking a trade.
