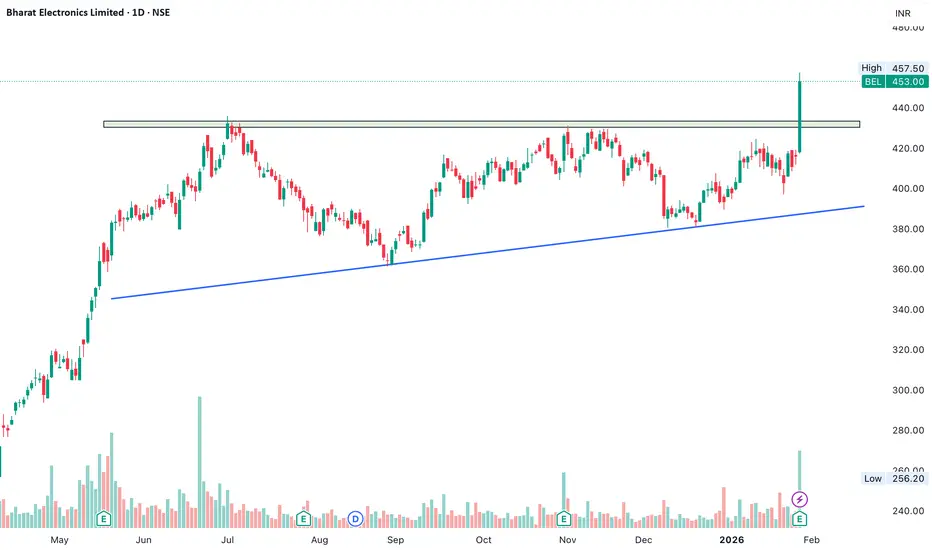
BEL : High-Quality Setup Despite Market Weakness📊 Technical Catalysts :
This is a perfect VCP structure with a clean breakout supported by strong volume, clearly indicating institutional interest. The stop loss is well placed below the basing formation, keeping risk structurally defined. The 20 EMA crossing above the 50 EMA further confirms a bullish trend shift.
EPS and Sales are continuously increasing for the past few quarter. The only dip was in June and this is not a stock specific event but a market wide scenario.
🏭 Fundamental Catalysts :
Good Results ; EPS and Sales are continuously increasing for the past few quarter. The only dip was in June and this is not a stock specific event but a market wide scenario.
Q3 Beat: Net profit grew 20.4% YoY (₹1,590 Cr), comfortably beating street estimates. Revenue execution is at an all-time high.
The EU FTA Factor: The "Mother of All Deals" signed on Jan 27 opens up a $750B market for Indian defense electronics. BEL is the primary beneficiary as it scales up exports to European nations looking to de-risk from China/Russia.
Budget 2026 Speculation: With the Union Budget on Feb 1, the market is front-running a likely increase in defense capital outlay.
Even though the broader market is showing signs of weakness, the confluence of strong technical structure, volume-backed breakout, moving-average crossover, and improving fundamentals provides enough confidence to take this trade, while still maintaining disciplined risk management with a standard 1% risk per trade.
📢📢📢
If my perspective changes or if I gather additional fundamental data that influences my views, I will provide updates accordingly.
Thank you for following along with this journey, and I remain committed to sharing insights and updates as my trading strategy evolves. As always, please feel free to reach out with any questions or comments.
Other posts related to this particular position and scrip, if any, will be attached underneath. Do check those out too.
Disclaimer : The analysis shared here is for informational purposes only and should not be considered as financial advice. Trading in all markets carries inherent risks, and past performance is not indicative of future results. It’s essential to conduct your own research and assess your risk tolerance before making any investment decisions. The views expressed in this analysis are solely mine. It’s important to note that I am not a SEBI registered analyst, so the analysis provided does not constitute formal investment advice under SEBI regulations.
BEL

Bharat Electronics Ltd (BEL) – Bullish Structure BreakoutNSE:BEL
🔹 Technical View
Price has decisively broken above a major supply / resistance zone (~₹428–432) after multiple rejections in the past.
Strong bullish momentum candle indicates institutional participation and demand dominance.
Previous resistance now likely to act as strong support on any pullback.
Structure shows higher highs & higher lows, confirming an ongoing uptrend.
Immediate levels to watch:
Support: ₹428–420
Upside potential: ₹460 → ₹480 (positional)
🔹 Volume & Price Action
Breakout supported by healthy volume expansion, validating the move.
No major selling pressure visible near breakout zone so far.
🔹 Fundamental View
BEL is a Navratna PSU and a key player in defence electronics.
Strong order book driven by:
Defence modernization
Indigenous manufacturing (Make in India / Atmanirbhar Bharat)
Consistent revenue visibility, healthy margins, and improving ROE.
Virtually debt-free balance sheet adds financial stability.
🔹 Future Growth Prospects
Long-term beneficiary of India’s rising defence spending.
Increasing focus on:
Radar systems
Electronic warfare
Missile & naval electronics
Export opportunities and private-defence collaboration act as additional growth triggers.
Well-positioned for sustainable compounding over the next few years.
🔹 Conclusion
Technically strong breakout + fundamentally robust business.
Suitable for positional & long-term investors on dips near support.
Trend remains bullish as long as price sustains above ₹420–428 zone.
==============
⚠️ Disclaimer:
==============
This content is shared strictly for educational and informational purposes.
We are not SEBI-registered investment advisors or analysts.
The views expressed are personal opinions, based on publicly available data and market observations.
Please consult a SEBI-registered investment advisor before taking any investment or trading decisions.
Any actions taken based on this content are entirely at your own risk and responsibility.
========================
Trade Secrets By Pratik
========================

BEL (Bharat Electronics) – Clean Breakout With Strong Momentum🟢 Simple Chart Explanation:
• BEL was moving in a healthy uptrend
• Price respected the rising trendline multiple times (buyers active)
• The ₹430–₹440 zone acted as a strong resistance earlier
• Today price gave a powerful breakout candle above this zone
• Breakout came with strong momentum, showing buyer strength
📌 Important Levels to Watch:
• New Support: ₹430–₹440
• Immediate Resistance: ₹460–₹470
• Trend Support: Rising trendline (blue line)
• Invalidation: Close below ₹425
💡 Price Action View:
• Resistance → Support flip confirmed
• Strong bullish candle near highs
• As long as price holds above breakout zone, trend remains bullish
📊 Bias:
• Bullish above ₹430
• Expect continuation or healthy consolidation before next move
⸻
⚠️ Disclaimer
This analysis is shared only for educational purposes.
I am not a SEBI-registered investment advisor.
This is not a buy or sell recommendation.
Trading and investing involve market risk.
Please do your own research or consult a SEBI-registered advisor before taking any decision.
⸻
❤️ If this chart helped you, do LIKE & SAVE it for future reference
(Daily breakout levels are very useful when saved 📌)
BUY TODAY SELL TOMORROW for 5%DON’T HAVE TIME TO MANAGE YOUR TRADES?
- Take BTST trades at 3:25 pm every day
- Try to exit by taking 4-7% profit of each trade
- SL can also be maintained as closing below the low of the breakout candle
Now, why do I prefer BTST over swing trades? The primary reason is that I have observed that 90% of the stocks give most of the movement in just 1-2 days and the rest of the time they either consolidate or fall
Trendline Breakout in BEL
BUY TODAY SELL TOMORROW for 5%

BEL Triangle & Flag BreakoutBEL is attempting breakout from Triangle and Bull Flag Pattern on 1D timeframe. Watch for closing at End of the Day. Watch for Earnings because this stock carries earnings risk.

BEL - STWP Equity Snapshot📊 STWP Equity Snapshot – Bharat Electronics Ltd (BEL)
(Educational | Chart-Based Interpretation)
Market Structure
BEL continues to trade in a structurally strong uptrend, characterized by higher highs and higher lows on the daily timeframe. Recent price action reflects consolidation after a sharp upward expansion, suggesting digestion of gains rather than distribution. The broader structure remains constructive, with price holding above key support zones and maintaining bullish alignment.
Demand–Supply Structure
Price has respected a well-defined demand zone in the 402–397 region, where buyers have consistently defended declines. The recent bullish reaction from this area indicates demand absorption and willingness to support price at higher value levels. Overhead supply is visible near recent highs, but selling pressure appears controlled, indicating healthy supply management rather than aggressive profit booking.
Key Levels – Daily Timeframe
Primary demand zones are placed near 409, followed by deeper structural support around 402–397. These zones represent areas where buyers have previously stepped in with conviction. On the upside, resistance and reaction zones are located near 421, 426, and 434, which may act as pause or acceptance areas during further upside attempts.
What the Chart is Saying
Momentum remains supportive, with RSI holding near 57–58, reflecting healthy strength without signs of exhaustion. Price continues to trade above key moving averages, reinforcing trend integrity. Volume participation remains above average during bullish candles, suggesting continuation interest rather than speculative activity.
CPR Impact
BEL is trading above the CPR pivot with a relatively narrow CPR structure, which generally supports directional continuation rather than range-bound behavior. Acceptance above the CPR zone indicates short-term bullish control. However, the projected CPR ahead appears wider, hinting at the possibility of brief consolidation before the next directional phase.
Additional Structure Observations
Recent pullbacks have been shallow and followed by strong recovery attempts, indicating dip-buying behavior. Short-term moving averages remain positively aligned, while the longer-term structure continues to slope upward. The absence of heavy selling volume during declines suggests effective absorption of supply. Overall, the structure supports continuation, subject to normal consolidation and acceptance checks.
Intraday Reference Levels (Structure-Based)
The 418 zone acts as the near-term balance area and remains the key intraday reference. Sustained holding above 418 keeps the structure stable and supports upside testing toward the 436–449 zone, which represents upside reaction areas where price may pause or require acceptance. On the downside, weakness below 418 increases risk toward the 402–397 demand zone, where intraday structure would be reassessed. These levels define intraday risk versus opportunity, not directional certainty.
Swing Reference Levels (Hybrid Model | 2–5 Days)
From a short-term swing perspective, BEL remains within a positive structural framework as long as price holds above the 402–397 primary demand zone. If strength sustains, the 449–473 zone emerges as a higher range-expansion reference area over the coming sessions. Conversely, sustained acceptance below 397 would elevate downside risk and indicate a shift from consolidation toward deeper corrective behavior. Until such failure occurs, consolidation above demand should be viewed as constructive.
Final Outlook (Condition-Based)
Momentum remains strong and supportive of the prevailing structure. The trend is clearly up, with buyers maintaining control above key demand zones. Risk remains elevated due to proximity to resistance and recent price expansion, while volume stays moderate and healthy, supporting continuation rather than exhaustion.
💡 STWP Learning Note
Strong trends often pause through consolidation, not reversal.
Respect structure and let price confirm continuation.
📘 STWP Approach
Observe price. Respect risk.
Trade structure, not prediction.
⚠️ Disclaimer
This post is shared strictly for educational and informational purposes.
It is not investment advice or a recommendation.
Please consult a SEBI-registered financial advisor before making any financial decision.
🚀 Stay Calm. Stay Clean. Trade With Patience.
Bharat Electronics Ltd. - Stock AnalysisDate : 16-Sep-2025
LTP : Rs. 402.90
Technical View:
• NSE:BEL is in primary uptrend since Apr 2025 and was recently going through it's secondary downtrend within primary uptrend.
• From it's all time high of 436 on 1-Jul-2025, it has retraced 17% to 361.20 on 28-Aug-2025 which is also close to Fibonacci retracement level 0.382 placed at 367.00.
• NSE:BEL has breakout from it's secondary downtrend with higher than average volume on 10-Sep-2025. Volume has also increased in last few sessions.
• NSE:BEL has closed above 20 DEMA and 50 DEMA on 10-Sep-2025 and is trading above 20 DEMA and 50 DEMA since last few sessions. 20 DEMA has also crossed over 50 DEMA on 16-Sep-2025.
• MACD has crossed over 0 and entered into bullish zone. It is trading at 2.58.
• RSI has crossed over 50 and trading in buy zone at 66.02.
• Looking good to start a new swing from here.
• Resistance Levels : (R1) Rs. 436 --> (R2) Rs. 480
• Support Level : Rs. 361
If you have liked this analysis, please Like/Boost this idea and follow me for more ideas.
Disclaimer : I am not a SEBI registered analyst/consultant and not recommending anyone to take any BUY or SELL position in stock market. Investing in stock market is risky and one should do a self analysis and validation before investing in stock market. My ideas are published for learning purpose only and are available to everyone at no cost/charge.

Nibe Ltd – Elliott Wave UpdateNibe Ltd – Elliott Wave Update
Nibe Ltd has reversed decisively from the 78.6% Fibonacci retracement, completing a textbook ABC corrective structure. The reversal was accompanied by clear bullish divergence on RSI and MACD, confirming exhaustion of the corrective phase.
Following the reversal:
Wave 1 of the new impulsive structure is complete
Wave 2 has unfolded as a shallow, time-wise correction
Price is now trading in Wave 3, supported by expanding momentum and rising volume
As long as price holds above the recent swing low (~₹1,030), the impulsive structure remains valid. Momentum indicators continue to support further upside, suggesting the trend is in an acceleration phase rather than exhaustion.
Trend Bias: Bullish
Structure: Impulsive (Wave 3 in progress)
Minimum Target: ₹1,700
Invalidation Level: Below the Wave-2 low

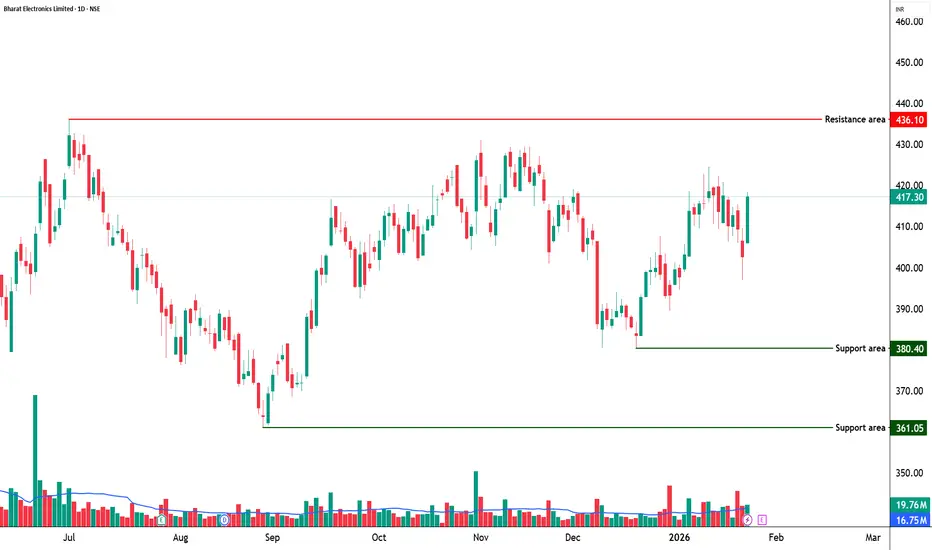
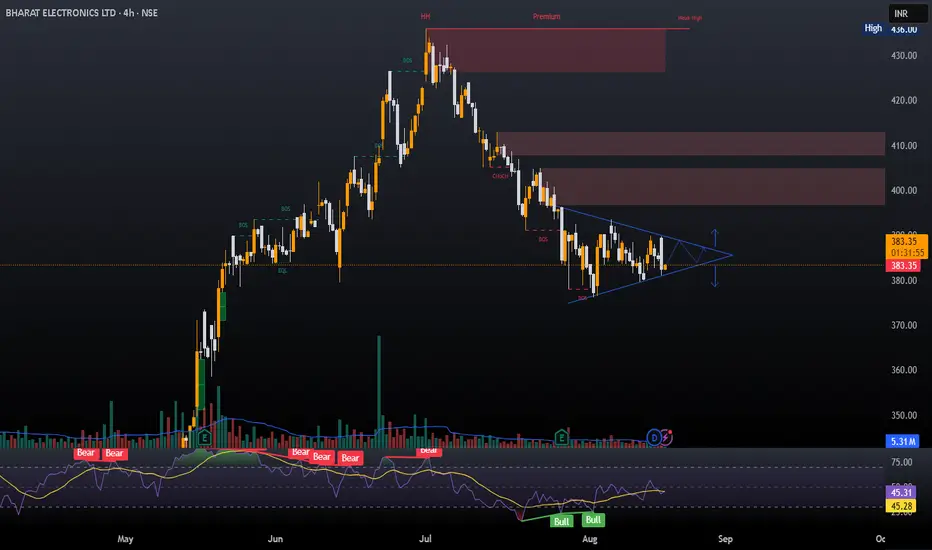
BEL – Trendline Breakdown & Supply Zone Rejection | Bearish SetuBEL has rejected strongly from the higher-timeframe supply zone around ₹425–₹430, followed by a clean trendline breakdown. This breakdown signals weakening bullish momentum and opens the door for a deeper correction.
📌 Key Highlights
Strong rejection from the major supply zone.
Clear trendline break, indicating a shift in structure.
Price currently hovering near ₹408–₹410 support.
Expecting a pullback before continuation.
🎯 Entry Plan (Breakdown + Retest)
🔽 Preferred Entry Model
1. Breakdown:
Price breaks below the minor structure at ₹406–₹408 with a strong bearish candle.
2. Retest:
Wait for price to pull back toward ₹408–₹410 (previous support → now resistance) OR a retest of the broken trendline.
3. Entry Trigger:
Enter short only after a bearish rejection (wick rejections / bearish engulfing / breakdown of retest low).
📍 Ideal Entry Zone:
₹400 – ₹403
🎯 Targets
TP1: ₹395
TP2: ₹382
Final Target (HTF Demand): ₹360 – ₹365
❌ Invalidation
Setup invalid if BEL reclaims ₹425 and sustains above the supply zone.
📈 Bias
Bearish as long as the price stays below the breakdown zone and the trendline.
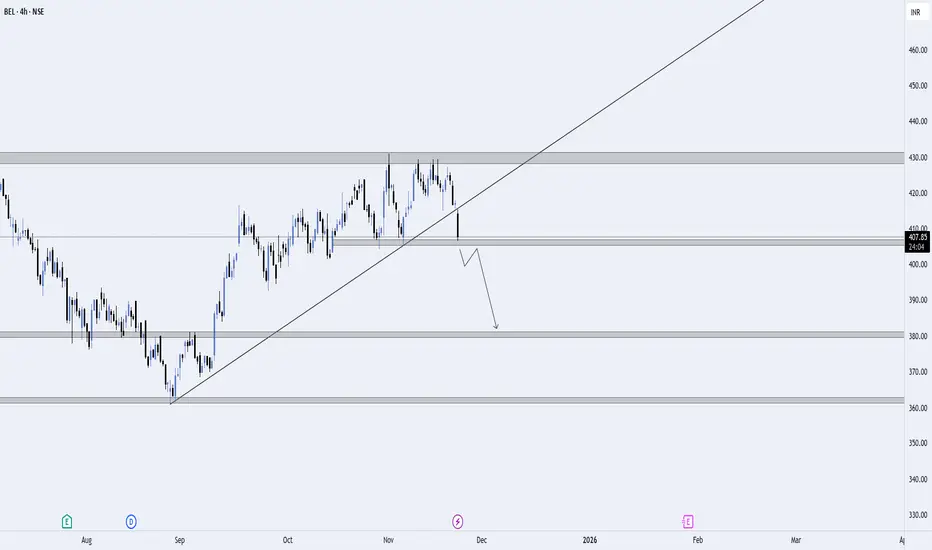
BEL (Bharat Electronics Ltd) – Ascending Triangle Setup 🟢 BEL (Bharat Electronics Ltd) – Ascending Triangle Setup | Breakout Watch 🚀
📊 Chart Setup:
BEL is forming an ascending triangle pattern on the daily chart — a bullish continuation setup. The breakout level is around ₹435. Confirmation will come with a daily close above ₹435.
🔹 Targets: ₹455 / ₹480
🔹 Support: ₹408
🔹 Pattern: Ascending Triangle (yet to break)
🔹 View: Wait for confirmation candle close above the resistance zone for sustained momentum.
💼 Fundamental Update – Q2 FY25 Results 🛰️
BEL posted strong Q2 numbers beating estimates across all metrics:
• Net Profit: ₹1,285 Cr ↑ vs Est ₹1,143 Cr — Beat
• Revenue: ₹5,764 Cr ↑ vs Est ₹5,359 Cr — Beat
• EBITDA: ₹1,695 Cr ↑ vs Est ₹1,482 Cr — Beat
• EBITDA Margin: 29.42% ↑ vs Est 27.7% — Beat
➡️ Strong all-round performance with robust revenue growth and healthy margins, adding confidence to the bullish setup.
📈 For educational purpose only. Not a buy/sell recommendation.

BEL I think here it create small strong base ,with good accumulation volume
Comapare to nifty 50 index stock more strong ,
Here risk 6% if price 1day close below 392 exit .
Target 20% after 50% book half trailing with ema

BEL (Bharat Electronics Ltd) – Technical SetupPattern: Symmetrical Triangle breakout visible on the daily chart.
Breakout Confirmation: Price has moved above the triangle resistance trendline with rising volume.
Targets (Fibonacci-based):
1st Target: ₹435
2nd Target: ₹480
3rd Target: ₹512
Stoploss: ATR-based, below support zone (~₹395–₹400).
---
🔎 Multi-Timeframe Check
Daily: Strong breakout setup with RSI > 60, MACD crossover supportive.
Hourly: Needs sustained close above breakout for confirmation.
Weekly: Still consolidating → needs alignment for a stronger positional view.
---
🌍 Macro Drivers
Sector Theme: Defense + Infrastructure remain in focus.
Policy Tailwind: “Make in India” defense push supportive for long-term growth.
Global Context: Rising defense spending globally adds sentiment support.
---
📝 Reflection / Post Context
"BEL is showing a symmetrical triangle breakout on the daily chart, backed by volume and positive momentum. While hourly/weekly charts are yet to fully align, the macro backdrop of defense and infrastructure support the bullish bias. ATR-based stoploss below ₹400, with upside targets at ₹435, ₹480, and ₹512."

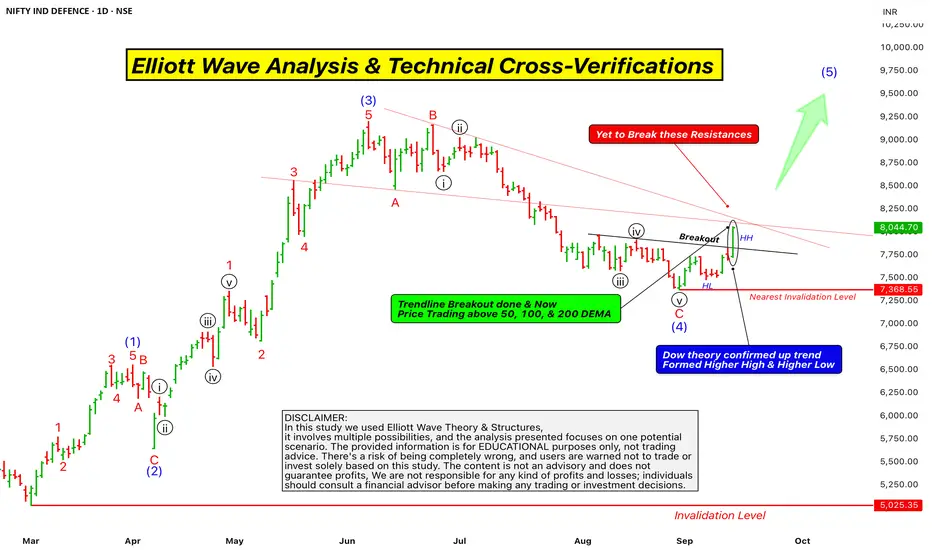
Elliott Wave Analysis & Technical Cross-VerificationsHello Friends, Welcome to RK_Chaarts,
Today, we're going to learn how to validate our Elliott Wave analysis by identifying additional factors that support our directional bias. Once we've plotted our Elliott Wave counts and identified a direction, we want to confirm whether other technical indicators and patterns align with our analysis. This helps strengthen our conviction in our directional bias and provides additional confidence in our trading decisions. Today, we'll explore some key points, including Elliott Wave theory, Exponential moving averages, Trend line breakouts, and Invalidation levels, as well as projected targets. And please note that this post is shared solely for educational purposes. It is not a trading idea, tip, or advisory. This is purely an Educational post.
Elliott Wave Theory structure & wave Counts
Here chart we are using Nifty India Defence sector, which is an index chart. We are analyzing it using Elliott Wave theory. It's very clear that from the March 2025 bottom, we've identified a clear Wave (1) Wave (2) Wave (3) and Wave (4) and now we've started Wave (5) of Intermediate degree in Blue.
Projections of wave (5)
According to the theory, the projected target for Wave (5) is typically between 123% to 161.8% of the length of Wave (4). So, we can at least assume that the price will reach 123% of Wave (4)’s length, and the price will move higher from here.
Trendline Breakout
The trend line breakout also confirms this. Since Wave (4) moved downwards, Wave (5) should move upwards, indicating a potential upward movement in price. This is a positive signal and a possibility.
Dow Theory confirmation of Trend changed
Additionally, we can see that in the daily time frame, the price has recently completed Wave (4) and formed a higher high, followed by a higher low, and then another higher high, along with a trend line breakout, which we've marked with a rounded ellipse on candle on the chart.
According to Dow theory, this formation of higher highs and higher lows, along with the trend line breakout, indicates that the index has the strength to break through resistance. These two factors strongly support our Elliott Wave projection, which suggests that the price will move upwards. The chart is looking bullish, indicating that a swing has been activated upwards from here.
Exponential Moving Averages
Furthermore, we can see that the price is trading above the 50-day exponential moving average (EMA) in the daily time frame, as well as above the 100-day EMA and the 200-day EMA. These three EMAs are major indicators, and the price is sustaining above all of them. This is also a very good positive sign that supports our view and this scenario.
Supporting Indicators
MACD
RSI
Some Hurdles to cross yet
Finally, we can see that the Zero B trend line, which is coming down from the top, has not been crossed by the price yet, and there has been no breakout. Additionally, we have drawn a trend line connecting the high of the third wave and the low of the fourth wave, which initially acted as resistance and later as support. This trend line is also approaching the same level as the Zero B trend line. So, we have two resistances converging at the same point, which the price has yet to break out of.
This could potentially be a hurdle, and it's possible that according to the Elliott Wave count, Wave (5) will arrive with five sub-divisions, which could lead to a retest of the previous trend line or a Retracement before moving further upwards.
Invalidation Level
According to Elliott Wave theory, the nearest invalidation level is the low of Wave (4), which is currently at 7368, and this level should not be breached. If it is, it will lead to a lower low, which would be an invalidation of the Elliott Wave count.
Overall, the chart of this index looks very promising and bullish. As we all know, the market can be unpredictable, but if this invalidation level is not triggered and the price doesn't break down, then the chart may move upwards with strength. This entire analysis that we discussed is for the Nifty India Defense index chart. Please note that this is not a trading tip or advice, but rather an educational perspective that we shared. Also, keep in mind that the Nifty Defense index is not tradable, but it does provide insight into the market's direction.
This post is shared purely for educational purpose & it’s Not a trading advice.
I am not Sebi registered analyst.
My studies are for educational purpose only.
Please Consult your financial advisor before trading or investing.
I am not responsible for any kinds of your profits and your losses.
Most investors treat trading as a hobby because they have a full-time job doing something else.
However, If you treat trading like a business, it will pay you like a business.
If you treat like a hobby, hobbies don't pay, they cost you...!
Hope this post is helpful to community
Thanks
RK💕
Disclaimer and Risk Warning.
The analysis and discussion provided on in.tradingview.com is intended for educational purposes only and should not be relied upon for trading decisions. RK_Chaarts is not an investment adviser and the information provided here should not be taken as professional investment advice. Before buying or selling any investments, securities, or precious metals, it is recommended that you conduct your own due diligence. RK_Chaarts does not share in your profits and will not take responsibility for any losses you may incur. So Please Consult your financial advisor before trading or investing.
BEL Stock Trade Above 50 EMABEL Stock show technically strength
If you want to plan a trade in BEL stock here, then we will take entry around 382. Here we will keep Stop loss 370 and the target is around 430 but what is this target, it will take some time. It will not come in 1, 2 or 7 days. What do we have to do in this, we will have to give a month's time. Okay. If you enter the trade, then you must do your analysis first.

BEL Triangle PatternA long position can be taken in BEL if it breaks out this triangle pattern.
Entry- 383 - 381
Stop Loss- 377
Target- 390, 395, 400
Reason- After a good consolidation BEL has made a triangle pattern. A breakout from the pattern can give a good move.
Disclaimer- This is just for educational purpose. Please take advice before making any decision.
Jai Shree Ram.
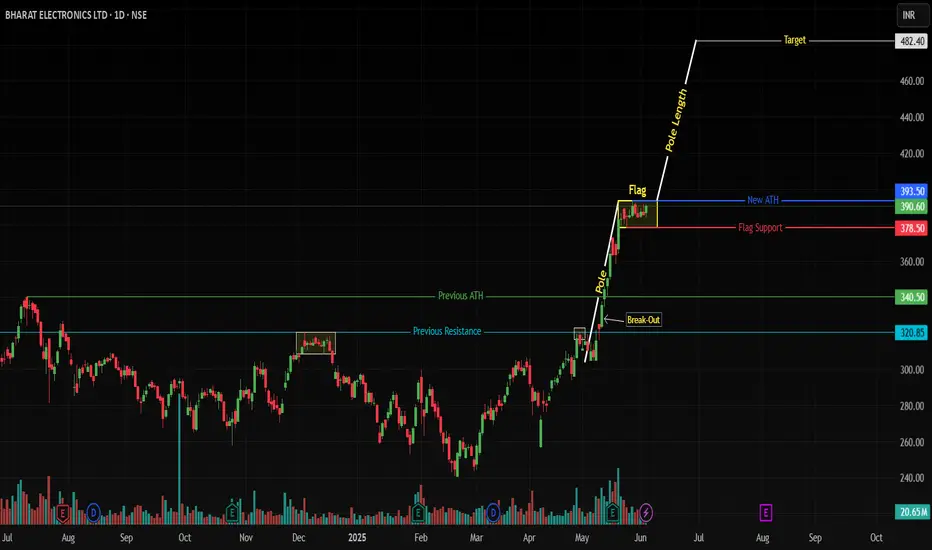
How to Trade ATH Stocks: Harness Explosive Trends with ADX !(BEL Case Study)
NSE:BEL (Daily) - Bull Flag at All-Time Highs
📈 Key Observations
ATH Breakout Confirmed:
Price smashed through ₹340.50 previos ATH, hitting a historic high of ₹393.50.
Consolidation in a tight bull flag (₹378.50–393.50) after a 28.97% surge – classic bullish continuation setup.
ADX: Your Trend Compass 🧭
ADX at 43.95 signals a powerful, directional trend (Readings >25 = strong trend; >40 = explosive momentum).
Ignore oscillator noise: Trends trump RSI/MACD in parabolic moves.
Pattern > Oscillators:
Bull Flag Priority: The pattern’s integrity (lower volume consolidation) outweighs short-term RSI(79)/MACD wobbles.
🚀 Trade Strategy: Trend-First Framework
✅ Entry & Targets
Trigger: Daily close above ₹393.50 (flag resistance).
Add: Retest of ₹393.50 as support.
Targets:
Short-term: ₹420 (5% above ATH)
Measured Move: ₹482 (ATH + pole height: 393.50 + 88.20)
⚔️ Stop-Loss
Conservative: ₹378.50 (flag low breach).
Aggressive: ₹385 (tight stop, honors consolidation structure).
📊 Position Sizing
Risk ≤1% capital per trade.
Reward/Risk Ratio: 4:1 (₹482 target vs. ₹378.50 stop).
💡 Why ADX Trumps RSI/MACD at ATHs
RSI/MACD are lagging in strong trends:
RSI overbought ≠ reversal – it’s fuel for momentum stocks.
MACD crosses often "whipsaw" in high-ADX environments (BEL’s ADX >40 invalidates bearish MACD signals).
ADX is proactive:
"Trends persist until ADX rolls below 30" – Focus on price, not oscillator fears.
🌐 Sector & Fundamental Tailwinds
Defense Sector Strength: India’s capex boost; BEL’s order book increasing.
Institutional Conviction: FIIs increasing stake.
🛡️ Risk Management Checklist
✅ Trade only on confirmed close above ATH.
✅ Use ADX >40 as a momentum green light.
✅ Trail stops at 20-DMA (₹365) once +10% profit.
Chart Markup:
Blue line: Bull flag Resistance at ₹393.50.
Red Line: Bull Flag Support ₹378.50
ADX(14) subchart with 40+ threshold highlighted.
💎 Final Thought: ATH breakouts are trend accelerators, not tops. BEL’s bull flag + ADX >40 frames a high-probability continuation play. Stick with the trend until ADX says otherwise.
Boost this idea if you’re tracking BEL’s breakout!
Follow for high-probability ATH trade setups.
⚠️ Disclaimer
"This is NOT financial advice. Trade at your own risk. Past performance ≠ future results. Always conduct independent research and consult a SEBI-registered advisor. The author holds no position in BEL at time of publication."
BEL hits key level, a cool off ahead before next leg up?Bharat Electronics is unfolding a clean impulse. After completing Wave ii at 304.80, price surged into Wave iii, which has now reached the 1.618 Fibonacci extension near 410. Interestingly, while price made new highs, RSI is showing early signs of bearish divergence, hinting at a possible Wave iv pullback. The retracement zone between 385 and 370 may act as support before the uptrend resumes. As long as price holds above 319, the bullish structure remains valid.
Disclaimer:
This analysis is for educational purposes only and does not constitute investment advice. Please do your own research (DYOR) before making any trading decisions.

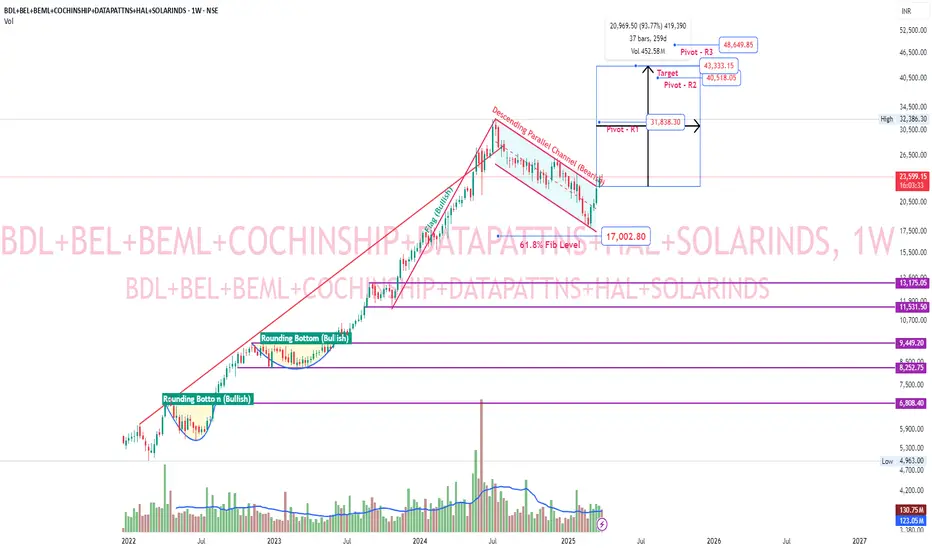
Aerospace & Defence bullish flag breakoutCreated custom index with following scrips. BDL, BEL, BEML, COCHINSHIP, DATAPATTNS, HAL, SOLARINDS. These are some major aerospace-defence companies. This custom index gave a bullish flag breakout. Huge upside potential based on flag pole as target. Pivot R1 itself has approximately 34.5% upside potential.
BEL (Bharat Electronics Ltd.) Cup and Handle pattern DailyHere's the **analysis** for **BEL (Bharat Electronics Ltd.)**
Need to close above 306 for confirmation
---
### 🏭 **BEL (NSE) Technical Analysis**
1. **Pattern Observed:**
- Clear **Cup and Handle** pattern.
- Breakout happening **around ₹305**.
- Also, a **falling channel breakout** is observed (yellow parallel lines).
2. **Key Levels:**
- **Breakout Zone:** ₹305.
- **Current Price:** Around ₹305.
- **Resistance Levels:**
- ₹340 (intermediate resistance — recent swing high).
- **Major Target:** ₹369-370 zone (based on the cup height projection).
- **Support Levels:**
- ₹290 (handle low).
- ₹265-270 (channel mid-support).
3. **Volume Confirmation:**
- Good volume surge during the breakout, confirming buyer strength.
4. **Target Projection:**
- Height of Cup = ~₹64.
- Projected Target = Breakout Price + Height
- ₹305 + ₹64 ≈ **₹369** (aligned with your target).
5. **Trend Strength:**
- Breakout from a **long consolidation range** (almost a year).
- Momentum could stay strong if ₹305 holds.
---
### 📈 **Summary**
| Aspect | Detail |
|:------|:-------|
| Pattern | Cup and Handle + Falling Channel Breakout |
| Breakout Level | ₹305 |
| Immediate Target | ₹340 |
| Major Target | ₹369-370 |
| Support | ₹290, ₹270 |
| Bias | **Strong Bullish** |
---
### 📋 **Trading Idea (Example Setup)**
- **Entry:** ₹305-310
- **Stop Loss:** ₹288 (below handle low)
- **Target 1:** ₹340
- **Target 2:** ₹369
Risk-Reward is favorable (approx 1:3).
---
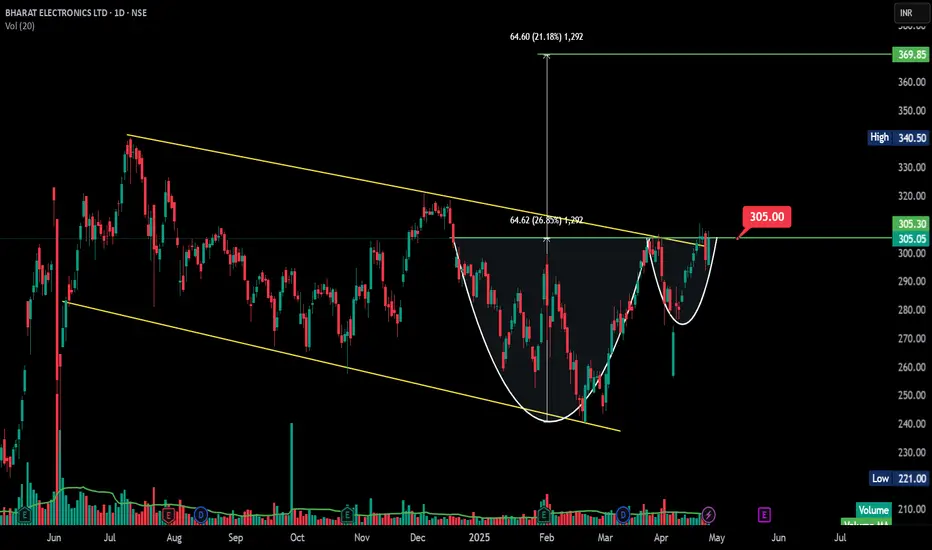
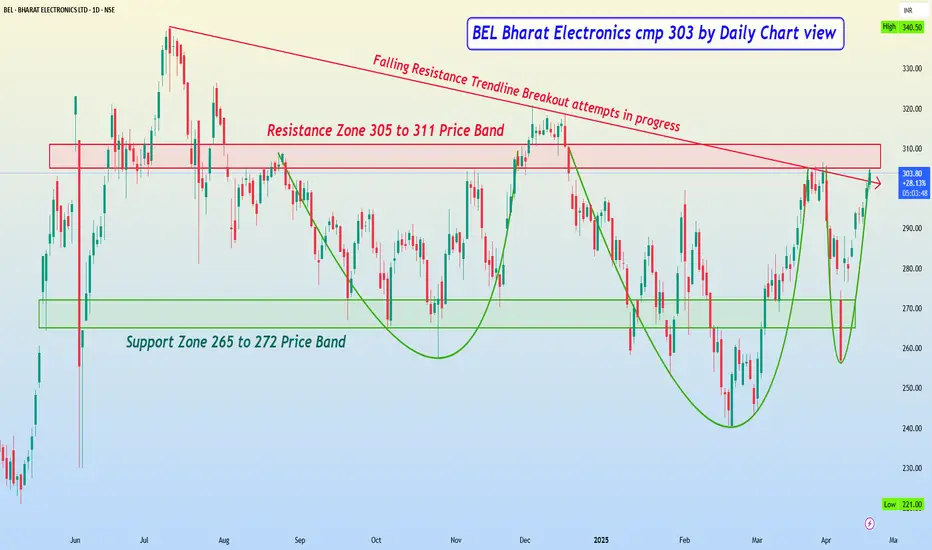
Bharat Electronics cmp 303 by Daily Chart viewBEL Bharat Electronics cmp 303 by Daily Chart view
- Support Zone 265 to 272 Price Band
- Resistance Zone 305 to 311 Price Band
- Falling Resistance Trendline Breakout attempts in progress
- Bullish Rounding Bottoms repeated with a false breakout in between
- Resistance Zone neckline acting as a strong hurdle to pass for fresh breakout
Bullish BELBuying prices and targets are all mentioned in the chart.
Price breaking out at 284 and taking support at 284.50 will validate the buying price.
Price if rejecting 284 will invalidate the buying bias.

BEL - TrappedCurrently - Sideways
Phase Accumulation / Distribution ?
Hurdles post break out / break down 325 / 305 Targets post break out / break down 340 / 290
Plain n simple analysis

Investment Idea Bharat Electronics Limited (BEL)
BEL stock has been showing a strong uptrend over recent months, driven by consistent earnings growth and strategic government defense orders
BEL, a leader in defense electronics, is perfectly positioned to benefit from India’s growing focus on self-reliance in defense manufacturing. With a strong order book, cutting-edge R&D, and robust financials, BEL offers:
✔️ Consistent Growth: Backed by government initiatives and modernization needs.
✔️ Dividend Returns: A track record of rewarding shareholders.
✔️ Long-Term Potential: Expanding into new markets like AI and space technologies.
Invest in BEL today and watch your portfolio grow with India’s defense dreams! 🌟
#BEL #LongTermInvestment #StockMarket
