BTC Monthly Forecast — January 2026Current bias: Price is approaching the equilibrium zone from below.
This is an upside attempt only if equilibrium is reclaimed and held. Until then, it’s still a test into supply.
Key zone to reclaim: 95,187–95,242 (equilibrium base + lower rail)
Next confirmation above: 99,039 (equilibrium mid)
1) Bull Case — “Acceptance above equilibrium”
Trigger: Hold above 95,242 and keep 95,187 defended
Targets:
99,039
102,891
102,946
Stretch (only if momentum persists): 103,000
2) Bear Case — “Rejection at equilibrium / Failed reclaim”
Trigger: Rejection at 95,187–95,242 and acceptance back below 95,187
Targets:
87,594
87,539
Extension: 79,890 only in a true unwind
Invalidation
Long thesis weakens on acceptance back below 95,187
Short thesis weakens on acceptance above 99,039 (then 102,891 becomes the next magnet)
Beyond Technical Analysis

NIFTY Analysis for 06th JAN 2026: IntraSwing Spot levels❇️ NIFTY Analysis for 06th JAN 2026: IntraSwing Spot levels❇️
🚀Follow GIFTNIFTY Post for NF levels
💥Level Interpretation / description:
L#1: If the candle crossed & stays above the “Buy Gen”, it is treated / considered as Bullish bias.
L#2: Possibility / Probability of REVERSAL near RLB#1 & UBTgt
L#3: If the candle stays above “Sell Gen” but below “Buy Gen”, it is treated / considered as Sidewise. Aggressive Traders can take Long position near “Sell Gen” either retesting or crossed from Below & vice-versa i.e. can take Short position near “Buy Gen” either retesting or crossed downward from Above.
L#4: If the candle crossed & stays below the “Sell Gen”, it is treated / considered a Bearish bias.
L#5: Possibility / Probability of REVERSAL near RLS#1 & USTgt
HZB (Buy side) & HZS (Sell side) => Hurdle Zone,
*** Specialty of “HZB#1, HZB#2 HZS#1 & HZS#2” is Sidewise (behaviour in Nature)
Rest Plotted and Mentioned on Chart
Color code Used:
Green =. Positive bias.
Red =. Negative bias.
RED in Between Green means Trend Finder / Momentum Change
/ CYCLE Change and Vice Versa.
Notice One thing: HOW LEVELS are Working.
Use any Momentum Indicator / Oscillator or as you "USED to" to Take entry.
⚠️ DISCLAIMER:
The information, views, and ideas shared here are purely for educational and informational purposes only. They are not intended as investment advice or a recommendation to buy, sell, or hold any financial instruments. I am not a SEBI-registered financial adviser.
Trading and investing in the stock market involves risk, and you should do your own research and analysis. You are solely responsible for any decisions made based on this research.
"As HARD EARNED MONEY IS YOUR's, So DECISION SHOULD HAVE TO BE YOUR's".
Do comment if Helpful .
Do Comment for In depth Analysis.
❇️ Follow notification about periodical View
💥 Do Comment for Stock WEEKLY Level Analysis.🚀

GBPJPY sell active setup GBPJPY as expected running check my previous idea 💡 I link to this, TP 🎯 missed still struggling possible TP let's see 📈📉

Marico LongMarico has been consolidating on the daily chart for quite a while. With volumes showing contraction and the price staying in the same range. Expect the stock to move higher from here.

SPY — Weekly Map (5–10 Jan)Here's this week's levels for SPY -
1) Bull Case — “Acceptance above equilibrium”
Trigger: Hold above 681 and reclaim 685
Targets: 687 → 690
Stretch (only if momentum persists): 696
2) Bear Case — “Rejection at equilibrium / Failed reclaim”
Trigger: Lose 681 (acceptance back below equilibrium) and lose 676
Targets: 678 → 672
Extension: 669 only in a true unwind
Invalidation
Long thesis weakens on acceptance back below 681
Short thesis weakens on acceptance above 685

HDFCAMC Channel Structure – Watching price acceptance key levelHDFCAMC has been moving inside a well-defined descending channel, respecting both the upper resistance and lower support trendlines.
Recently, price attempted to reclaim an important horizontal level inside the channel. Instead of an impulsive move, the stock is now pausing and stabilizing above this area, which is a healthy behavior from a price-action perspective.
Key observations:
Clear channel structure controlling the trend
Price holding above a minor resistance-turned-reference zone
No aggressive rejection so far — suggesting balance and participation
Volume remains steady, supporting controlled price movement
At this stage, there is no urgency. The focus is purely on how price behaves and settles above this zone before any directional expansion.
As always — price leads, we follow.

BSE: Strong Breakout Followed by Healthy ConsolidationAfter a decisive breakout, the stock moved into a healthy consolidation phase. Instead of retracing deeply, price respected the breakout level and started forming a well-defined base support, indicating acceptance at higher prices.
The consolidation is controlled and structured, with price compressing inside a downward-sloping range while holding above the key horizontal level. This behavior often reflects absorption of supply and digestion of prior gains, rather than weakness.
Overall, the structure remains intact as long as the base support holds. This is a classic example of price stabilizing after expansion, offering clarity purely from price and structure, without relying on indicators.

CHOLAHLDNG: Price Compression Under a Falling TrendlineCHOLAHLDNG is currently trading inside a well-defined compression structure. Price continues to respect a falling trendline on the upside, while the downside is being supported by a stable demand zone.
Multiple attempts to move higher have been capped by the trendline, yet sellers have not been able to break the base decisively. This behavior shows balance and absorption, not distribution.
Key observations from pure price action:
Lower highs confirm supply pressure
Flat support indicates buyer participation
Volatility is contracting, signaling compression
This is a wait-and-watch structure, where price action around the trendline and support will provide clarity. No indicators needed — the structure itself defines risk and context.

TFCI LTD. (Keep on radar)📊 TFCI – HTF Confluence Based Analysis (FVG + Fibonacci + RSI)
This analysis is based on historical price behavior, Fibonacci retracement, Fair Value Gap (FVG), and RSI mean-reversion characteristics.
🔹 Key Observations
1️⃣ RSI Behavior (Trend Context)
Historically, this stock has respected RSI 50–51 zone as a mean support in bullish phases.
RSI has reacted multiple times from this level, indicating trend continuation behavior, not exhaustion.
RSI here is used as a context filter, not a standalone buy signal.
2️⃣ Fibonacci Retracement (Value Zone)
In past impulsive moves, price has consistently reacted from the 0.50–0.618 retracement zone.
This zone represents a healthy pullback rather than trend reversal.
Current retracement is approaching the same historical value area.
3️⃣ Fair Value Gap (FVG)
A bullish FVG is present in the same price region.
Price is revisiting this imbalance after a strong impulsive move.
FVG + Fib overlap increases the probability of institutional interest / reaction.
🔹 Confluence Area
📌 FVG + Fibonacci 0.50–0.618 + RSI ~50
This overlap creates a high-probability reaction zone, provided price confirms via structure.
🔹 Trade Plan Logic (Execution Based)
Bias: Bullish as long as HTF structure holds
Zone: FVG overlapping with 0.50–0.618 Fib
Confirmation Required:
Structure shift on Daily or Hourly TF
Higher low / bullish engulfing / reclaim of minor resistance
RSI Role: Should hold near or above 50 during confirmation
⚠️ No aggressive entries without confirmation.
🔹 Invalidation
Sustained acceptance below the FVG + 0.618 Fib
Loss of higher-low structure on HTF
🧠 Conclusion
This is a confluence-based setup, not a prediction.
If price confirms strength inside the value zone, the risk–reward becomes favorable.
Otherwise, patience is required until structure validates the thesis.
I am not a SEBI Registered. This analysis is purely for educational purposes only.
If you gain some learning from this chart, then please like this post for more reach & also do comment if you have any questions regarding this.

BTCUSD (ONDA) IntraSwing Levels For 05thd- 06th JAN2026(3.30 am)🚀Follow GIFTNIFTY Post for NF levels
💥Level Interpretation / description:
L#1: If the candle crossed & stays above the “Buy Gen”, it is treated / considered as Bullish bias.
L#2: Possibility / Probability of REVERSAL near RLB#1 & UBTgt
L#3: If the candle stays above “Sell Gen” but below “Buy Gen”, it is treated / considered as Sidewise. Aggressive Traders can take Long position near “Sell Gen” either retesting or crossed from Below & vice-versa i.e. can take Short position near “Buy Gen” either retesting or crossed downward from Above.
L#4: If the candle crossed & stays below the “Sell Gen”, it is treated / considered a Bearish bias.
L#5: Possibility / Probability of REVERSAL near RLS#1 & USTgt
HZB (Buy side) & HZS (Sell side) => Hurdle Zone,
*** Specialty of “HZB#1, HZB#2 HZS#1 & HZS#2” is Sidewise (behaviour in Nature)
Rest Plotted and Mentioned on Chart
Color code Used:
Green =. Positive bias.
Red =. Negative bias.
RED in Between Green means Trend Finder / Momentum Change
/ CYCLE Change and Vice Versa.
Notice One thing: HOW LEVELS are Working.
Use any Momentum Indicator / Oscillator or as you "USED to" to Take entry.
⚠️ DISCLAIMER:
The information, views, and ideas shared here are purely for educational and informational purposes only. They are not intended as investment advice or a recommendation to buy, sell, or hold any financial instruments. I am not a SEBI-registered financial adviser.
Trading and investing in the stock market involves risk, and you should do your own research and analysis. You are solely responsible for any decisions made based on this research.
"As HARD EARNED MONEY IS YOUR's, So DECISION SHOULD HAVE TO BE YOUR's".
Do comment if Helpful .
Do Comment for In depth Analysis.
❇️ Follow notification about periodical View
💥 Do Comment for Stock WEEKLY Level Analysis.🚀

USDCHF sellCHF futures hit supply zones dollar 💵 is also seems weak so highly posible setup let's see how it goes like 📉📈

GBPJPY SellExpecting JPY index correction towards upside as well GBP futures are weak it's highly posible let's see 📈📉

Gold Key zones for Downtrend I think 🤔 gold is retreat from my entry key zones due to its correction I expecting one more push towards downside then we plan next setup let's see how it works like 📉📈

XAUUSD (ONDA) IntraSwing Levels For 05th - 06th JAN2026(3.30 am)💥Level Interpretation / description:
L#1: If the candle crossed & stays above the “Buy Gen”, it is treated / considered as Bullish bias.
L#2: Possibility / Probability of REVERSAL near RLB#1 & UBTgt
L#3: If the candle stays above “Sell Gen” but below “Buy Gen”, it is treated / considered as Sidewise. Aggressive Traders can take Long position near “Sell Gen” either retesting or crossed from Below & vice-versa i.e. can take Short position near “Buy Gen” either retesting or crossed downward from Above.
L#4: If the candle crossed & stays below the “Sell Gen”, it is treated / considered a Bearish bias.
L#5: Possibility / Probability of REVERSAL near RLS#1 & USTgt
HZB (Buy side) & HZS (Sell side) => Hurdle Zone,
*** Specialty of “HZB#1, HZB#2 HZS#1 & HZS#2” is Sidewise (behaviour in Nature)
Rest Plotted and Mentioned on Chart
Color code Used:
Green =. Positive bias.
Red =. Negative bias.
RED in Between Green means Trend Finder / Momentum Change
/ CYCLE Change and Vice Versa.
Notice One thing: HOW LEVELS are Working.
Use any Momentum Indicator / Oscillator or as you "USED to" to Take entry.
⚠️ DISCLAIMER:
The information, views, and ideas shared here are purely for educational and informational purposes only. They are not intended as investment advice or a recommendation to buy, sell, or hold any financial instruments. I am not a SEBI-registered financial adviser.
Trading and investing in the stock market involves risk, and you should do your own research and analysis. You are solely responsible for any decisions made based on this research.
"As HARD EARNED MONEY IS YOUR's, So DECISION SHOULD HAVE TO BE YOUR's".
Do comment if Helpful .
Do Comment for In depth Analysis.
❇️ Follow notification about periodical View
💥 Do Comment for Stock WEEKLY Level Analysis.🚀

GIFTNIFTY IntraSwing Levels For 05th JAN 2026💥Level Interpretation / description:
L#1: If the candle crossed & stays above the “Buy Gen”, it is treated / considered as Bullish bias.
L#2: Possibility / Probability of REVERSAL near RLB#1 & UBTgt
L#3: If the candle stays above “Sell Gen” but below “Buy Gen”, it is treated / considered as Sidewise. Aggressive Traders can take Long position near “Sell Gen” either retesting or crossed from Below & vice-versa i.e. can take Short position near “Buy Gen” either retesting or crossed downward from Above.
L#4: If the candle crossed & stays below the “Sell Gen”, it is treated / considered a Bearish bias.
L#5: Possibility / Probability of REVERSAL near RLS#1 & USTgt
HZB (Buy side) & HZS (Sell side) => Hurdle Zone,
*** Specialty of “HZB#1, HZB#2 HZS#1 & HZS#2” is Sidewise (behaviour in Nature)
Rest Plotted and Mentioned on Chart
Color code Used:
Green =. Positive bias.
Red =. Negative bias.
RED in Between Green means Trend Finder / Momentum Change
/ CYCLE Change and Vice Versa.
Notice One thing: HOW LEVELS are Working.
Use any Momentum Indicator / Oscillator or as you "USED to" to Take entry.
⚠️ DISCLAIMER:
The information, views, and ideas shared here are purely for educational and informational purposes only. They are not intended as investment advice or a recommendation to buy, sell, or hold any financial instruments. I am not a SEBI-registered financial adviser.
Trading and investing in the stock market involves risk, and you should do your own research and analysis. You are solely responsible for any decisions made based on this research.
"As HARD EARNED MONEY IS YOUR's, So DECISION SHOULD HAVE TO BE YOUR's".
Do comment if Helpful .
Do Comment for In depth Analysis.
❇️ Follow notification about periodical View
💥 Do Comment for Stock WEEKLY Level Analysis.🚀

TPAT Framework Breakdown on GBPUSDRejections tell a story. The path of the Precise trader is to figure out which rejections tell the most enthralling story of all - how? By observing the AMS or candle patterns price forms near the onset of the rejection.

RELIANCE: US attack on Venezuela & Level Analysis❇️ New Delhi: The US attack on Venezuela is unlikely to have any material impact on Indian refiners, which had already exited Venezuelan crude due to sanctions. Venezuela is now a marginal exporter, and any supply disruption is unlikely to lift
💥India's Exposure: Venezuela supplies ~3-5% of India's crude imports (USD 364.5M in FY25, per ET). Reliance's Jamnagar refinery (1.24M bpd capacity) diversified sources (Russia 30%, US 20%, Middle East 40%); Venezuelan crude <10% pre-2024 sanctions.
Fundamental Impact on RELIANCE💥
💥 Refining Margins: Minimal hit —crude diversification shields from supply shocks. If Venezuelan output rises under US influence, cheaper heavy crude could widen Reliance's GRM (gross refining margin) to $15-18/bbl (current ~$14). Risk: Short-term Brent volatility (+2-3% if escalation) could squeeze margins by 5-10%.
Flows & Valuations: FIIs net bought ₹500 Cr in energy Dec end (offsetting YTD ₹2.3L Cr outflows); DII supportive. RELIANCE P/E ~22x (sector avg 20x), EV/EBITDA ~8x—stable amid event.
💥 Global/Macro: US CPI soft (2.7% Dec) aids EMs; rupee ~90.45 steady on RBI. Geopolitical: Low escalation risk (China/Russia condemn but no retaliation), per X sentiment (posts focus on oil prices, not India-specific panic).
Conclusion: 🚀Buy on Dip Strategy.
❇️Screen Shot of 75 min TF❇️
💥Level Interpretation / description:
L#1: If the candle crossed & stays above the “Buy Gen”, it is treated / considered as Bullish bias.
L#2: Possibility / Probability of REVERSAL near RLB#1 & UBTgt
L#3: If the candle stays above “Sell Gen” but below “Buy Gen”, it is treated / considered as Sidewise. Aggressive Traders can take Long position near “Sell Gen” either retesting or crossed from Below & vice-versa i.e. can take Short position near “Buy Gen” either retesting or crossed downward from Above.
L#4: If the candle crossed & stays below the “Sell Gen”, it is treated / considered a Bearish bias.
L#5: Possibility / Probability of REVERSAL near RLS#1 & USTgt
HZB (Buy side) & HZS (Sell side) => Hurdle Zone,
*** Specialty of “HZB#1, HZB#2 HZS#1 & HZS#2” is Sidewise (behaviour in Nature)
Rest Plotted and Mentioned on Chart
Color code Used:
Green =. Positive bias.
Red =. Negative bias.
RED in Between Green means Trend Finder / Momentum Change
/ CYCLE Change and Vice Versa.
Notice One thing: HOW LEVELS are Working.
Use any Momentum Indicator / Oscillator or as you "USED to" to Take entry.
⚠️ DISCLAIMER:
The information, views, and ideas shared here are purely for educational and informational purposes only. They are not intended as investment advice or a recommendation to buy, sell, or hold any financial instruments. I am not a SEBI-registered financial adviser.
Trading and investing in the stock market involves risk, and you should do your own research and analysis. You are solely responsible for any decisions made based on this research.
"As HARD EARNED MONEY IS YOUR's, So DECISION SHOULD HAVE TO BE YOUR's".
Do comment if Helpful .
Do Comment for In depth Analysis.
❇️ Follow notification about periodical View
💥 Do Comment for Stock WEEKLY Level Analysis.🚀

CROMPTON Level Analysis: 05th - 09th JAN 2026⚒️ CROMPTON Level Analysis: 05th - 09th JAN 2026 🏃🏽♂️
🚀IntraSwing Levels 5 min TF
💥Level Interpretation / description:
L#1: If the candle crossed & stays above the “Buy Gen”, it is treated / considered as Bullish bias.
L#2: Possibility / Probability of REVERSAL near RLB#1 & UBTgt
L#3: If the candle stays above “Sell Gen” but below “Buy Gen”, it is treated / considered as Sidewise. Aggressive Traders can take Long position near “Sell Gen” either retesting or crossed from Below & vice-versa i.e. can take Short position near “Buy Gen” either retesting or crossed downward from Above.
L#4: If the candle crossed & stays below the “Sell Gen”, it is treated / considered a Bearish bias.
L#5: Possibility / Probability of REVERSAL near RLS#1 & USTgt
HZB (Buy side) & HZS (Sell side) => Hurdle Zone,
*** Specialty of “HZB#1, HZB#2 HZS#1 & HZS#2” is Sidewise (behaviour in Nature)
Rest Plotted and Mentioned on Chart
Color code Used:
Green =. Positive bias.
Red =. Negative bias.
RED in Between Green means Trend Finder / Momentum Change
/ CYCLE Change and Vice Versa.
Notice One thing: HOW LEVELS are Working.
Use any Momentum Indicator / Oscillator or as you "USED to" to Take entry.
⚠️ DISCLAIMER:
The information, views, and ideas shared here are purely for educational and informational purposes only. They are not intended as investment advice or a recommendation to buy, sell, or hold any financial instruments. I am not a SEBI-registered financial adviser.
Trading and investing in the stock market involves risk, and you should do your own research and analysis. You are solely responsible for any decisions made based on this research.
"As HARD EARNED MONEY IS YOUR's, So DECISION SHOULD HAVE TO BE YOUR's".
Do comment if Helpful .
Do Comment for In depth Analysis.
❇️ Follow notification about periodical View
💥 Do Comment for Stock WEEKLY Level Analysis.🚀

PIIND: Price Testing a Long-Term Structural Support TrendlineThis chart highlights a well-respected long-term rising support trendline, validated multiple times over several market cycles. Each marked touch shows how price has historically reacted from this structure, confirming its relevance and strength.
Currently, price has once again returned to this major structural support after a corrective phase. The decline into support has been orderly, without panic or excessive volatility, suggesting controlled participation rather than distribution.
From a pure price-action perspective:
Structure remains intact
Support is clearly defined
Risk is naturally limited near the trendline
No indicators are required here. The chart itself tells the story — institutional memory exists at this level, and price behavior around this zone will be more important than any indicator reading.
This is a simple, clean, and high-quality structure, best observed with patience and discipline.

INDHOTEL: Inverse Head & Shoulders within a Contracting TriangleINDHOTEL has been correcting for a prolonged period and is now showing a clear shift in structure.
Price has formed an Inverse Head & Shoulders near the lower end of the range, highlighting gradual absorption of selling pressure. At the same time, the broader structure is compressing between a falling trendline (resistance) and rising lows (support), creating a contracting triangle.
This phase reflects price digestion after a decline, where volatility narrows and balance builds between buyers and sellers. The recent higher low and steady acceptance above support indicate improving participation from the buy side.
Overall, this is a structural recovery attempt inside a compression zone, best observed through price behavior rather than indicators.

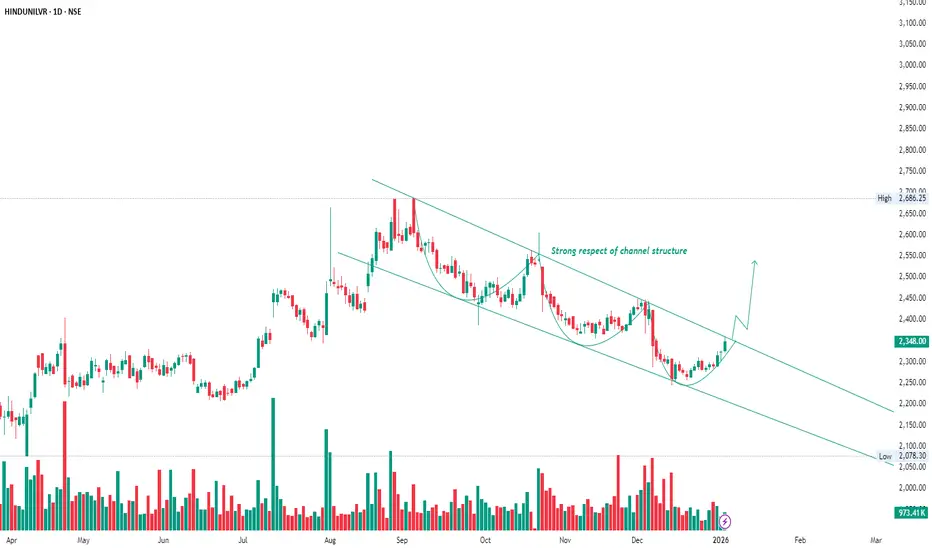
HINDUNILVR: Price compressing inside a falling channelHINDUNILVR has been trading inside a well-defined falling channel, respecting both the upper resistance line and the lower support line multiple times. Each decline within the channel has been met with buying interest near the lower boundary, indicating demand absorption at lower levels.
Recently, price formed a rounded base near the channel support, followed by a steady recovery with higher lows. This shows that selling pressure is gradually reducing, while buyers are becoming more active.
The current move highlights:
Strong respect of channel structure
Loss of downside momentum near support
Early signs of trend stabilization after a prolonged correction
As long as price holds above the recent base and continues to respect the channel structure, the focus remains on how price behaves near the upper channel boundary, which will decide the next phase.
This is a good example of how price transitions from correction to consolidation, before any meaningful directional expansion.

NIFTY Analysis for 05th JAN 2026: IntraSwing Spot levels💥 NIFTY Analysis for 05th JAN 2026: IntraSwing Spot levels 💥
🚀Follow GIFTNIFTY Post for NF levels
💥Level Interpretation / description:
L#1: If the candle crossed & stays above the “Buy Gen”, it is treated / considered as Bullish bias.
L#2: Possibility / Probability of REVERSAL near RLB#1 & UBTgt
L#3: If the candle stays above “Sell Gen” but below “Buy Gen”, it is treated / considered as Sidewise. Aggressive Traders can take Long position near “Sell Gen” either retesting or crossed from Below & vice-versa i.e. can take Short position near “Buy Gen” either retesting or crossed downward from Above.
L#4: If the candle crossed & stays below the “Sell Gen”, it is treated / considered a Bearish bias.
L#5: Possibility / Probability of REVERSAL near RLS#1 & USTgt
HZB (Buy side) & HZS (Sell side) => Hurdle Zone,
*** Specialty of “HZB#1, HZB#2 HZS#1 & HZS#2” is Sidewise (behaviour in Nature)
Rest Plotted and Mentioned on Chart
Color code Used:
Green =. Positive bias.
Red =. Negative bias.
RED in Between Green means Trend Finder / Momentum Change
/ CYCLE Change and Vice Versa.
Notice One thing: HOW LEVELS are Working.
Use any Momentum Indicator / Oscillator or as you "USED to" to Take entry.
⚠️ DISCLAIMER:
The information, views, and ideas shared here are purely for educational and informational purposes only. They are not intended as investment advice or a recommendation to buy, sell, or hold any financial instruments. I am not a SEBI-registered financial adviser.
Trading and investing in the stock market involves risk, and you should do your own research and analysis. You are solely responsible for any decisions made based on this research.
"As HARD EARNED MONEY IS YOUR's, So DECISION SHOULD HAVE TO BE YOUR's".
Do comment if Helpful .
Do Comment for In depth Analysis.
❇️ Follow notification about periodical View
💥 Do Comment for Stock WEEKLY Level Analysis.🚀
