XAUUSD (ONDA) IntraSwing Levels For 02nd - 03rd JAN2026(3.30 am) $💰$ 🏃🏽 🏃🏼♀️ 🏃🏽♂️ $💰$
💥 Have a Pr💰fitable
New Year 2️⃣0️⃣2️⃣6️⃣🚀
1st Trading Day of New SUN
💥Level Interpretation / description:
L#1: If the candle crossed & stays above the “Buy Gen”, it is treated / considered as Bullish bias.
L#2: Possibility / Probability of REVERSAL near RLB#1 & UBTgt
L#3: If the candle stays above “Sell Gen” but below “Buy Gen”, it is treated / considered as Sidewise. Aggressive Traders can take Long position near “Sell Gen” either retesting or crossed from Below & vice-versa i.e. can take Short position near “Buy Gen” either retesting or crossed downward from Above.
L#4: If the candle crossed & stays below the “Sell Gen”, it is treated / considered a Bearish bias.
L#5: Possibility / Probability of REVERSAL near RLS#1 & USTgt
HZB (Buy side) & HZS (Sell side) => Hurdle Zone,
*** Specialty of “HZB#1, HZB#2 HZS#1 & HZS#2” is Sidewise (behaviour in Nature)
Rest Plotted and Mentioned on Chart
Color code Used:
Green =. Positive bias.
Red =. Negative bias.
RED in Between Green means Trend Finder / Momentum Change
/ CYCLE Change and Vice Versa.
Notice One thing: HOW LEVELS are Working.
Use any Momentum Indicator / Oscillator or as you "USED to" to Take entry.
⚠️ DISCLAIMER:
The information, views, and ideas shared here are purely for educational and informational purposes only. They are not intended as investment advice or a recommendation to buy, sell, or hold any financial instruments. I am not a SEBI-registered financial adviser.
Trading and investing in the stock market involves risk, and you should do your own research and analysis. You are solely responsible for any decisions made based on this research.
"As HARD EARNED MONEY IS YOUR's, So DECISION SHOULD HAVE TO BE YOUR's".
Do comment if Helpful .
Do Comment for In depth Analysis.
❇️ Follow notification about periodical View
💥 Do Comment for Stock WEEKLY Level Analysis.🚀
Beyond Technical Analysis

UCO BANK- BIG INVESTMENT OPPORTUNITYUCO BANK have currently taken support of HYDZ+QDZ+MDZ
LONGTERM TARGET should be at least 70 which is around 100% from current market price
have shared the QDZ chart
this stock should be added for regular trading opportunities as well

BTC at strong support levelBTC seems to have completed wave E of an expanding triangle.
-- EXPANDING TRIANGLE--
Wave E is generally equal to (101-161.8)% of Wave C.
In rare cases it could also be equal to 261.8% of Wave A or Wave C
---------------------------------
Wave E is already equal to twice of wave C and if it sustains above ~93,800, we could expect an upside from here.
Will keep you guys posted as the move progresses.
HAPPY TRADING !!

At last reversalWas beaten down for a long time even though the company is undervalued and fundamentally strong. Technicals were pushing it down but for the past few sessions had formed a stable buy at the long time support of 250s. If able to break above the resect high - forms a doble bottom and hence the end of downtrend

GIFTNIFTY IntraSwing Levels For 02nd JAN 2026🚀Follow & Calculate Premium with NIFTY Post for NF Trading
💥Level Interpretation / description:
L#1: If the candle crossed & stays above the “Buy Gen”, it is treated / considered as Bullish bias.
L#2: Possibility / Probability of REVERSAL near RLB#1 & UBTgt
L#3: If the candle stays above “Sell Gen” but below “Buy Gen”, it is treated / considered as Sidewise. Aggressive Traders can take Long position near “Sell Gen” either retesting or crossed from Below & vice-versa i.e. can take Short position near “Buy Gen” either retesting or crossed downward from Above.
L#4: If the candle crossed & stays below the “Sell Gen”, it is treated / considered a Bearish bias.
L#5: Possibility / Probability of REVERSAL near RLS#1 & USTgt
HZB (Buy side) & HZS (Sell side) => Hurdle Zone,
*** Specialty of “HZB#1, HZB#2 HZS#1 & HZS#2” is Sidewise (behaviour in Nature)
Rest Plotted and Mentioned on Chart
Color code Used:
Green =. Positive bias.
Red =. Negative bias.
RED in Between Green means Trend Finder / Momentum Change
/ CYCLE Change and Vice Versa.
Notice One thing: HOW LEVELS are Working.
Use any Momentum Indicator / Oscillator or as you "USED to" to Take entry.
⚠️ DISCLAIMER:
The information, views, and ideas shared here are purely for educational and informational purposes only. They are not intended as investment advice or a recommendation to buy, sell, or hold any financial instruments. I am not a SEBI-registered financial adviser.
Trading and investing in the stock market involves risk, and you should do your own research and analysis. You are solely responsible for any decisions made based on this research.
"As HARD EARNED MONEY IS YOUR's, So DECISION SHOULD HAVE TO BE YOUR's".
Do comment if Helpful .
Do Comment for In depth Analysis.
❇️ Follow notification about periodical View
💥 Do Comment for Stock WEEKLY Level Analysis.🚀

gold chartgold looking for sell which is good sign for equity market below 135000 we can expect fall in gold im totally bearish on gold there is no risk reward in gold let it correct then only invest in gold

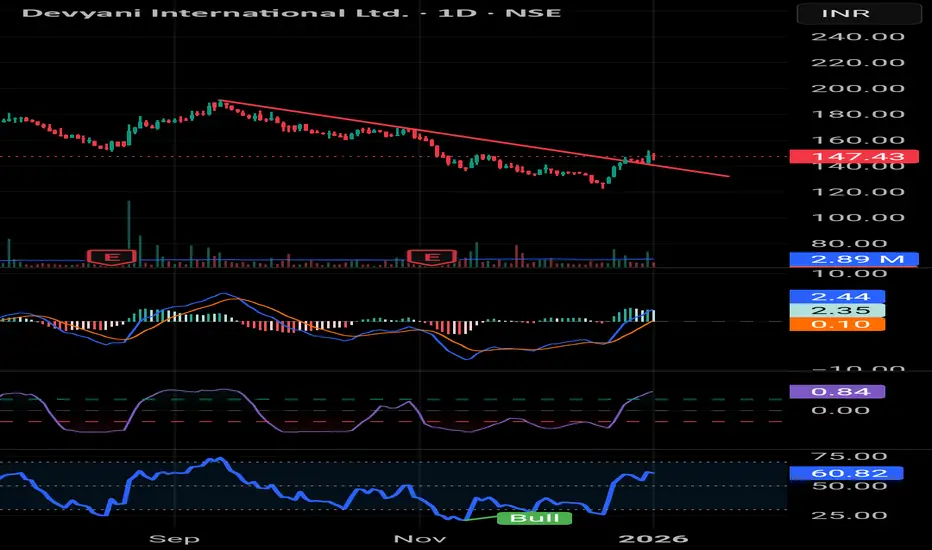
Devyani with merge catalyst at the verge of potential reversalDevyani International (DEVYANI) at ₹145-147 shows potential reversal signals.
Bearish trend persists (price below SMAs, MACD histogram negative at -2.9), but RSI ~60 hints at momentum shift from oversold (prior lows ~50), Stochastic dipping into bullish territory, and RSI divergence emerging—classic reversal cues
Merger catalyst amplifies:
Sapphire Foods board nod (177:100 swap ratio) eyes Apr 2026 close, forming QSR giant (3,000+ stores). Despite Q3 loss (-₹24 Cr), synergies promise 15-20% EBITDA boost, FII buying (Nippon/Kotak holdings up). Support holds ₹142; break ₹148 targets ₹160+
Action: Watch volume spike + MACD zero-line cross for buy.
Risk: NCLT delays.
one last push🏋🏻
Before we step down, domestic big money sees a window while most global markets are on holiday. Think of it like a child left home alone—they’ll try to clean up the mess by the time you return.
Local players are expected to dominate until tomorrow’s first session, with a strong chance of testing a triple top or nudging that level slightly. In the second half, global markets may bring the fire back into the room. Like the kid, attempts to “clean up” won’t fully succeed. Expect major manipulation—money moving between futures and cash, while quietly profiting through options in the background.

NIFTY Analysis for 2nd JAN '26: IntraSwing Spot level🚀Follow GIFTNIFTY Post for NF levels
💥Level Interpretation / description:
L#1: If the candle crossed & stays above the “Buy Gen”, it is treated / considered as Bullish bias.
L#2: Possibility / Probability of REVERSAL near RLB#1 & UBTgt
L#3: If the candle stays above “Sell Gen” but below “Buy Gen”, it is treated / considered as Sidewise. Aggressive Traders can take Long position near “Sell Gen” either retesting or crossed from Below & vice-versa i.e. can take Short position near “Buy Gen” either retesting or crossed downward from Above.
L#4: If the candle crossed & stays below the “Sell Gen”, it is treated / considered a Bearish bias.
L#5: Possibility / Probability of REVERSAL near RLS#1 & USTgt
HZB (Buy side) & HZS (Sell side) => Hurdle Zone,
*** Specialty of “HZB#1, HZB#2 HZS#1 & HZS#2” is Sidewise (behaviour in Nature)
Rest Plotted and Mentioned on Chart
Color code Used:
Green =. Positive bias.
Red =. Negative bias.
RED in Between Green means Trend Finder / Momentum Change
/ CYCLE Change and Vice Versa.
Notice One thing: HOW LEVELS are Working.
Use any Momentum Indicator / Oscillator or as you "USED to" to Take entry.
⚠️ DISCLAIMER:
The information, views, and ideas shared here are purely for educational and informational purposes only. They are not intended as investment advice or a recommendation to buy, sell, or hold any financial instruments. I am not a SEBI-registered financial adviser.
Trading and investing in the stock market involves risk, and you should do your own research and analysis. You are solely responsible for any decisions made based on this research.
"As HARD EARNED MONEY IS YOUR's, So DECISION SHOULD HAVE TO BE YOUR's".
Do comment if Helpful .
Do Comment for In depth Analysis.
❇️ Follow notification about periodical View
💥 Do Comment for Stock WEEKLY Level Analysis.🚀

FEDFINA Price ActionFEDFINA is in a steady uptrend with price holding above key moving averages and momentum indicators in the positive zone, but it is close to near-term resistance so risk‑reward for fresh entries is moderate rather than aggressive

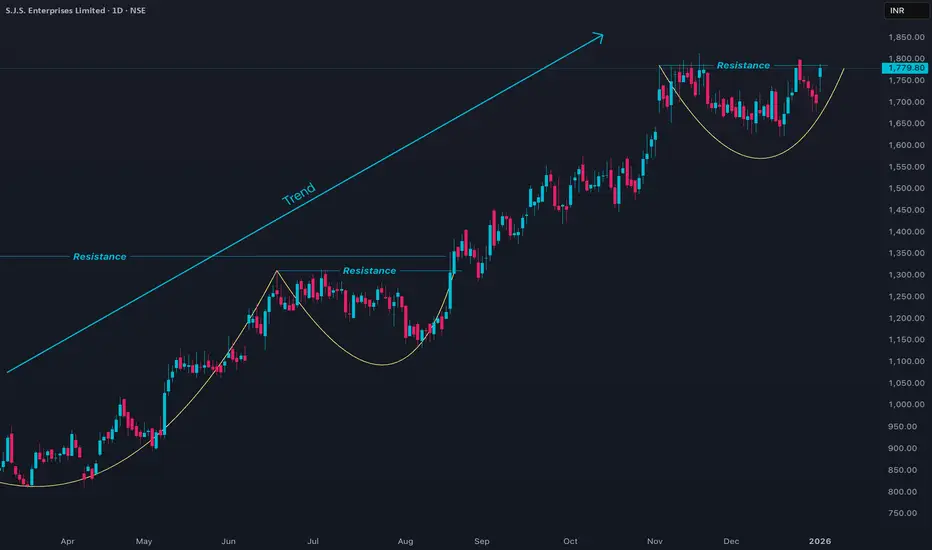
SJS Price Action1. Trend Bullish
2. Set up - rounding pattern
3. RR is lucrative
SJS is in a medium‑term uptrend but currently consolidating just below recent highs, with mixed momentum and nearby resistance, so fresh longs need staggered entries and tight risk.
Option Trading Strategies Styles of Options
• American Style
Can be exercised anytime before expiry.
• European Style
Can only be exercised on expiry day.
Indian index options like Nifty and Bank Nifty follow this style.
Option Trading Strategies
Options allow traders to build combinations depending on market expectations.
1. Bullish Strategies
Long Call
Bull Call Spread
2. Bearish Strategies
Long Put
Bear Put Spread
3. Neutral Strategies
Iron Condor
Short Straddle / Strangle
Butterfly Spread
4. Volatility Strategies
Long Straddle
Long Strangle
These profit from large movements.
Each strategy balances risk and reward differently.

Primefocus HUGE BASE OF 18 years is about to break.Hi there,
VCP Trader here again!
Hope you're having a great day. Have you ever witnessed a stock double or even triple in value? I’m sure you have! But have you ever wondered what drives such massive returns?
While fundamentals and earnings certainly play a role, I’m here to shed light on the technical side of things.
Take a look at the monthly chart of Prime Focus. The base started forming in 2006, and after 18 long years, it’s now sitting right at the top of this base in 2024. This long-term base formation is just one key factor, but how it's formed is equally important.
As illustrated in the chart, you can spot three distinct legs of the stock, with the price contracting from left to right. It's almost as if the stock has run out of room within the base. What excites me the most is the consolidation right before a potential breakout—right at the top of the base.
I believe this stock is poised for a 100% gain, and I expect it to begin its upward movement from the current zones. My target for the stock is 275.
Note: This idea will be invalidated only if we see a monthly candle closing below the third leg of the Volatility Contraction Pattern.
— That VCP Trader

Understanding the Psychology Behind Financial Decision-Making1. Meaning and Concept of Behavioral Finance
Behavioral finance studies how psychological factors affect investors’ decision-making processes.
It challenges the traditional assumption that investors always act rationally and logically.
The field explains why investors often make systematic errors in judgment.
It focuses on understanding anomalies in financial markets that cannot be explained by classical theories.
2. Traditional Finance vs Behavioral Finance
Traditional finance assumes rational investors and efficient markets.
It relies on models such as Efficient Market Hypothesis (EMH) and Modern Portfolio Theory (MPT).
Behavioral finance argues that investors are influenced by emotions and mental shortcuts.
It explains market bubbles, crashes, overreactions, and underreactions.
3. Role of Psychology in Finance
Human psychology plays a critical role in financial decision-making.
Emotions such as fear, greed, hope, and regret impact investment choices.
Investors often rely on intuition rather than objective analysis.
Psychological tendencies lead to predictable patterns of behavior in markets.
4. Cognitive Biases in Behavioral Finance
Cognitive biases are systematic errors in thinking that affect judgments.
These biases arise due to limited information-processing abilities.
They cause investors to misinterpret information and make irrational decisions.
Behavioral finance categorizes biases into cognitive and emotional biases.
5. Overconfidence Bias
Investors tend to overestimate their knowledge and predictive abilities.
Overconfidence leads to excessive trading and risk-taking.
It often results in lower returns due to higher transaction costs.
Traders believe they can outperform the market consistently.
6. Herd Behavior
Herd behavior occurs when investors follow the actions of others.
Decisions are made based on crowd behavior rather than independent analysis.
This bias contributes to market bubbles and crashes.
It is common during bull markets and panic-selling phases.
7. Loss Aversion
Loss aversion means investors feel losses more strongly than gains.
The pain of losing ₹1,000 is greater than the pleasure of gaining ₹1,000.
Investors hold losing positions too long to avoid realizing losses.
This bias leads to poor portfolio performance and risk mismanagement.
8. Anchoring Bias
Anchoring occurs when investors rely heavily on initial information.
Past prices often act as anchors for future decisions.
Investors may refuse to sell below their purchase price.
This prevents objective evaluation of current market conditions.
9. Confirmation Bias
Investors seek information that confirms their existing beliefs.
Contradictory data is ignored or undervalued.
This bias reinforces incorrect assumptions and poor decisions.
It limits learning and adaptability in dynamic markets.
10. Availability Bias
Decisions are influenced by easily available or recent information.
Investors give more importance to news that is memorable or sensational.
Media coverage strongly affects investment choices.
This bias leads to overreaction to short-term events.
11. Mental Accounting
Investors treat money differently based on its source or purpose.
For example, profits are treated differently from salary income.
This leads to inefficient allocation of capital.
Rational portfolio management is compromised.
12. Prospect Theory
Developed by Daniel Kahneman and Amos Tversky.
Explains how people evaluate gains and losses asymmetrically.
Investors are risk-averse in gains and risk-seeking in losses.
It forms the foundation of behavioral finance.
13. Market Anomalies Explained by Behavioral Finance
Behavioral finance explains anomalies like momentum and reversals.
It explains why stock prices deviate from intrinsic value.
Investor sentiment causes mispricing in markets.
These anomalies persist due to limits to arbitrage.
14. Behavioral Finance and Market Bubbles
Excessive optimism leads to asset price bubbles.
Herd behavior and overconfidence fuel rapid price increases.
When reality sets in, panic selling causes crashes.
Examples include stock market bubbles and real estate booms.
15. Behavioral Finance in Trading
Traders are influenced by emotions during volatile markets.
Fear leads to premature exits, while greed leads to overtrading.
Behavioral awareness improves discipline and consistency.
Successful traders manage emotions alongside strategies.
16. Behavioral Finance in Investing
Long-term investors also suffer from biases.
Emotional reactions affect asset allocation and rebalancing.
Behavioral mistakes reduce long-term wealth creation.
Systematic investment plans help reduce emotional impact.
17. Role of Behavioral Finance in Portfolio Management
Portfolio construction considers investor psychology.
Risk tolerance is influenced by emotional comfort, not just numbers.
Behavioral profiling helps customize portfolios.
It improves investor satisfaction and adherence.
18. Behavioral Finance in Indian Markets
Indian markets show strong retail investor participation.
Herd behavior is common during IPOs and trending stocks.
News and social media heavily influence sentiment.
Behavioral finance is crucial for understanding market volatility in India.
19. Importance of Behavioral Finance for Financial Advisors
Advisors must understand client psychology.
Emotional coaching is as important as financial planning.
It helps prevent panic decisions during market downturns.
Builds long-term trust and better outcomes.
20. Managing Behavioral Biases
Awareness is the first step in controlling biases.
Having predefined rules reduces emotional decisions.
Diversification and discipline improve rationality.
Regular review and reflection help correct mistakes.
21. Criticism of Behavioral Finance
Some argue it lacks precise mathematical models.
Behavioral explanations may seem subjective.
Not all market movements can be explained psychologically.
Still, it complements traditional finance effectively.
22. Future of Behavioral Finance
Increasing relevance with retail investor growth.
Technology and AI incorporate behavioral insights.
Behavioral finance will shape investment education.
It will continue bridging the gap between theory and reality.
23. Conclusion
Behavioral finance provides a realistic view of financial markets.
It acknowledges human limitations and emotional influences.
Understanding behavioral finance improves decision-making.
It is essential for traders, investors, and policymakers in modern markets.

Emerging Trends in the Indian Trading Market1. Rise of Retail Participation
One of the most defining trends in the Indian trading market is the massive increase in retail investor participation. Easy access to smartphones, low-cost internet, and user-friendly trading platforms have democratized market access. Millions of first-time traders have entered equities, derivatives, and commodities, especially after the pandemic period. Discount brokerages offering zero or low brokerage fees have further accelerated this shift. Retail traders are no longer passive investors; they actively participate in intraday trading, options trading, and thematic bets, significantly influencing market liquidity and volatility.
2. Boom in Derivatives and Options Trading
India has emerged as one of the largest derivatives markets globally, particularly in index options trading. A notable trend is the growing preference for options over cash equity trading among retail participants. Weekly index options, low capital requirements, and the potential for high returns have made derivatives attractive. However, this has also increased speculative activity, leading regulators to focus on risk management, margin requirements, and investor education. The dominance of derivatives indicates a shift from long-term investing toward short-term trading strategies.
3. Technology-Driven Trading Ecosystem
Technology has become the backbone of the Indian trading market. Algorithmic trading, once limited to institutional investors, is now accessible to sophisticated retail traders through APIs and strategy platforms. Artificial intelligence (AI), machine learning, and data analytics are increasingly used for signal generation, risk management, and portfolio optimization. High-speed execution, real-time data, and advanced charting tools have improved efficiency but also intensified competition. Technology has reduced information asymmetry, making markets more transparent yet faster-moving.
4. Growing Popularity of Systematic and Quantitative Strategies
Indian traders are gradually shifting from discretionary, emotion-driven trading to rule-based and systematic strategies. Backtesting, automation, and quantitative models are gaining traction, especially among younger and tech-savvy traders. Momentum trading, trend-following systems, mean reversion strategies, and statistical arbitrage are becoming more common. This trend reflects a maturing market where consistency, discipline, and risk-adjusted returns are increasingly valued over speculative bets.
5. Increased Focus on Risk Management and Position Sizing
With higher participation and volatility, traders are becoming more aware of the importance of risk management. Concepts such as position sizing, stop-loss discipline, risk-reward ratios, and capital preservation are now widely discussed. Educational content on trading psychology and money management has grown rapidly. This shift suggests that traders are recognizing that long-term survival in markets depends more on managing losses than chasing profits.
6. Regulatory Evolution and Market Transparency
The role of regulators, particularly SEBI, has been crucial in shaping modern Indian markets. Recent trends include tighter margin norms, peak margin requirements, enhanced disclosure standards, and stricter oversight of derivatives trading. While these measures initially faced resistance, they have improved market integrity and reduced excessive leverage. Regulatory clarity has increased foreign investor confidence and strengthened India’s position as a credible global trading destination.
7. Sectoral and Thematic Trading Gaining Traction
Another prominent trend is the rise of sectoral and thematic trading. Traders increasingly focus on themes such as renewable energy, electric vehicles, defense, infrastructure, digital economy, and manufacturing-led growth. Government initiatives like “Make in India,” PLI schemes, and energy transition policies have influenced sector-based trades. Instead of trading isolated stocks, participants now analyze broader macro and policy-driven narratives, reflecting a more informed and structured approach.
8. Influence of Global Markets and Macroeconomic Factors
The Indian trading market is more globally connected than ever. Movements in US markets, crude oil prices, interest rate decisions by global central banks, currency fluctuations, and geopolitical developments have a direct impact on Indian indices. Traders actively track global cues, economic data, and policy announcements. This trend highlights India’s integration into the global financial system and the need for traders to adopt a multi-asset and macro-aware perspective.
9. Growth of Commodity and Currency Trading
Beyond equities, commodity and currency trading have seen steady growth. Gold, silver, crude oil, natural gas, and agricultural commodities attract traders seeking diversification and inflation hedging. Currency derivatives allow traders and businesses to manage forex risk more effectively. The increasing popularity of these segments reflects a broader understanding of cross-market relationships and portfolio diversification.
10. Expansion of Trading Education and Content Ecosystem
The Indian trading ecosystem has witnessed an explosion of educational platforms, webinars, social media content, and online communities. Traders now have access to structured courses on technical analysis, options strategies, trading psychology, and quantitative methods. While this has improved knowledge dissemination, it has also increased the need for discernment, as not all content is reliable. Nonetheless, the emphasis on education signals a transition toward more informed and skilled market participants.
11. Behavioral Shifts and Trading Psychology Awareness
Another important trend is the growing awareness of behavioral finance and trading psychology. Traders increasingly acknowledge the impact of emotions such as fear, greed, and overconfidence. Journaling, performance analysis, and mindset training are becoming integral parts of trading routines. This psychological maturity suggests that Indian traders are evolving beyond purely technical or fundamental approaches.
12. Long-Term Outlook and Market Maturity
Overall, the Indian trading market is moving toward greater depth, liquidity, and sophistication. While volatility and speculative behavior remain, the long-term trend points to a more mature ecosystem characterized by better regulation, advanced technology, and educated participants. India’s strong economic growth prospects, expanding middle class, and increasing financialization of savings provide a solid foundation for sustained market development.
Conclusion
The trends in the Indian trading market reflect a powerful combination of technology, participation, regulation, and global integration. From the rise of retail traders and derivatives dominance to systematic strategies and thematic trading, the market is evolving rapidly. While challenges such as excessive speculation and risk mismanagement persist, the overall direction is positive. As traders become more disciplined, informed, and technology-driven, the Indian trading market is well-positioned to play a leading role in the global financial landscape in the years ahead.

GIFTNIFTY IntraSwing Levels For 01st JAN 2026🏃🏽🏃🏼♀️🏃🏽♂️💰2️⃣0️⃣2️⃣6️⃣🇪🇬 🇪🇬 💥🚀🥇🥈₹₹₹
₹₹₹ 🏃🏽 🏃🏼♀️ 🏃🏽♂️ 🏃🏽 🏃🏼♀️ 🏃🏽♂️ ₹₹₹
💥 Have a Pr💰fitable New Year 2️⃣0️⃣2️⃣6️⃣🚀
💥Level Interpretation / description:
L#1: If the candle crossed & stays above the “Buy Gen”, it is treated / considered as Bullish bias.
L#2: Possibility / Probability of REVERSAL near RLB#1 & UBTgt
L#3: If the candle stays above “Sell Gen” but below “Buy Gen”, it is treated / considered as Sidewise. Aggressive Traders can take Long position near “Sell Gen” either retesting or crossed from Below & vice-versa i.e. can take Short position near “Buy Gen” either retesting or crossed downward from Above.
L#4: If the candle crossed & stays below the “Sell Gen”, it is treated / considered a Bearish bias.
L#5: Possibility / Probability of REVERSAL near RLS#1 & USTgt
HZB (Buy side) & HZS (Sell side) => Hurdle Zone,
*** Specialty of “HZB#1, HZB#2 HZS#1 & HZS#2” is Sidewise (behaviour in Nature)
Rest Plotted and Mentioned on Chart
Color code Used:
Green =. Positive bias.
Red =. Negative bias.
RED in Between Green means Trend Finder / Momentum Change
/ CYCLE Change and Vice Versa.
Notice One thing: HOW LEVELS are Working.
Use any Momentum Indicator / Oscillator or as you "USED to" to Take entry.
⚠️ DISCLAIMER:
The information, views, and ideas shared here are purely for educational and informational purposes only. They are not intended as investment advice or a recommendation to buy, sell, or hold any financial instruments. I am not a SEBI-registered financial adviser.
Trading and investing in the stock market involves risk, and you should do your own research and analysis. You are solely responsible for any decisions made based on this research.
"As HARD EARNED MONEY IS YOUR's, So DECISION SHOULD HAVE TO BE YOUR's".
Do comment if Helpful .
Do Comment for In depth Analysis.
❇️ Follow notification about periodical View
💥 Do Comment for Stock WEEKLY Level Analysis.🚀

TMPV – Base Formation with Inverse Head & Shoulders at SupportTMPV was in a prolonged downtrend, respecting a descending trendline with multiple rejections. The decline eventually reached a well-defined demand zone, where selling pressure started to dry up.
At this support, price has formed a clear Inverse Head & Shoulders structure — with a deeper head, higher shoulders, and improving price acceptance near the base. This pattern reflects a gradual shift in control from sellers to buyers, supported by tighter candles and higher lows.
The recent move shows price lifting off the base while still respecting the broader structure. The descending trendline above remains a key reference, but the behavior near support suggests accumulation rather than continuation of weakness.

XAUUSD (ONDA) IntraSwing Levels For 31/12/25-01st JAN'26(3.30 am ₹₹₹ 🏃🏽 🏃🏼♀️ 🏃🏽♂️
💥 Have a Pr💰fitable
New Year 2️⃣0️⃣2️⃣6️⃣🚀
💥Level Interpretation / description:
L#1: If the candle crossed & stays above the “Buy Gen”, it is treated / considered as Bullish bias.
L#2: Possibility / Probability of REVERSAL near RLB#1 & UBTgt
L#3: If the candle stays above “Sell Gen” but below “Buy Gen”, it is treated / considered as Sidewise. Aggressive Traders can take Long position near “Sell Gen” either retesting or crossed from Below & vice-versa i.e. can take Short position near “Buy Gen” either retesting or crossed downward from Above.
L#4: If the candle crossed & stays below the “Sell Gen”, it is treated / considered a Bearish bias.
L#5: Possibility / Probability of REVERSAL near RLS#1 & USTgt
HZB (Buy side) & HZS (Sell side) => Hurdle Zone,
*** Specialty of “HZB#1, HZB#2 HZS#1 & HZS#2” is Sidewise (behaviour in Nature)
Rest Plotted and Mentioned on Chart
Color code Used:
Green =. Positive bias.
Red =. Negative bias.
RED in Between Green means Trend Finder / Momentum Change
/ CYCLE Change and Vice Versa.
Notice One thing: HOW LEVELS are Working.
Use any Momentum Indicator / Oscillator or as you "USED to" to Take entry.
⚠️ DISCLAIMER:
The information, views, and ideas shared here are purely for educational and informational purposes only. They are not intended as investment advice or a recommendation to buy, sell, or hold any financial instruments. I am not a SEBI-registered financial adviser.
Trading and investing in the stock market involves risk, and you should do your own research and analysis. You are solely responsible for any decisions made based on this research.
"As HARD EARNED MONEY IS YOUR's, So DECISION SHOULD HAVE TO BE YOUR's".
Do comment if Helpful .
Do Comment for In depth Analysis.
❇️ Follow notification about periodical View

NIFTY Analysis for 1st JAN '26: IntraSwing Spot levels" 🏃🏽🏃🏼♀️🏃🏽♂️Have a Pr💰fitable New Year 2️⃣0️⃣2️⃣6️⃣ "
💥Level Interpretation / description:
L#1: If the candle crossed & stays above the “Buy Gen”, it is treated / considered as Bullish bias.
L#2: Possibility / Probability of REVERSAL near RLB#1 & UBTgt
L#3: If the candle stays above “Sell Gen” but below “Buy Gen”, it is treated / considered as Sidewise. Aggressive Traders can take Long position near “Sell Gen” either retesting or crossed from Below & vice-versa i.e. can take Short position near “Buy Gen” either retesting or crossed downward from Above.
L#4: If the candle crossed & stays below the “Sell Gen”, it is treated / considered a Bearish bias.
L#5: Possibility / Probability of REVERSAL near RLS#1 & USTgt
HZB (Buy side) & HZS (Sell side) => Hurdle Zone,
*** Specialty of “HZB#1, HZB#2 HZS#1 & HZS#2” is Sidewise (behaviour in Nature)
Rest Plotted and Mentioned on Chart
Color code Used:
Green =. Positive bias.
Red =. Negative bias.
RED in Between Green means Trend Finder / Momentum Change
/ CYCLE Change and Vice Versa.
Notice One thing: HOW LEVELS are Working.
Use any Momentum Indicator / Oscillator or as you "USED to" to Take entry.
⚠️ DISCLAIMER:
The information, views, and ideas shared here are purely for educational and informational purposes only. They are not intended as investment advice or a recommendation to buy, sell, or hold any financial instruments. I am not a SEBI-registered financial adviser.
Trading and investing in the stock market involves risk, and you should do your own research and analysis. You are solely responsible for any decisions made based on this research.
"As HARD EARNED MONEY IS YOUR's, So DECISION SHOULD HAVE TO BE YOUR's".
Do comment if Helpful .
Do Comment for In depth Analysis.
❇️ Follow notification about periodical View

JSL 1 Day Time Frame 🔑 Daily Levels (1‑Day Time Frame)
Level Price (₹) Description
R3 ~₹820 Major resistance zone
R2 ~₹812 Secondary resistance
R1 ~₹805 Immediate resistance (near recent highs)
Pivot Point (PP) ~₹796‑₹797 Daily pivot reference
S1 ~₹786 First support zone
S2 ~₹780 Second support (near recent lows)
S3 ~₹773‑₹774 Strong downside support
🔎 Additional short‑term support/resistance context:
• Short‑term support around ₹772 and resistance near ~₹813 on daily charts/intraday pivot models.
📌 How To Use These Levels Today (1‑Day Strategy)
Bullish continuation
✔ Above ₹805–₹810 — next upside target towards ₹812–₹820.
✔ Break and hold above ₹820 signals strong bullish momentum.
Range / Neutral zone
↔ Between ₹786 – ₹805 — likely range‑bound unless heavy volumes break one side.
Bearish scenario
✘ Below ₹780 — opening further downside toward ₹773‑₹770 levels.
📈 Technical Sentiment Snapshot (Daily)
• Some daily indicators lean bullish (strong buy signals on technicals as per some platforms) but momentum oscillators like RSI/MACD show mixed short‑term signals.

Bonds and Fixed Income Trading StrategiesNavigating Stability, Yield, and Risk
Bonds and fixed income instruments form the backbone of global financial markets, providing stability, predictable income, and diversification to investors and traders alike. Unlike equities, which are driven largely by growth expectations and corporate performance, bonds are influenced by interest rates, inflation, credit quality, and macroeconomic policy. Fixed income trading strategies aim to generate returns through interest income, price appreciation, or relative value opportunities while managing risks such as interest rate volatility, credit events, and liquidity constraints. Understanding these strategies is essential for traders, portfolio managers, and policymakers operating in an increasingly complex financial environment.
Understanding Bonds and Fixed Income Markets
Bonds are debt instruments issued by governments, corporations, and institutions to raise capital. In exchange, issuers promise to pay periodic interest (coupon) and return the principal at maturity. Fixed income markets include government bonds, corporate bonds, municipal bonds, treasury bills, notes, debentures, and structured products. The “fixed income” label reflects the predictable cash flows, although bond prices themselves fluctuate based on market conditions.
The bond market is heavily influenced by interest rates set by central banks. When interest rates rise, bond prices generally fall, and when rates fall, bond prices rise. Inflation expectations, fiscal deficits, monetary policy signals, and global capital flows also play a major role. As a result, fixed income trading strategies often combine macroeconomic analysis with quantitative techniques and risk management frameworks.
Interest Rate Trading Strategies
One of the most common fixed income strategies is interest rate trading. Traders seek to profit from anticipated changes in interest rates or yield curves. Directional strategies involve taking long or short positions in bonds based on expectations of rate cuts or hikes. For example, if a trader expects rates to decline, they may buy long-duration bonds to benefit from price appreciation.
Yield curve strategies focus on the shape and movement of the yield curve rather than absolute rate levels. Strategies such as curve steepeners and flatteners involve positioning for changes in the spread between short-term and long-term interest rates. A steepener strategy benefits when long-term rates rise faster than short-term rates, while a flattener benefits when the spread narrows. These strategies are widely used by banks, hedge funds, and institutional investors.
Carry and Roll-Down Strategies
Carry and roll-down strategies are popular among fixed income traders seeking relatively stable returns. Carry refers to the income earned from holding a bond, typically the coupon minus funding costs. Roll-down refers to the price appreciation that occurs as a bond moves closer to maturity and “rolls down” the yield curve to a lower yield point.
Traders often select bonds with attractive carry and roll-down characteristics, especially in stable or moderately declining rate environments. While these strategies can generate steady income, they are vulnerable to sudden interest rate spikes or yield curve shifts, making risk management crucial.
Credit Trading Strategies
Credit strategies focus on the credit quality of bond issuers. Traders analyze credit spreads, which represent the yield difference between a corporate bond and a comparable government bond. When traders expect a company’s creditworthiness to improve, they may buy its bonds, anticipating a tightening of spreads and price gains. Conversely, if credit risk is expected to increase, traders may short bonds or buy credit protection.
High-yield and distressed debt strategies fall under credit trading. These involve investing in lower-rated bonds that offer higher yields but carry greater default risk. Successful credit strategies rely on deep fundamental analysis, including balance sheets, cash flows, industry trends, and macroeconomic conditions.
Relative Value and Arbitrage Strategies
Relative value strategies aim to exploit pricing inefficiencies between related fixed income securities. These strategies are generally market-neutral, meaning they seek to profit regardless of overall market direction. Examples include bond spread trades, swap spread trades, and treasury versus futures arbitrage.
In these strategies, traders simultaneously take long and short positions in similar instruments that are mispriced relative to historical or theoretical values. While returns may be modest, leverage is often used to enhance profitability. However, these strategies require sophisticated risk controls, as unexpected market dislocations can lead to significant losses.
Inflation-Linked and Real Return Strategies
Inflation-linked bonds, such as inflation-indexed government securities, provide protection against rising inflation. Trading strategies in this space focus on breakeven inflation rates, which represent the market’s inflation expectations. Traders may position themselves based on views about future inflation, central bank credibility, and supply-demand dynamics.
Real return strategies are especially important during periods of high inflation uncertainty. These strategies help preserve purchasing power while offering diversification benefits to traditional nominal bond portfolios.
Liquidity and Volatility-Based Strategies
Liquidity plays a critical role in fixed income markets, which can become fragmented and less transparent during periods of stress. Some traders focus on liquidity premiums, buying less liquid bonds at a discount and holding them until liquidity improves. Others trade volatility through options on bonds, interest rates, or bond futures.
Volatility-based strategies involve positioning for changes in interest rate volatility rather than rate direction. These strategies are often used by hedge funds and sophisticated institutional players, as they require advanced models and derivatives expertise.
Risk Management in Fixed Income Trading
Risk management is central to all bond trading strategies. Key risks include interest rate risk, credit risk, inflation risk, currency risk, and liquidity risk. Duration and convexity are widely used metrics to measure sensitivity to interest rate changes. Credit exposure is managed through diversification, position limits, and hedging instruments such as credit default swaps.
Stress testing and scenario analysis are also essential, especially in an era of rapid policy shifts and geopolitical uncertainty. Effective risk management ensures that fixed income strategies remain resilient across different market cycles.
Conclusion
Bonds and fixed income trading strategies offer a wide range of opportunities, from stable income generation to sophisticated relative value and macro-driven trades. While often perceived as conservative, fixed income markets are dynamic and deeply interconnected with global economic forces. Successful trading requires a strong understanding of interest rates, credit dynamics, yield curves, and risk management techniques. As financial markets evolve, bonds and fixed income strategies will continue to play a vital role in portfolio construction, capital preservation, and long-term financial stability.

GIFTNIFTY IntraSwing Levels For 31st Dec '25💥💥💥 Last Trading Day of 2025 Calender Year.
Hope you all enjoyed. 💥💥💥
💥Level Interpretation / description:
L#1: If the candle crossed & stays above the “Buy Gen”, it is treated / considered as Bullish bias.
L#2: Possibility / Probability of REVERSAL near RLB#1 & UBTgt
L#3: If the candle stays above “Sell Gen” but below “Buy Gen”, it is treated / considered as Sidewise. Aggressive Traders can take Long position near “Sell Gen” either retesting or crossed from Below & vice-versa i.e. can take Short position near “Buy Gen” either retesting or crossed downward from Above.
L#4: If the candle crossed & stays below the “Sell Gen”, it is treated / considered a Bearish bias.
L#5: Possibility / Probability of REVERSAL near RLS#1 & USTgt
HZB (Buy side) & HZS (Sell side) => Hurdle Zone,
*** Specialty of “HZB#1, HZB#2 HZS#1 & HZS#2” is Sidewise (behaviour in Nature)
Rest Plotted and Mentioned on Chart
Color code Used:
Green =. Positive bias.
Red =. Negative bias.
RED in Between Green means Trend Finder / Momentum Change
/ CYCLE Change and Vice Versa.
Notice One thing: HOW LEVELS are Working.
Use any Momentum Indicator / Oscillator or as you "USED to" to Take entry.
⚠️ DISCLAIMER:
The information, views, and ideas shared here are purely for educational and informational purposes only. They are not intended as investment advice or a recommendation to buy, sell, or hold any financial instruments. I am not a SEBI-registered financial adviser.
Trading and investing in the stock market involves risk, and you should do your own research and analysis. You are solely responsible for any decisions made based on this research.
"As HARD EARNED MONEY IS YOUR's, So DECISION SHOULD HAVE TO BE YOUR's".
Do comment if Helpful .
Do Comment for In depth Analysis.
❇️ Follow notification about periodical View

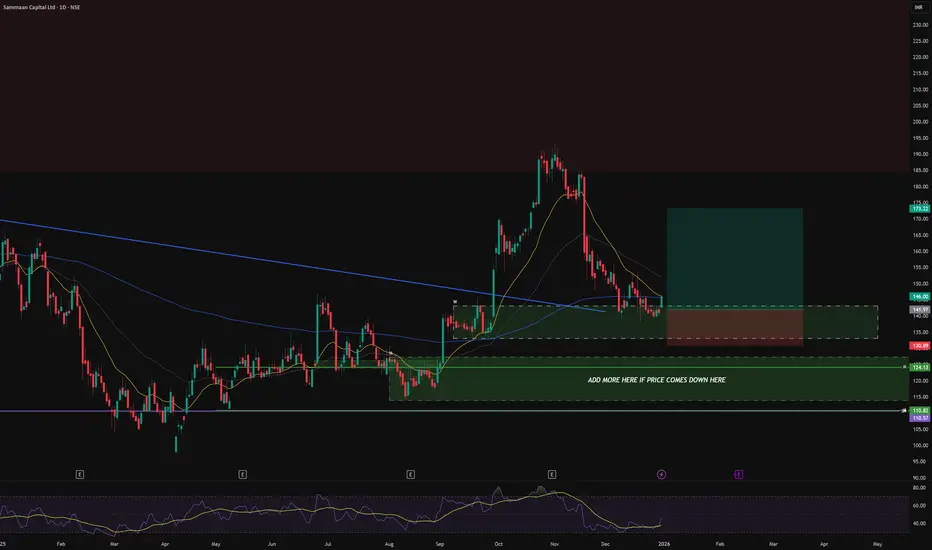
SAMMAANCAP- trading as well as investing planSAMMAANCAP looks good at CMP
the entry i have taken and the target both are mentioned on the chart
can add the stock for investing and trading both
there is a very good MDZ below this zone
can add more in that marked box