Marico: Post-Results Rally Tests Resistance ZoneTechnical Analysis
Marico Limited showcases an impressive wealth creation journey spanning two decades. The stock has delivered a super bullish rally from less than ₹12 to reaching ₹720 by 2024 - representing an extraordinary 60x growth over 20 years.
Since 2024, the ₹720-₹760 zone has acted as formidable resistance, tested multiple times without a decisive breakout. On November 14, 2025, the company announced its Q2 FY26 results. Responding to positive sales numbers showing 31% revenue growth, the stock shot up 2% and is now trading at ₹739.
Currently positioned near the upper end of the resistance zone, the stock is attempting another breakout. A decisive break above ₹760 with strong volume confirmation would signal the next major rally phase.
Entry Strategy: Wait for confirmed breakout above ₹760 with volume before initiating fresh positions.
Targets:
Target 1: ₹780
Target 2: ₹800
Target 3: ₹820
Risk Assessment:
No significant bullish expectations below the ₹720-₹760 resistance zone.
💰Q2 FY26 Financial Highlights (vs Q1 FY26 & Q2 FY25)
Total Income: ₹3,482 Cr (↑ +7% QoQ from ₹3,259 Cr; ↑ +31% YoY from ₹2,664 Cr)
Total Expenses: ₹2,922 Cr (↑ +12% QoQ from ₹2,604 Cr; ↑ +36% YoY from ₹2,142 Cr)
Operating Profit: ₹560 Cr (↓ -15% QoQ from ₹655 Cr; ↑ +7% YoY from ₹522 Cr)
Profit Before Tax: ₹550 Cr (↓ -16% QoQ from ₹656 Cr; ↓ -0.4% YoY from ₹552 Cr)
Profit After Tax: ₹432 Cr (↓ -16% QoQ from ₹513 Cr; ↓ -0.2% YoY from ₹433 Cr)
Diluted EPS: ₹3.24 (↓ -17% QoQ from ₹3.89; ↓ -0.9% YoY from ₹3.27)
Fundamental Highlights
Marico delivered stellar Q2 FY26 performance with consolidated revenue soaring 31% YoY to ₹3,482 crore - the highest growth in 17 quarters. The company achieved underlying volume growth of 7% in India business and robust 20% constant currency growth in international markets, despite margin pressures from input cost inflation.
India business revenue jumped 35% YoY to ₹2,667 crore, aided by strategic price hikes in core portfolios. Digital-first premium personal care portfolio (Beardo, Just Herbs, Plix) crossed ₹1,000 crore annualized run rate, while foods portfolio grew 12% crossing ₹1,100 crore ARR with Saffola Oats retaining number one position.
Despite input cost pressures causing 810 bps gross margin contraction, the company increased brand investments with A&P spend rising 19% to ₹345 crore. EBITDA grew 7% to ₹560 crore with margins at 16.1%. Over 95% of portfolio gained or sustained market share while 75% strengthened penetration.
International business recorded 20% CCG with Bangladesh up 22%, MENA 27%, and newer countries/exports surging 53%. Rural demand outpaced urban 2x, with CEO Saugata Gupta confirming company is "on track for full-year aspirations" targeting revenue growth in thirties and 18%+ EBITDA margins in H2.
Avendus retained Buy rating with ₹832 target (raised from ₹810), while Motilal Oswal maintained Buy at ₹825 target. The stock gained 15% YTD outperforming Nifty FMCG's 10%. GST rate rationalization expected to benefit nearly 30% of portfolio, with strategic focus on digital acceleration (20% sales target by FY27) and sustainability initiatives.
Conclusion
Marico's impressive 20-year journey from sub-₹12 to ₹720, backed by stellar Q2 FY26 showing highest revenue growth in 17 quarters at 31%, validates the FMCG leadership thesis despite flat PAT. Post-results 2% rally to ₹739 tests critical ₹720-₹760 resistance zone. Digital-first portfolio crossing ₹1,000 crore ARR, foods at ₹1,100 crore ARR, and 20% international CCG demonstrate diversified growth engines. Rural outpacing urban 2x and 95% portfolio gaining market share provide strong momentum. Breakout above ₹760 could trigger rally toward ₹820 levels with analyst targets at ₹825-₹832 supporting upside potential.
Disclaimer: aliceblueonline.com
Beyond Technical Analysis

Muthoot Finance: Record 10% Surge After Stellar Q2🔍Technical Analysis
Muthoot Finance Limited showcases one of the most impressive wealth creation stories spanning over a decade. The stock has delivered a super bullish rally from less than ₹100 to reaching ₹3,400 by November 13, 2025 - representing an extraordinary 34x growth in just over 10 years.
On the evening of November 13, 2025, the company announced its Q2 FY26 results which exceeded market expectations significantly. The market's immediate response was spectacular - the very next day on November 14, the stock shot up 10% and closed at ₹3,725, hitting an all-time high of ₹3,755 during intraday trading.
This powerful breakout from ₹3,400 to ₹3,725 demonstrates strong institutional and retail buying interest, fueled by robust fundamentals and exceptional financial performance. The stock has now entered uncharted territory with strong momentum.
Entry Strategy: Current levels offer opportunity with strong momentum. Consider accumulation on minor dips.
Targets:
Target 1: ₹3,800
Target 2: ₹3,900
Target 3: ₹4,000
Risk Assessment:
No expectations below ₹3,400 level, which now acts as strong support post-breakout.
💰Q2 FY26 Financial Highlights (vs Q1 FY26 & Q2 FY25)
Total Income: ₹7,283 Cr (↑ +13% QoQ from ₹6,450 Cr; ↑ +48% YoY from ₹4,929 Cr)
Total Expenses: ₹2,571 Cr (↑ +9% QoQ from ₹2,355 Cr; ↑ +42% YoY from ₹1,807 Cr)
Operating Profit: ₹3,232 Cr (↑ +22% QoQ from ₹2,654 Cr; ↑ +80% YoY from ₹1,798 Cr)
Profit Before Tax: ₹3,244 Cr (↑ +22% QoQ from ₹2,654 Cr; ↑ +80% YoY from ₹1,802 Cr)
Profit After Tax: ₹2,412 Cr (↑ +22% QoQ from ₹1,974 Cr; ↑ +83% YoY from ₹1,321 Cr)
Diluted EPS: ₹60.29 (↑ +20% QoQ from ₹50.22; ↑ +90% YoY from ₹31.67)
🧠Fundamental Highlights
Muthoot Finance delivered spectacular Q2 FY26 performance with standalone PAT surging 87% YoY to ₹2,345 crore and total income jumping 56.5% to ₹6,461 crore, driven by robust gold loan demand amid soaring gold prices. The company achieved highest-ever loan AUM of ₹1,47,673 crore (up 42% YoY) and gold loan AUM of ₹1,24,918 crore (up 45% YoY).
Net interest income (NII) rose impressive 58.5% YoY to ₹3,992 crore, driven by continued momentum in core gold loan segment and steady borrower activity. Net interest margin expanded significantly to 12.66% from 11.5% in Q2 FY25, indicating superior interest income growth and efficient capital deployment.
Gold loan AUM increased by ₹11,723 crore during Q2 FY26, registering 10% quarterly growth. Gold prices rallying over 40% in 2025 boosted customer confidence and loan demand. The board approved incremental fundraising up to ₹35,000 crore through NCDs and ₹500 crore equity infusion in subsidiary Muthoot Money Limited.
Asset quality showed remarkable improvement with Stage III loan assets declining to 2.25% from 4.3% YoY, while Stage II assets improved from ₹1,203 crore to ₹534 crore. Management upgraded AUM guidance to 30-35% growth, signaling high confidence in sustaining momentum through FY26.
Multiple brokerages turned bullish post-results: Nuvama raised target to ₹4,000 (from ₹2,993) maintaining Buy rating, Motilal Oswal increased target to ₹3,800 with Neutral rating, while Bernstein maintained Outperform at ₹3,400 citing 25% AUM CAGR potential over FY25-27E with 36% EPS CAGR and 24%+ ROE.
Conclusion
Muthoot Finance's remarkable decade-long journey from sub-₹100 to ₹3,755 all-time high, backed by exceptional Q2 FY26 showing 83% PAT growth and 48% revenue surge, validates the gold loan leadership thesis. Post-results 10% surge to ₹3,725 demonstrates strong market confidence. Highest-ever AUM at ₹1,47,673 crore, NIM expansion to 12.66%, and asset quality improvement with 2.25% Stage III loans showcase operational excellence. Management's upgraded 30-35% AUM guidance and brokerage targets at ₹3,800-₹4,000 support bullish outlook. Gold price tailwinds and digital transformation initiatives provide sustained growth visibility toward ₹4,000 target.
Disclaimer: aliceblueonline.com

Tata Steel: Resistance Test Awaits Q2 CatalystTechnical Analysis
Tata Steel Limited has demonstrated a strong bullish rally spanning three decades, establishing itself as a blue-chip steel sector leader. Over the past year, the stock has been facing persistent resistance in the ₹184-₹187 zone, tested multiple times without a decisive breakout.
Currently trading at ₹181, the stock is positioned just below this critical resistance zone. Interestingly, while quarterly revenue shows a slight drop both QoQ and YoY, EPS has demonstrated positive growth - indicating improved profitability and operational efficiency despite revenue headwinds.
The Q2 FY26 results scheduled for announcement day after tomorrow (November 12, 2025) serve as a crucial catalyst. Positive results could provide the fundamental support needed to break through the stubborn ₹184-₹187 resistance zone and trigger the next leg of the rally.
Entry Strategy: Wait for Q2 results and breakout confirmation above ₹187 before initiating positions.
🎯Targets:
Target 1: ₹190
Target 2: ₹195
Target 3: ₹200
Risk Assessment:
If resistance is not taken out post Q2 results, no more expectations on this stock.
💰Q1 FY26 Financial Highlights (vs Q4 FY25 & Q1 FY25)
Total Income: ₹53,178 Cr (↓ -5% QoQ from ₹56,218 Cr; ↓ -3% YoY from ₹54,771 Cr)
Total Expenses: ₹45,751 Cr (↓ -8% QoQ from ₹49,659 Cr; ↓ -5% YoY from ₹48,077 Cr)
Operating Profit: ₹7,428 Cr (↑ +13% QoQ from ₹6,559 Cr; ↑ +11% YoY from ₹6,694 Cr)
Profit Before Tax: ₹3,067 Cr (↑ +39% QoQ from ₹2,200 Cr; ↑ +29% YoY from ₹2,377 Cr)
Profit After Tax: ₹2,007 Cr (↑ +67% QoQ from ₹1,201 Cr; ↑ +118% YoY from ₹919 Cr)
Diluted EPS: ₹1.66 (↑ +60% QoQ from ₹1.04; ↑ +116% YoY from ₹0.77)
🧠Fundamental Highlights
Tata Steel delivered exceptional Q1 FY26 performance with PAT surging 118% YoY to ₹2,007 crore despite 3% revenue decline, showcasing remarkable operational efficiency. The company reported strong Q2 FY26 operational data with crude steel production reaching 5.67 million tons (up 8% QoQ and 7% YoY).
Q2 FY26 domestic deliveries grew robustly by 20% QoQ and 7% YoY to 5.56 million tons, driven by normalized operations post G Blast Furnace relining at Jamshedpur. Branded Products & Retail vertical achieved best-ever quarterly volumes of approximately 1.9 million tons, demonstrating strong retail demand.
Market cap stands at ₹2,23,766 crore with the stock delivering impressive returns: up 5.8% in one month, 20% in three months, 30% in six months, and 34% YTD. The company reported 7.3% YoY increase in operating profit for Q1 FY26 with EBITDA of ₹74,560 crore.
European operations showed turnaround with Netherlands reporting 1.67 million tons production and 1.54 million tons deliveries. UK operations targeting Q4 FY26 breakeven with Electric Arc Furnace project construction underway at Port Talbot, representing £1.25 billion decarbonization initiative.
JP Morgan maintains overweight rating with ₹180 price target (17% upside potential), while other brokerages project revenue/EBITDA growth CAGR of 8%/26% over FY25-27E. Steel prices anticipated to have bottomed out with China's stimulus measures expected to benefit the sector.
Conclusion
Tata Steel's three-decade bull run approaching critical ₹184-₹187 resistance zone, backed by exceptional Q1 FY26 showing 118% PAT surge and 116% EPS growth despite revenue decline. Strong Q2 operational data with 8% production growth and 20% delivery increase provide positive momentum ahead of November 12 results announcement. UK breakeven target by Q4 FY26 and European turnaround add to growth visibility. Stock trading at attractive 7.2x FY26E EV/EBITDA with analyst targets of ₹180 suggest 17% upside potential upon resistance breakout.
Disclaimer: aliceblueonline.com

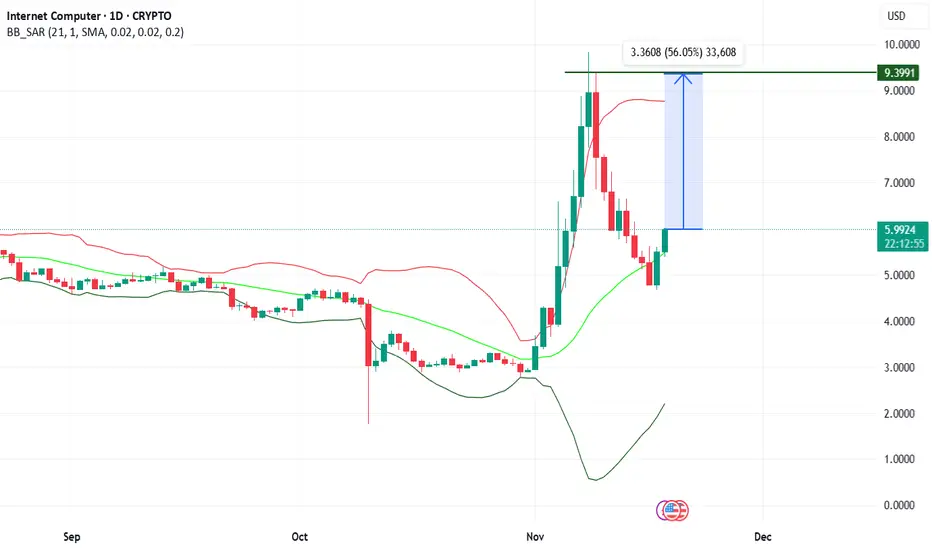
#Internet computer on #cryptoInternet computer on crypto now on 6 ready for 50% with new high
check it out
EUR/JPY target has been achieved. as analyzed in the morning. price followed the trend and went to grab the liquidity of seller's
at top.

EUR/JPY analysis for upcoming move.price in uptrend. making higher lows. and double bottom pattern. expecting an upside move till
upside liquidity.

Nifty 50
* Market open near PDH and make a TR.
*Took sell position after 11:30 but market reverse from that and hit sl
*Again took sell after 13:25 but again got trapped.
* Missed the buy side trade
*Again break previous range and FOC again back in range,

NIFTY at major resistance levelThe up move which started on 8th Aug seems to be forming into an expanding triangle
Currently we're in Wave E which has reached 1.27 times of Wave C.
There's not yet a confirmation of a down move starting but should be cautious at this level.
Could be a good time to book partial profits.
Will keep you guys posted as the move advances and future possibilities
Stay Tuned...
HAPPY TRADING!

Nifty BankMarket open gap up and straight away run.
waiting for pullback but market struck in TR.
No trade in Nifty bank.

Altseason Trigger Map: BTC vs Gold Needs +130% First (Jul26)TL;DR
My thesis: the next true altcoin cycle is preceded by roughly a +130% move in BTC vs gold, not just BTC vs USD.
I’m tracking the BTC/Gold ratio (BTCXAU or BTCUSD ÷ XAUUSD on TradingView) on a weekly log chart.
Base case: BTC/Gold does a +130% repricing from the current base, then we see a violent rotation into alts.
I anchor the cycle top at 0.73 on this chart in July 2026 as the terminal blow-off zone.
Why watch BTC vs Gold at all?
Gold is the classic “hard money” benchmark. Pricing BTC in gold filters out a lot of USD noise (DXY, rates, policy headlines) and asks a cleaner question:
“How aggressively is capital choosing BTC over other forms of money?”
In past cycles, extreme swings in the BTC/Gold ratio have lined up with major BTC legs and subsequent alt mania: parabolic advances in BTC/Gold → long mean-reversion → new base → repeat.
My assumption: the next big alt cycle won’t start from a depressed BTC/Gold ratio. It starts after BTC has already proven itself vs gold.
Current structure (weekly BTC/Gold)
BTC/Gold has been carving out a multi-year base after the last blow-off.
We’re seeing:
Higher lows on the weekly chart
Momentum trying to flip from “dead” to “trending up”
First attempts to break the prior range / downtrend
On log scale, the distance from the base to the previous impulse projects a ~130% measured move if this leg rhymes with prior cycles.
The 130% “altseason trigger move”
My key claim:
The real altcycle begins after BTC/Gold has moved ~+130% from the base.
Why?
A +130% move vs gold means:
BTC has crushed the conservative macro hedge (gold).
Big money has already shifted from “preserve wealth” to “chase convexity”.
Narrative + flows are strongly risk-on.
Historically, alt beta lags that kind of regime shift. First BTC proves dominance → then capital starts searching for higher beta → that’s when alt/BTC pairs really trend, not at the start of the BTC move.
On the chart I:
Mark the current base zone in BTC/Gold.
Project a +130% target band above it (measured move / fib extension).
Treat that band as the “altseason trigger area” – the region where I expect sustained alt outperformance vs BTC to become much more likely.
July 2026: 0.73 as the terminal top
I’m explicitly putting a stake in the ground:
Time:
I place the cycle window around July 2026. That roughly fits the halving-driven 4-year rhythm, allowing time for:
BTC impulse vs gold
Alt rotation
Final blow-off and distribution.
Price (on this chart):
I mark 0.73 as the approximate terminal top level for BTC/Gold.
It’s where several things line up on a log chart:
Extension of the long-term trend channel from prior BTC/Gold peaks
1.618–2.0× expansion of the previous impulse
A level that would leave BTC extremely stretched vs gold, consistent with prior mania phases.
I do not claim we nail the week or the second decimal.
The point is: by mid-2026, with BTC/Gold near that upper band, I assume we’re closer to the end of the cycle than the beginning.
How I’d trade the framework (not a signal)
Before the +130% BTC/Gold move:
Bias toward BTC + a small basket of high-conviction majors.
Treat aggressive alt pumps as distribution / traps.
As BTC/Gold approaches the +130% band:
Start rotating some BTC strength into alts that are actually breaking out vs BTC on higher timeframes.
Watch BTC dominance for topping behavior.
As BTC/Gold approaches ~0.73 into mid-2026:
Assume late-cycle conditions.
De-risk across BTC and alts, especially anything with high beta and weak fundamentals.

Marico: Post-Results Rally Tests Resistance Zone🔍 Technical Analysis
Marico Limited showcases an impressive wealth creation journey spanning two decades. The stock has delivered a super bullish rally from less than ₹12 to reaching ₹720 by 2024 - representing an extraordinary 60x growth over 20 years.
Since 2024, the ₹720-₹760 zone has acted as formidable resistance, tested multiple times without a decisive breakout. On November 14, 2025, the company announced its Q2 FY26 results. Responding to positive sales numbers showing 31% revenue growth, the stock shot up 2% and is now trading at ₹739.
Currently positioned near the upper end of the resistance zone, the stock is attempting another breakout. A decisive break above ₹760 with strong volume confirmation would signal the next major rally phase.
Entry Strategy: Wait for confirmed breakout above ₹760 with volume before initiating fresh positions.
Targets:
Target 1: ₹780
Target 2: ₹800
Target 3: ₹820
Risk Assessment:
No significant bullish expectations below the ₹720-₹760 resistance zone.
💰 Q2 FY26 Financial Highlights (vs Q1 FY26 & Q2 FY25)
Total Income: ₹3,482 Cr (↑ +7% QoQ from ₹3,259 Cr; ↑ +31% YoY from ₹2,664 Cr)
Total Expenses: ₹2,922 Cr (↑ +12% QoQ from ₹2,604 Cr; ↑ +36% YoY from ₹2,142 Cr)
Operating Profit: ₹560 Cr (↓ -15% QoQ from ₹655 Cr; ↑ +7% YoY from ₹522 Cr)
Profit Before Tax: ₹550 Cr (↓ -16% QoQ from ₹656 Cr; ↓ -0.4% YoY from ₹552 Cr)
Profit After Tax: ₹432 Cr (↓ -16% QoQ from ₹513 Cr; ↓ -0.2% YoY from ₹433 Cr)
Diluted EPS: ₹3.24 (↓ -17% QoQ from ₹3.89; ↓ -0.9% YoY from ₹3.27)
🧠 Fundamental Highlights
Marico delivered stellar Q2 FY26 performance with consolidated revenue soaring 31% YoY to ₹3,482 crore - the highest growth in 17 quarters. The company achieved underlying volume growth of 7% in India business and robust 20% constant currency growth in international markets, despite margin pressures from input cost inflation.
India business revenue jumped 35% YoY to ₹2,667 crore, aided by strategic price hikes in core portfolios. Digital-first premium personal care portfolio (Beardo, Just Herbs, Plix) crossed ₹1,000 crore annualized run rate, while foods portfolio grew 12% crossing ₹1,100 crore ARR with Saffola Oats retaining number one position.
Despite input cost pressures causing 810 bps gross margin contraction, the company increased brand investments with A&P spend rising 19% to ₹345 crore. EBITDA grew 7% to ₹560 crore with margins at 16.1%. Over 95% of portfolio gained or sustained market share while 75% strengthened penetration.
International business recorded 20% CCG with Bangladesh up 22%, MENA 27%, and newer countries/exports surging 53%. Rural demand outpaced urban 2x, with CEO Saugata Gupta confirming company is "on track for full-year aspirations" targeting revenue growth in thirties and 18%+ EBITDA margins in H2.
Avendus retained Buy rating with ₹832 target (raised from ₹810), while Motilal Oswal maintained Buy at ₹825 target. The stock gained 15% YTD outperforming Nifty FMCG's 10%. GST rate rationalization expected to benefit nearly 30% of portfolio, with strategic focus on digital acceleration (20% sales target by FY27) and sustainability initiatives.
✅ Conclusion
Marico's impressive 20-year journey from sub-₹12 to ₹720, backed by stellar Q2 FY26 showing highest revenue growth in 17 quarters at 31%, validates the FMCG leadership thesis despite flat PAT. Post-results 2% rally to ₹739 tests critical ₹720-₹760 resistance zone. Digital-first portfolio crossing ₹1,000 crore ARR, foods at ₹1,100 crore ARR, and 20% international CCG demonstrate diversified growth engines. Rural outpacing urban 2x and 95% portfolio gaining market share provide strong momentum. Breakout above ₹760 could trigger rally toward ₹820 levels with analyst targets at ₹825-₹832 supporting upside potential.
Disclaimer: This analysis is for educational purposes only. Please consult your financial advisor before making investment decisions. Stock markets are subject to risks.

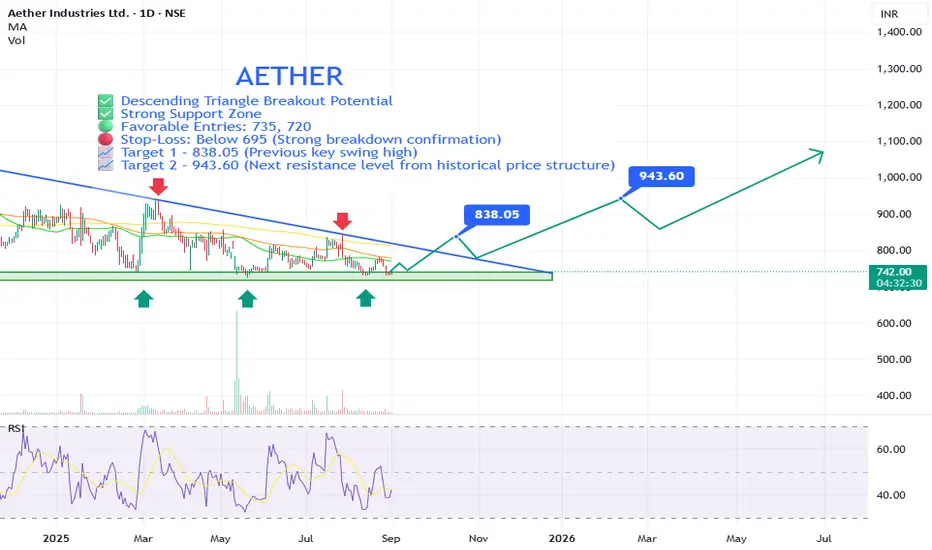
AETHER Bullish Reversal Setup with Strong Risk-Reward PotentialAether Industries Ltd is showing signs of a potential trend reversal from a well-established support zone, supported by a descending triangle breakout pattern and improving technical indicators. This setup suggests a strong risk-reward opportunity for swing traders and positional investors.
⚡ Key Technical Points:
🔵 Descending Triangle Breakout Potential: The price is nearing a breakout from a long-term descending triangle. A breakout above the trendline (~₹778–₹790) could trigger a strong uptrend.
🟢 Strong Support Zone: ₹700–₹720 has held as solid support multiple times (as marked by green arrows), indicating strong demand at these levels.
🟩 Bullish Divergence on RSI: Relative Strength Index (RSI) is showing higher lows while price remains flat or lower, indicating bullish divergence—a sign of potential reversal.
🟢 Favorable Entries: 735, 720
🔴 Stop-Loss: Below 695 (Strong breakdown confirmation)
📈 Target 1 – 838.05 (Previous key swing high)
📈 Target 2 – 943.60 (Next resistance level from historical price structure)
✅ Why This Is a Technically Strong Setup:
✅ Multiple Support Bounces: 700–720 zone has been tested at least 4 times in the last year, showing strength.
✅ Volume-Based Reactions: While volume is low now, past spikes at support zones suggest institutional interest.
✅ Clear Risk Management: Stop-loss is tight (~6–7%) with targets offering 1.5–3x risk-reward potential.
✅ Potential Trend Reversal: Break above descending trendline and moving averages could signal a shift to bullish structure.
✅ Long Base Formation: The stock has been consolidating for over a year—long base formations often lead to explosive moves.
📢 Disclaimer: This is not financial advice. Always do your own research or consult with a professional before making investment decisions.
Muthoot Finance: Record 10% Surge After Stellar Q2🔍 Technical Analysis
Muthoot Finance Limited showcases one of the most impressive wealth creation stories spanning over a decade. The stock has delivered a super bullish rally from less than ₹100 to reaching ₹3,400 by November 13, 2025 - representing an extraordinary 34x growth in just over 10 years.
On the evening of November 13, 2025, the company announced its Q2 FY26 results which exceeded market expectations significantly. The market's immediate response was spectacular - the very next day on November 14, the stock shot up 10% and closed at ₹3,725, hitting an all-time high of ₹3,755 during intraday trading.
This powerful breakout from ₹3,400 to ₹3,725 demonstrates strong institutional and retail buying interest, fueled by robust fundamentals and exceptional financial performance. The stock has now entered uncharted territory with strong momentum.
Entry Strategy: Current levels offer opportunity with strong momentum. Consider accumulation on minor dips.
Targets:
Target 1: ₹3,800
Target 2: ₹3,900
Target 3: ₹4,000
Risk Assessment:
No expectations below ₹3,400 level, which now acts as strong support post-breakout.
💰 Q2 FY26 Financial Highlights (vs Q1 FY26 & Q2 FY25)
Total Income: ₹7,283 Cr (↑ +13% QoQ from ₹6,450 Cr; ↑ +48% YoY from ₹4,929 Cr)
Total Expenses: ₹2,571 Cr (↑ +9% QoQ from ₹2,355 Cr; ↑ +42% YoY from ₹1,807 Cr)
Operating Profit: ₹3,232 Cr (↑ +22% QoQ from ₹2,654 Cr; ↑ +80% YoY from ₹1,798 Cr)
Profit Before Tax: ₹3,244 Cr (↑ +22% QoQ from ₹2,654 Cr; ↑ +80% YoY from ₹1,802 Cr)
Profit After Tax: ₹2,412 Cr (↑ +22% QoQ from ₹1,974 Cr; ↑ +83% YoY from ₹1,321 Cr)
Diluted EPS: ₹60.29 (↑ +20% QoQ from ₹50.22; ↑ +90% YoY from ₹31.67)
🧠 Fundamental Highlights
Muthoot Finance delivered spectacular Q2 FY26 performance with standalone PAT surging 87% YoY to ₹2,345 crore and total income jumping 56.5% to ₹6,461 crore, driven by robust gold loan demand amid soaring gold prices. The company achieved highest-ever loan AUM of ₹1,47,673 crore (up 42% YoY) and gold loan AUM of ₹1,24,918 crore (up 45% YoY).
Net interest income (NII) rose impressive 58.5% YoY to ₹3,992 crore, driven by continued momentum in core gold loan segment and steady borrower activity. Net interest margin expanded significantly to 12.66% from 11.5% in Q2 FY25, indicating superior interest income growth and efficient capital deployment.
Gold loan AUM increased by ₹11,723 crore during Q2 FY26, registering 10% quarterly growth. Gold prices rallying over 40% in 2025 boosted customer confidence and loan demand. The board approved incremental fundraising up to ₹35,000 crore through NCDs and ₹500 crore equity infusion in subsidiary Muthoot Money Limited.
Asset quality showed remarkable improvement with Stage III loan assets declining to 2.25% from 4.3% YoY, while Stage II assets improved from ₹1,203 crore to ₹534 crore. Management upgraded AUM guidance to 30-35% growth, signaling high confidence in sustaining momentum through FY26.
Multiple brokerages turned bullish post-results: Nuvama raised target to ₹4,000 (from ₹2,993) maintaining Buy rating, Motilal Oswal increased target to ₹3,800 with Neutral rating, while Bernstein maintained Outperform at ₹3,400 citing 25% AUM CAGR potential over FY25-27E with 36% EPS CAGR and 24%+ ROE.
✅ Conclusion
Muthoot Finance's remarkable decade-long journey from sub-₹100 to ₹3,755 all-time high, backed by exceptional Q2 FY26 showing 83% PAT growth and 48% revenue surge, validates the gold loan leadership thesis. Post-results 10% surge to ₹3,725 demonstrates strong market confidence. Highest-ever AUM at ₹1,47,673 crore, NIM expansion to 12.66%, and asset quality improvement with 2.25% Stage III loans showcase operational excellence. Management's upgraded 30-35% AUM guidance and brokerage targets at ₹3,800-₹4,000 support bullish outlook. Gold price tailwinds and digital transformation initiatives provide sustained growth visibility toward ₹4,000 target.
Disclaimer: This analysis is for educational purposes only. Please consult your financial advisor before making investment decisions. Stock markets are subject to risks.

Titan Company: Supply Zone Test After Strong Q2 🔍 Technical Analysis
Titan Company Limited showcases one of India's most spectacular wealth creation stories spanning over two decades. The stock has delivered a super bullish rally from less than ₹2 to reaching ₹3,886 in January 2024 - representing an extraordinary 1,900x+ growth over 20+ years.
The ₹3,886 level established in January 2024 has acted as formidable resistance multiple times. During the resistance phase, the stock corrected to ₹2,925 before regaining momentum. With strong Q2 FY26 performance providing fundamental support, the stock has climbed back to ₹3,877 and is now facing the resistance zone again.
The critical supply zone of ₹3,800-₹3,900 is being tested once more. A decisive breakout above this zone with strong volume confirmation would signal the next major leg of the rally. Currently trading near this resistance, the stock awaits the catalyst for a breakout.
Entry Strategy: Wait for confirmed breakout above ₹3,900 with strong volume before initiating positions.
Targets:
Target 1: ₹4,000
Target 2: ₹4,100
Target 3: ₹4,200
Risk Assessment:
Not expecting significant bullish moves below the ₹3,800-₹3,900 supply zone.
💰 Q2 FY26 Financial Highlights (vs Q1 FY26 & Q2 FY25)
Total Income: ₹18,725 Cr (↑ +13% QoQ from ₹16,523 Cr; ↑ +29% YoY from ₹14,534 Cr)
Total Expenses: ₹16,850 Cr (↑ +15% QoQ from ₹14,693 Cr; ↑ +27% YoY from ₹13,298 Cr)
Operating Profit: ₹1,875 Cr (↑ +2% QoQ from ₹1,830 Cr; ↑ +52% YoY from ₹1,236 Cr)
Profit Before Tax: ₹1,522 Cr (↑ +3% QoQ from ₹1,480 Cr; ↑ +61% YoY from ₹948 Cr)
Profit After Tax: ₹1,120 Cr (↑ +3% QoQ from ₹1,091 Cr; ↑ +59% YoY from ₹704 Cr)
Diluted EPS: ₹12.62 (↑ +3% QoQ from ₹12.29; ↑ +59% YoY from ₹7.93)
🧠 Fundamental Highlights
Titan Company delivered spectacular Q2 FY26 performance with consolidated PAT surging 59% YoY to ₹1,120 crore and revenue jumping 28.5% to ₹18,837 crore, driven by robust festive demand and strategic expansion. EBITDA rose 46.3% YoY to ₹1,987 crore with margins improving 209 bps to 12.1%.
Jewellery division remained the crown jewel with revenue growing 21% YoY to ₹14,092 crore. Domestic brands Tanishq, Mia, and Zoya grew 18% despite high gold prices, while CaratLane delivered exceptional 32% YoY growth. International jewellery business nearly doubled, surging 86% YoY to ₹561 crore, demonstrating successful global expansion.
The company expanded retail presence by adding 55 new stores in Q2, bringing total store count to 3,377 stores as of September 2025. Watches segment grew 12% with analogue watches up 17%, while emerging businesses including fragrances and bags surged 37% YoY.
Strategic initiatives included gold exchange campaigns, lower carat offerings, and retail expansion to combat high gold price challenges. Studded jewellery grew in mid-teens with double-digit like-for-like growth for both Tanishq and CaratLane, showing strength beyond store expansion.
Titan announced plans to acquire 67% stake in Dubai-based Damas Jewellery for international expansion across GCC countries. The company targets 40 new Tanishq store openings this year and maintains optimistic outlook for double-digit growth driven by festive momentum and premiumization strategy.
✅ Conclusion
Titan's remarkable 20+ year journey from sub-₹2 to ₹3,886, backed by exceptional Q2 FY26 showing 59% PAT growth and 29% revenue surge, validates the premium valuation thesis. The critical ₹3,800-₹3,900 supply zone breakout with volume confirmation could trigger rally toward ₹4,200 levels. Jewellery division's 21% growth despite high gold prices, CaratLane's 32% surge, and 86% international business growth demonstrate operational excellence. Damas acquisition and 3,377 store network provide strong growth visibility. Stock trading at ₹3,877 awaits breakout catalyst for next leg upward.
Disclaimer: This analysis is for educational purposes only. Please consult your financial advisor before making investment decisions. Stock markets are subject to risks.

Today(17/11/2025),nifty50 analysis.
CPR: slightly wide + overlapping lower cpr: sideways to bearish.
FII: -4,968.22 sold.
DII: 8,461.47 bought.
Highest OI:
Resistance: 26000, 26100
Support : 25800,25700
conclusion:
My pov: market is neutral to bearish, If and only 26100 is closed and crossed i view as bullish trend lets wait and watch. why because FII keep selling, That the reason i cant clearly think market is in bullish,
psychology fact : Trading is a profession where you have to think freely and creatively.
note:
8moving average ling is blue colour.
20moving average line is green colour
50moving average line is red colour.
200moving average line is black colour.
cpr is for trend analysis.
MA line is for support and resistance.
Disclaimer:
Iam not Sebi registered so i started this as a hobby, please do your own analysis, any profit/loss you gained is not my concern. I can be wrong please do not take it seriously thank you.

BTCUSD If Btc breaks below red line then chances are high it could test below support level white line at 92000 and 88000
Disclaimer:
It's a personal view not a financial advice and I assume no responsibility and liability whatever outcome arises.


MARICO : Near Darvas Box BreakoutMarico is near life time high and consolidation is going on weekly timeframe. chart is showing a good and healthy consolidation.. Nifty is also near ATH and about to Break so as MARICO . Lets see how it perform.
All data is available in public domain..
CMP : 740
TSL : Below 9 Daily EMA
SL : Below 21 Daily EMA
Stock's selection based on 5 Point Analysis:
1: Idea : Near Darvas Box Breakout.
2: Support : Volume, Delivery .
3: Technical : 21/55/200-EMA, Super trend up, RS>0 RSI.
4: Fundamental : PE, PAT, Industry & peer PE and sector performance.
5: Timing : Entry Timing on Daily chart.
Disclaimer : It is my personal view as a trader and for educational purpose only. Equity market involves risk .
Please consult your financial adviser before taking any decision.

Nifty Opening Monday Upside - 26100 or Downside 25600 (approx.)Sir/Mam,
Tomorrow, Nifty will open in gap either up or down, if it opens UPSIDE that means we are not dependent on Global chaos or if it opens DOWNSIDE that means we are still in concern for Global or some internal tension, real test begins tomorrow. It does not mean that it will show momentum tomorrow itself it will create space to reverse for the coming expiry, for e.g. it wants to close above 26000 it will downfall tomorrow or vice versa.
The real panic for tomorrow is it does not open in FLAT that means 25850 - 25950, this range will be premium eating for both call and put buyers, better to stay out and observe for major single candle (70-80 points) for 15 mins chart pattern.
I hope you all have enjoyed weekends expect who have taken call or put on Friday (waiting to book profit) are nervous.
Let's hope for tomorrow for some big movements.
Asli maza tabh aayega jabh 250 - 300 points ka hulchul hoga :)


BTC live tradeBTC live trae
*Took buy side trade
*any one guess why?
lots of liquidity stands would be the level, where we trail sl.
and exit from buy side trade

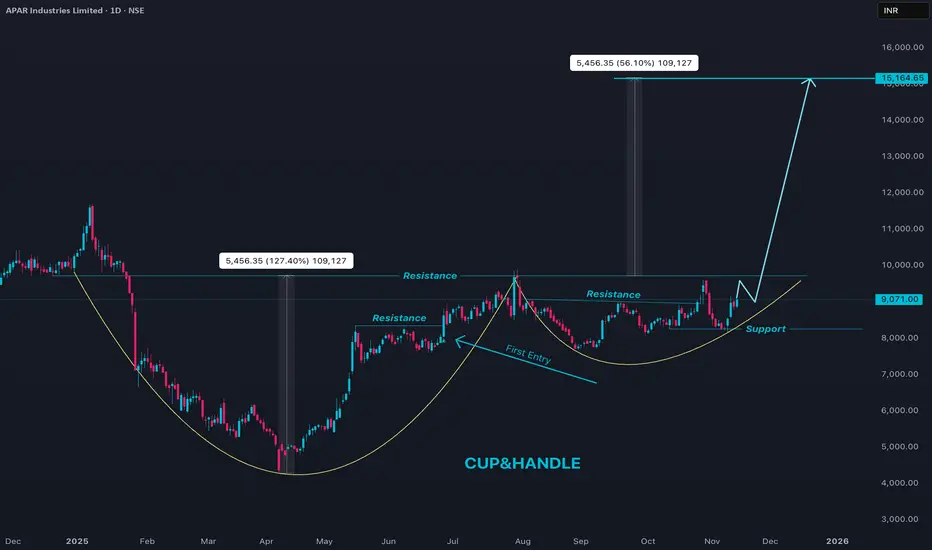
APARINDS Pyramid set upApar Industries (APARINDS) is currently in a strong uptrend on the daily chart, trading near the 9,000+ zone after a sharp rally over the past few months. Price is holding above key short-term moving averages, and momentum indicators like RSI and CCI are in bullish territory but not yet extremely overbought, which supports the ongoing up-move with healthy strength. Recent candles show sustained higher lows with only brief profit-booking dips, indicating buyers are still in control and using declines to accumulate.
In the near term, immediate support lies in the 8,600–8,700 band, where recent pullbacks have found buying interest and where short-term averages are clustering; holding above this zone keeps the trend intact. On the upside, every push to new highs can attract profit booking, so moves toward or above recent peaks around 9,100–9,300 are likely to see some volatility, but the broader structure remains bullish as long as price respects higher lows on the daily timeframe. For fresh positions, staggered entries on dips toward support with clearly defined stop-loss levels below the recent swing low is preferable to chasing extended candles, given the stock’s strong run-up and tendency for swift corrections after vertical rallies.