THANGAMAYL - Swing Buy - all time high BOTHANGAMAYL
rising strength
volume buildup
daily mtt +ve
weekly mtt+
All time high BO
support = 2567 prev all time high
Beyond Technical Analysis

BTC is showing bullish momentum and eyeing further upside.Hi traders! 👋
Wishing you a profitable trading day ahead 💪
Bitcoin is showing signs of recovery after a local pullback.
If the bullish momentum continues, the next targets are:
🎯 TP1: 107,000
🎯 TP2: 110,500
As long as the price stays above 103,000, the bullish scenario remains valid.
A break below this level would cancel the upward setup.
🧠 Stay patient, follow your plan, and let the market come to you.

Gold (XAU/USD): Potential bullish scenarioHey traders 👋
Wishing you a successful trade and a clear mindset today 💫
Gold (XAU/USD): Potential bullish scenario
After a deep correction, gold is showing signs of recovery above the 3980 area. A short-term accumulation zone is forming, which could serve as a base for further upward movement.
The first target is 4050 (TP1) — a breakout of this level may open the way toward 4140 (TP2), where a stronger resistance zone awaits.
However, a confirmed break below 3919 would invalidate this bullish scenario and signal renewed bearish pressure.
📈 TP1: 4050
📈 TP2: 4140
🛑 Invalidation: below 3919
Stay patient and disciplined — consistency always pays off.
Have a successful trade, traders 🌿
— Ivanna Trader

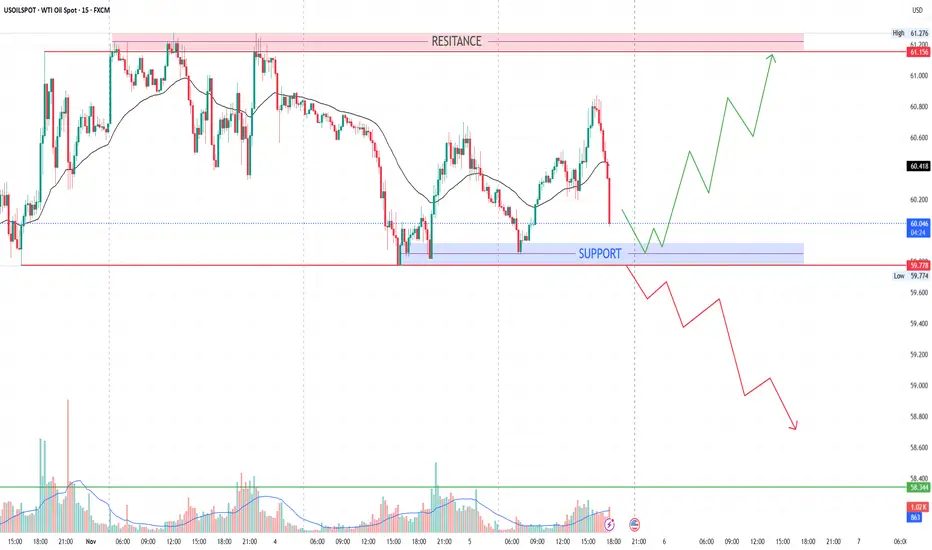
Today support & resistance for USOIL Here's a trading plan based on the provided USOILSPOT data:
**Trading Strategy**
* **Buy Entry:** Around 60.136 (as indicated in the "BUY" zone).
* **Sell Entry:** Around 60.096 (as indicated in the "SELL" zone).
* **Stop-Loss Placement:**
* For Buy Trades: Place your stop-loss slightly below the recent low (e.g., 60.080).
* For Sell Trades: Place your stop-loss slightly above the recent high (e.g., 60.140).
* **Target Price (Take Profit):**
* For Buy Trades: Consider a target around potential resistance levels (you'll need to analyze the chart for this).
* For Sell Trades: Consider a target around potential support levels (again, chart analysis is key).
**Important Considerations:**
* **Risk Management:** Always use stop-loss orders to limit potential losses. Adjust stop-loss and target levels based on your risk tolerance and the specific market conditions.
* **Chart Analysis:** This is a basic suggestion. Thoroughly analyze the USOILSPOT chart using different timeframes, technical indicators (moving averages, RSI, etc.), and patterns to confirm entries and exits.
* **News and Events:** Be aware of any relevant news, economic releases, or geopolitical events that could impact the price of oil.
* **Position Sizing:** Determine your position size based on your risk tolerance and account balance. Never risk more than you can afford to lose.
* **Disclaimer:** Trading involves risk. This is not financial advice. Always do your own research and consult with a financial advisor if needed.
AUDUSD - BUYAUD/USD – Buy Setup 💹
📍 Reason:
1️⃣ Capwave signal on 1H
2️⃣ Session low formed – London session within LDN + NY range

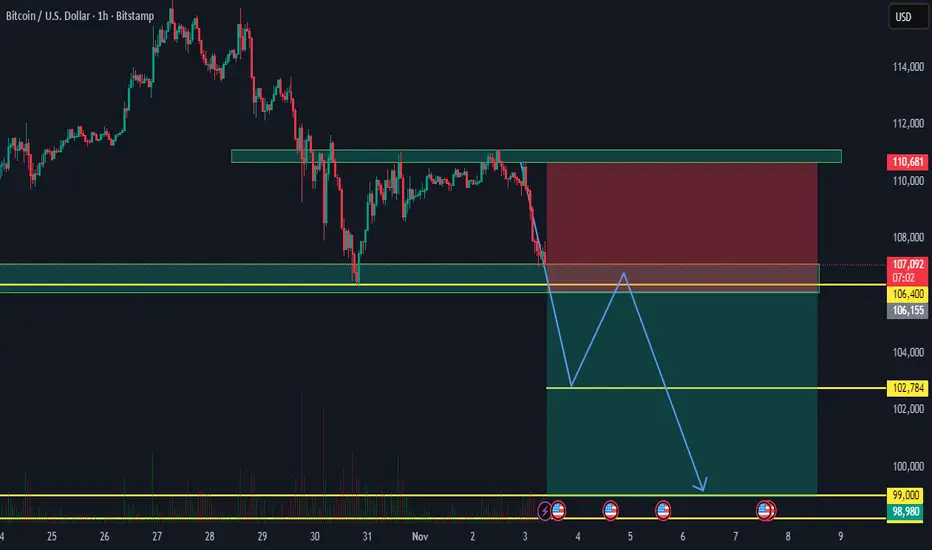
BITCOIN 1HRSWING TRADE
- EARN WITH ME DAILY 10K-20K –
BITCOIN Looking good for Downside..
When it break level 106400 and sustain.. it will go Downside...
SELL @ 106400
Target
1st 102784
2nd 99000
Enjoy trading traders.. Keep add this STOCK in your watch list..
Big Investor are welcome..
Like this Post??? Hit like button..!!!
Follow me for FREE Educational Post and Alert..
XAUUSD 1HRSWING TRADE
- EARN WITH ME DAILY 10K-20K –
XAUUSD Looking good for Downside..
When it break level 3929 and sustain.. it will go Downside...
SELL @ 3929
Target
1st 3887
2nd 3854
Enjoy trading traders.. Keep add this STOCK in your watch list..
Big Investor are welcome..
Like this Post??? Hit like button..!!!
Follow me for FREE Educational Post and Alert..

AUD/NZD Nearing Peak: Expect Controlled PullbackAUD/NZD has completed a clean 5-wave impulsive move to the upside, finishing Wave (1)/(A) near the recent peak. From here, the price looks ready to start a deeper correction in the form of Wave (2)/(B), which may pull back toward the lower support zone inside the rising channel. This corrective move could unfold in multiple legs before turning bullish again. Once Wave (2)/(B) completes, the chart expects a strong rally into Wave (3)/(C), aiming for new highs. In simple terms: a healthy pullback first, then a powerful upside continuation.
Stay tuned!
@Money_Dictators
Thank you :)

Part 6 Learn Institutional Trading Key Terminology in Option Trading
Before trading options, understanding the terminology is crucial:
Underlying Asset: The financial asset (e.g., Nifty 50 index, stock, commodity) on which the option is based.
Strike Price: The fixed price at which the option holder can buy or sell the underlying asset.
Premium: The price paid by the buyer to the seller for obtaining the rights of the option.
Expiration Date: The date on which the option contract expires.
In-the-Money (ITM): When exercising the option would be profitable.
Out-of-the-Money (OTM): When exercising the option would not be profitable.
At-the-Money (ATM): When the market price equals the strike price.

PROTEAN Cup & Handle with double bottom reversal set upProtean eGov Technologies Ltd (PROTEAN) is trading around ₹865 as of early November 2025, with the stock having a year high of ₹1,535 and a low near ₹716. The stock has declined roughly 35% over the last 6 months and about 42% year-on-year from its peak. Valuation metrics show a price-to-earnings (P/E) ratio near 37 and a price-to-book (P/B) ratio around 3.45, indicating a relatively high valuation considering recent price declines.
The company has zero debt, which strengthens its financial stability, but revenue growth has been weak with a recent contraction and modest sales increase in some quarters. Profitability margins remain moderate, and earnings per share (EPS) stood at around ₹23.3. Dividend yield is low at about 1.16%.
Technically, the stock is trading below its 200-day moving average (~₹1,053) and close to the 50-day average (~₹879), suggesting some near-term weakness. Support may be near the recent lows of ₹716, with resistance close to ₹900–₹950. Overall, Protean presents a cautious medium-term outlook, with fundamental strengths balanced by valuation and growth concerns.

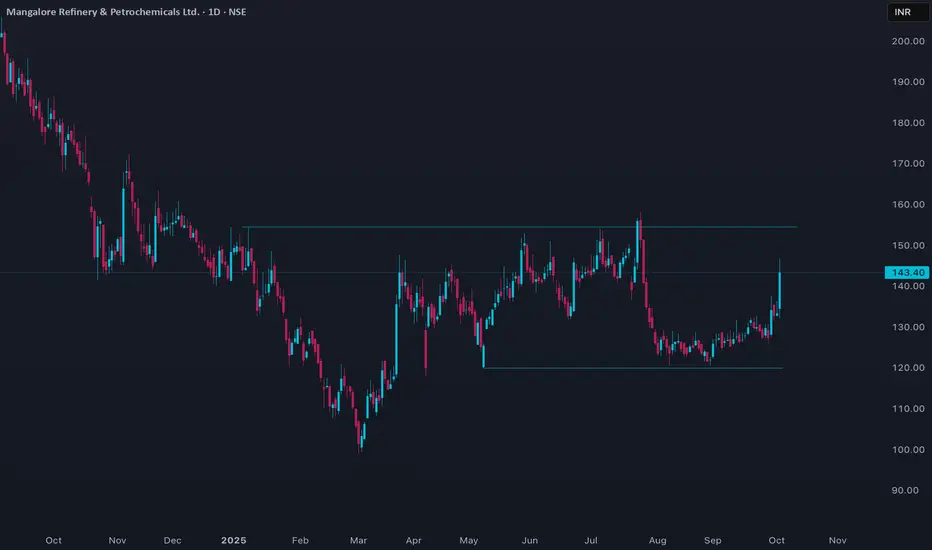
MRPL Price ActionMRPL (Mangalore Refinery and Petrochemicals Limited) has recently exhibited significant price movement influenced by fluctuations in global crude oil prices and domestic refining margins. The stock experienced increased volatility alongside broader market trends, with notable spikes following quarterly earnings announcements and sectoral news.
The price demonstrated a strong recovery trend from its recent lows, driven by improved capacity utilization, higher product realizations, and a stable demand outlook. MRPL faced resistance near key technical levels but witnessed buying interest on declines, indicating positive sentiment among traders.
Short-term momentum indicators suggest bullish bias as the stock maintains higher lows, while volumes remain relatively healthy. However, profit booking at higher levels and external macroeconomic factors could trigger consolidation phases. Overall, MRPL is being closely tracked due to its sensitivity to refinery margins and input costs, and any breakout above resistance could lead to further upside. Conversely, a sustained move below critical support zones might weaken the near-term outlook.
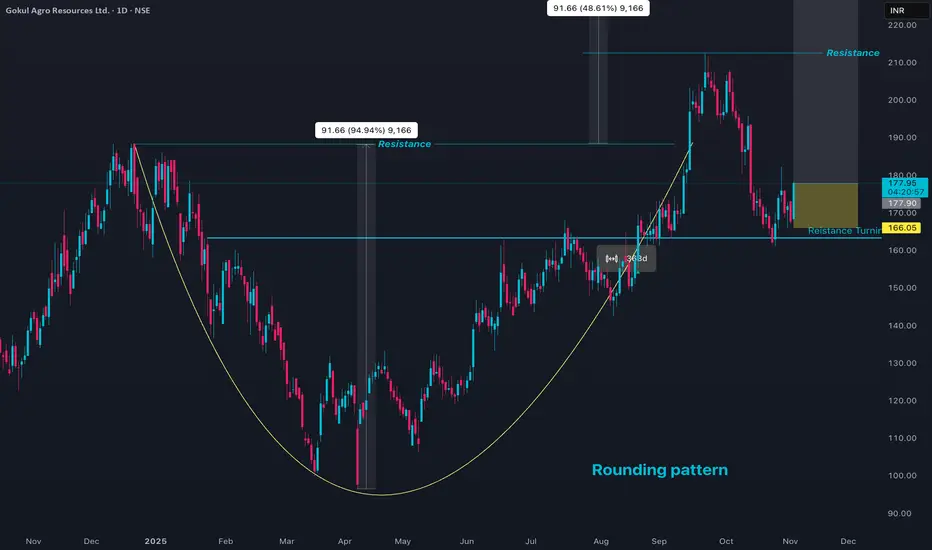
GOKULAGRO Price Action - Rounding patternGokul Agro Resources (GOKULAGRO) is trading around ₹168–₹171 as of early November 2025, down slightly from a recent 52-week high of ₹212.5. The stock has shown significant appreciation over the past 6 months (about +44%) and about +18.6% over the past year. The 52-week low is ₹96.55, indicating the stock is closer to its upper price range in the past year.
Key valuation metrics include a price-to-earnings (P/E) ratio near 19.1 and a price-to-book (P/B) ratio of about 4.9, suggesting the stock is moderately valued relative to its earnings and book value. The company has strong operating metrics with a return on capital employed (ROCE) above 34% and return on equity (ROE) around 27%, indicating efficient capital use and profitability.
The stock is moderately volatile with an average weekly price movement of about 6.3%, slightly above the industry average. Trading volumes are stable and supportive of price action. Recent technical analysis shows the stock trading above its short-term moving averages, with immediate support near ₹160–₹165 and resistance close to ₹175–₹180.
Overall, Gokul Agro Resources demonstrates solid fundamentals, attractive growth metrics, and stable price trends, making it a viable medium-term investment candidate, although caution is warranted if prices near resistance levels.
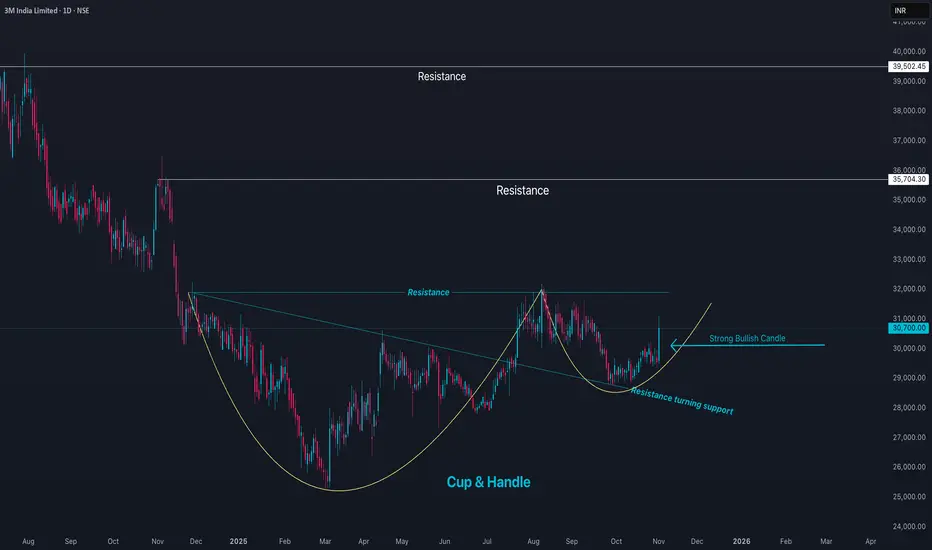
3MINDIA Price Action3M India Limited (3MINDIA) is currently trading around ₹30,865, marking a strong 4.4% rise in the latest session. The stock has a 52-week high near ₹37,133 and a low around ₹25,718, placing it closer to the upper end of its annual range. The market capitalization is approximately ₹33,300 crore.
3M India shows robust financial health with an earnings per share (EPS) of about ₹440 and a high price-to-earnings (P/E) ratio near 69, reflecting premium valuation driven by strong management, innovation, and brand dominance. The stock price recently traded above its 50-day (₹29,941) and 200-day (₹29,348) moving averages, confirming positive momentum.
Profit margins are solid, with an operating margin near 18.9% and net margin around 10.7%. Return on equity (ROE) is high at approximately 24%, and the company’s debt-equity ratio is very low (0.03), indicating a conservative capital structure. Dividend yield is modest at 1.85%. Volume trends indicate steady investor interest.
Technically, the stock is in an uptrend with nearest support at around ₹29,500 and resistance near the 52-week high zone around ₹37,000. Overall, 3M India maintains a strong market position, consistent earnings growth, and solid fundamentals, supporting a positive medium- to long-term outlook barring broader market disruptions.
DELHIVERYStrong Breakout Candidates!
#DELHIVERY
1- Bottom Formation bo. (Above 490)
2- Uptrend is Still Intact
3- Trading above all key moving averages
Keep on Radar.
Potential Upside Stocks!
#Disclaimer: View shared it for educational purposes only.
Follow for more upcoming charts.

USDJPY – Weekly Triangle Near a Big Decision !!The pair has been stuck inside a large weekly triangle formation, compressing price action after years of volatility. These types of structures usually lead to powerful breakouts, and the direction will depend on how the BoJ policy stance and the Fed’s rate cut cycle unfold.
Chart validation:
Price is coiling between lower highs and higher lows the classic look of a triangle consolidation.
Resistance sits around 162, with the upper bound of the triangle capping rallies.
Support near 137–138 has been holding the downside so far.
The breakout path points to two extremes:
Upside projection: A clean break could open a run towards 175–176.
Downside projection: A bearish resolution could drag it back to 127, the lower long-term support.
Key takeaway:
For now, USDJPY is neutral but building energy.
The next decisive move will be sparked by central bank divergence if the Fed cuts faster than the BoJ tightens, the yen could strengthen and break lower; if the BoJ holds back and the Fed stays cautious, the pair could rip higher.
We should wait for confirmation outside this triangle before positioning for the next trend. Trade safe !

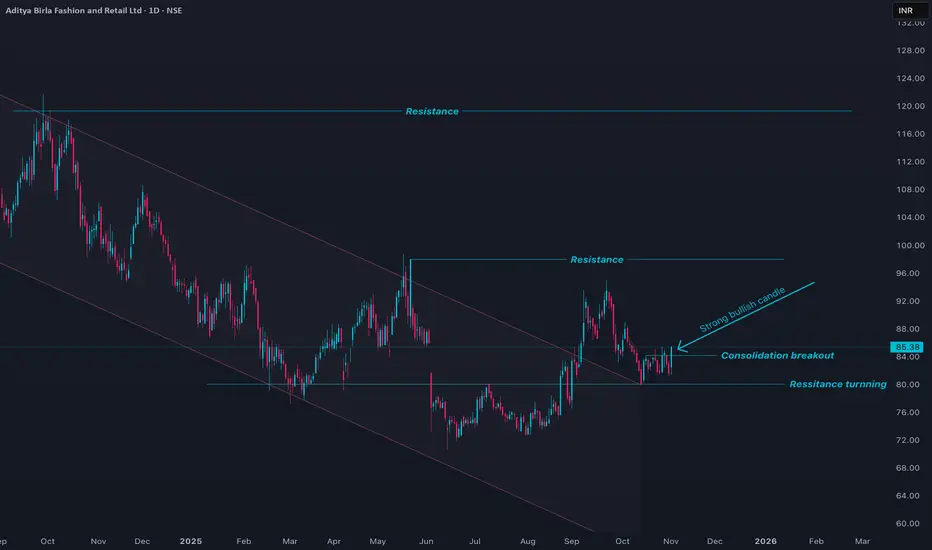
ABFRL Price ActionABFRL is currently trading near ₹85, reflecting a 4.5% gain in the latest session, but the stock remains deep in a correction from its 52-week high of ₹325. The year low is ₹70.55, so the recent rebound has been minor relative to the overall downtrend. Trading volumes are robust (7.8 million shares), but average volumes over the past three months exceed 9.5 million, indicating continued speculative interest and some exit activity by major holders.
Financials remain pressured: the company reports negative earnings per share (EPS 4.69) and a negative P/E ratio of .82, due to sustained losses in recent quarters. The stock trades below its 200-day moving average (4.7), underlining the long-term downtrend. Revenue contraction, negative compounded sales growth over 3 and 5 years, and declining promoter holdings further emphasize weak sentiment and a lack of fundamental support for an immediate turnaround. Return on equity (ROE) stays negative (0.9%).
Technically, ABFRL exhibits resistance at 00 and support in the 0–75 zone. The stock remains vulnerable to further corrections given its low profitability, high debt, and weak recovery signs, even as short-term volatility drives occasional rebounds. Caution is warranted for fresh positions, and any medium-term accumulation should be considered only with strict risk management and awareness of sector headwinds.