DowJones (DJI) IntraSwing Levels: 13th-14th Jan 2026 (2:30 am)DowJones (DJI) IntraSwing Levels: 13th-14th Jan 2026 (2:30 am)
Screen shot of first 15 min in 5 min TF
💥Level Interpretation / description:
L#1: If the candle crossed & stays above the “Buy Gen”, it is treated / considered as Bullish bias.
L#2: Possibility / Probability of REVERSAL near RLB#1 & UBTgt
L#3: If the candle stays above “Sell Gen” but below “Buy Gen”, it is treated / considered as Sidewise. Aggressive Traders can take Long position near “Sell Gen” either retesting or crossed from Below & vice-versa i.e. can take Short position near “Buy Gen” either retesting or crossed downward from Above.
L#4: If the candle crossed & stays below the “Sell Gen”, it is treated / considered a Bearish bias.
L#5: Possibility / Probability of REVERSAL near RLS#1 & USTgt
HZB (Buy side) & HZS (Sell side) => Hurdle Zone,
*** Specialty of “HZB#1, HZB#2 HZS#1 & HZS#2” is Sidewise (behaviour in Nature)
Rest Plotted and Mentioned on Chart
Color code Used:
Green =. Positive bias.
Red =. Negative bias.
RED in Between Green means Trend Finder / Momentum Change
/ CYCLE Change and Vice Versa.
Notice One thing: HOW LEVELS are Working.
Use any Momentum Indicator / Oscillator or as you "USED to" to Take entry.
━━━━━━━━━━━━━━━━━━━━━━━━━━━━━━━━━━━━━━━━━━━
⚠️ DISCLAIMER:
The information, views, and ideas shared here are purely for educational and informational purposes only. They are not intended as investment advice or a recommendation to buy, sell, or hold any financial instruments. I am not a SEBI-registered financial adviser.
Trading and investing in the stock market involves risk, and you should do your own research and analysis. You are solely responsible for any decisions made based on this research.
"As HARD EARNED MONEY IS YOUR's, So DECISION SHOULD HAVE TO BE YOUR's".
━━━━━━━━━━━━━━━━━━━━━━━━━━━━━━━━━
❇️ Follow notification about periodical View
💥 Do Comment for Stock WEEKLY Level Analysis.🚀
📊 Do you agree with this view?
✈️ HIT THE PLANE ICON if this technical observation resonates with you. It will Motivate me.
Beyond Technical Analysis

SILVERM IntraSwing Levels for 13th JAN 2026🚀 SILVERM Profit Booking Ahead.
👇🏼 Monthly PCR.
Put OI: 33,811, Call OI: 20,181, PCR: 1.68
Intraday PCR Change data:
Put OI Chg: 263, Call OI Chg: 2,037, Ch. OI PCR: 0.13
💥Level Interpretation / description:
L#1: If the candle crossed & stays above the “Buy Gen”, it is treated / considered as Bullish bias.
L#2: Possibility / Probability of REVERSAL near RLB#1 & UBTgt
L#3: If the candle stays above “Sell Gen” but below “Buy Gen”, it is treated / considered as Sidewise. Aggressive Traders can take Long position near “Sell Gen” either retesting or crossed from Below & vice-versa i.e. can take Short position near “Buy Gen” either retesting or crossed downward from Above.
L#4: If the candle crossed & stays below the “Sell Gen”, it is treated / considered a Bearish bias.
L#5: Possibility / Probability of REVERSAL near RLS#1 & USTgt
HZB (Buy side) & HZS (Sell side) => Hurdle Zone,
*** Specialty of “HZB#1, HZB#2 HZS#1 & HZS#2” is Sidewise (behaviour in Nature)
Rest Plotted and Mentioned on Chart
Color code Used:
Green =. Positive bias.
Red =. Negative bias.
RED in Between Green means Trend Finder / Momentum Change
/ CYCLE Change and Vice Versa.
Notice One thing: HOW LEVELS are Working.
Use any Momentum Indicator / Oscillator or as you "USED to" to Take entry.
━━━━━━━━━━━━━━━━━━━━━━━━━━━━━━━━━━━━━━━━━━━
⚠️ DISCLAIMER:
The information, views, and ideas shared here are purely for educational and informational purposes only. They are not intended as investment advice or a recommendation to buy, sell, or hold any financial instruments. I am not a SEBI-registered financial adviser.
Trading and investing in the stock market involves risk, and you should do your own research and analysis. You are solely responsible for any decisions made based on this research.
"As HARD EARNED MONEY IS YOUR's, So DECISION SHOULD HAVE TO BE YOUR's".
━━━━━━━━━━━━━━━━━━━━━━━━━━━━━━━━━
❇️ Follow notification about periodical View
💥 Do Comment for Stock WEEKLY Level Analysis.🚀
📊 Do you agree with this view?
✈️ HIT THE PLANE ICON if this technical observation resonates with you. It will Motivate me.


AUUSD (ONDA) IntraSwing Levels for 13th - 14th JAN2026(3.30 am)XAUUSD (ONDA) IntraSwing Levels for 13th - 14th JAN2026(3.30 am)
💥Level Interpretation / description:
L#1: If the candle crossed & stays above the “Buy Gen”, it is treated / considered as Bullish bias.
L#2: Possibility / Probability of REVERSAL near RLB#1 & UBTgt
L#3: If the candle stays above “Sell Gen” but below “Buy Gen”, it is treated / considered as Sidewise. Aggressive Traders can take Long position near “Sell Gen” either retesting or crossed from Below & vice-versa i.e. can take Short position near “Buy Gen” either retesting or crossed downward from Above.
L#4: If the candle crossed & stays below the “Sell Gen”, it is treated / considered a Bearish bias.
L#5: Possibility / Probability of REVERSAL near RLS#1 & USTgt
HZB (Buy side) & HZS (Sell side) => Hurdle Zone,
*** Specialty of “HZB#1, HZB#2 HZS#1 & HZS#2” is Sidewise (behaviour in Nature)
Rest Plotted and Mentioned on Chart
Color code Used:
Green =. Positive bias.
Red =. Negative bias.
RED in Between Green means Trend Finder / Momentum Change
/ CYCLE Change and Vice Versa.
Notice One thing: HOW LEVELS are Working.
Use any Momentum Indicator / Oscillator or as you "USED to" to Take entry.
━━━━━━━━━━━━━━━━━━━━━━━━━━━━━━━━━━━━━━━━━━━
⚠️ DISCLAIMER:
The information, views, and ideas shared here are purely for educational and informational purposes only. They are not intended as investment advice or a recommendation to buy, sell, or hold any financial instruments. I am not a SEBI-registered financial adviser.
Trading and investing in the stock market involves risk, and you should do your own research and analysis. You are solely responsible for any decisions made based on this research.
"As HARD EARNED MONEY IS YOUR's, So DECISION SHOULD HAVE TO BE YOUR's".
━━━━━━━━━━━━━━━━━━━━━━━━━━━━━━━━━
❇️ Follow notification about periodical View
💥 Do Comment for Stock WEEKLY Level Analysis.🚀
📊 Do you agree with this view?
✈️ HIT THE PLANE ICON if this technical observation resonates with you. It will Motivate me.

NIFTY Analysis for 14th JAN 2026 IntraSwing Spot levelsNIFTY Analysis for 14th JAN 2026 IntraSwing Spot levels
🚀Follow GIFTNIFTY Post for NF levels
b]👇🏼Screen shot of Todays (13th Jan 2026) trade
💥Level Interpretation / description:
L#1: If the candle crossed & stays above the “Buy Gen”, it is treated / considered as Bullish bias.
L#2: Possibility / Probability of REVERSAL near RLB#1 & UBTgt
L#3: If the candle stays above “Sell Gen” but below “Buy Gen”, it is treated / considered as Sidewise. Aggressive Traders can take Long position near “Sell Gen” either retesting or crossed from Below & vice-versa i.e. can take Short position near “Buy Gen” either retesting or crossed downward from Above.
L#4: If the candle crossed & stays below the “Sell Gen”, it is treated / considered a Bearish bias.
L#5: Possibility / Probability of REVERSAL near RLS#1 & USTgt
HZB (Buy side) & HZS (Sell side) => Hurdle Zone,
*** Specialty of “HZB#1, HZB#2 HZS#1 & HZS#2” is Sidewise (behaviour in Nature)
Rest Plotted and Mentioned on Chart
Color code Used:
Green =. Positive bias.
Red =. Negative bias.
RED in Between Green means Trend Finder / Momentum Change
/ CYCLE Change and Vice Versa.
Notice One thing: HOW LEVELS are Working.
Use any Momentum Indicator / Oscillator or as you "USED to" to Take entry.
━━━━━━━━━━━━━━━━━━━━━━━━━━━━━━━━━━━━━━━━━━━
⚠️ DISCLAIMER:
The information, views, and ideas shared here are purely for educational and informational purposes only. They are not intended as investment advice or a recommendation to buy, sell, or hold any financial instruments. I am not a SEBI-registered financial adviser.
Trading and investing in the stock market involves risk, and you should do your own research and analysis. You are solely responsible for any decisions made based on this research.
"As HARD EARNED MONEY IS YOUR's, So DECISION SHOULD HAVE TO BE YOUR's".
━━━━━━━━━━━━━━━━━━━━━━━━━━━━━━━━━
❇️ Follow notification about periodical View
💥 Do Comment for Stock WEEKLY Level Analysis.🚀
📊 Do you agree with this view?
✈️ HIT THE PLANE ICON if this technical observation resonates with you. It will Motivate me.

Has A huge Upside Potential3 Points:
1. China Minmetal is the sole company in the world producing highest amounts of Rare Earth Metals .
2. One such metals is neodymium , and it's safe to say there's huge demand for neodymium magnets.
3. Big companies like tesla and many other EV sector companies depends on the this company directly or indirectly.
The major point being this is solely controlled by China, any day it costs can shoot to the sky high levels.

INDIGO — Resistance Turned Support at a Key Price ZonePrice is reacting around a well-tested level where earlier resistance has flipped into support.
Multiple reactions at this zone show demand stepping in. Watching how price behaves here for confirmation

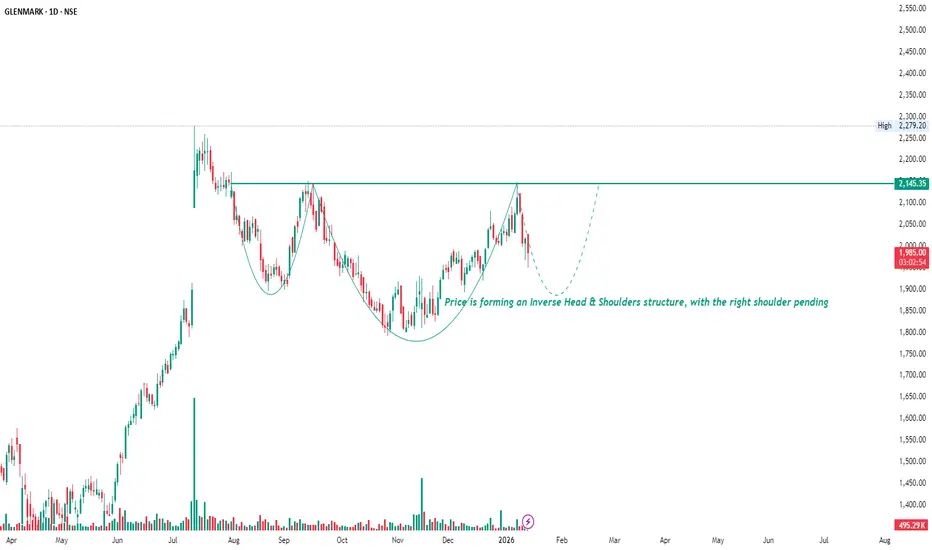
GLENMARK | Pure Structure Play – IH&S FormingGLENMARK is shaping a well-defined Inverse Head & Shoulders (IH&S) structure on the chart.
The left shoulder and head are clearly visible, with the head forming a deeper and broader base.
Price has since recovered and moved back toward the neckline, indicating improving structure.
The right shoulder is still under formation, meaning the pattern is in development, not completed yet.
At this stage, price action remains below the neckline, and the focus should be on how the market behaves while forming the right shoulder — whether it holds above the recent base and maintains symmetry with the left shoulder.
No indicators are involved here — this view is purely based on price structure, balance, and time spent near key levels.
Patience is essential until the structure fully matures.
The US financial sector fall on Trump's credit card interest capThe US Banking & Credit Card Company Stocks Reacted as Expected to Threats of Trump
Stock Prices fall after Trump calls for a 10% credit card interest rate cap
* The index of the top 5 financial institutions fell around 4.5% on Monday
* The index includes Bank of America (BAC), Citigroup (C), Capital One Financial Corp (COF), JPMorgan (JPM), & Wells Fargo (WFC)
Individual stats of the US financial stocks on Monday
1. Capital One: -7%
2. Affirm: -5%
3. American Express -4%
4. Citigroup: -3%
5. MasterCard: -3%
6. Visa: -3%
7. US Bancorp: -3%
8. JP Morgan: -2%
9. Wells Fargo: -2%
10. Bank of America: -1%
The overall banking & financial sector erased around $100 BILLION of market cap on Trump's statement

IFCI 1 Day Time Frame 📌 Live Price (approx current)
• IFCI trading around ₹57–₹58 on NSE today (Jan 13, 2026) — price moves with the market and may vary minute‑to‑minute.
🧱 Daily Support & Resistance (Key Levels)
Resistance Levels (Upside)
🔹 R1 (Immediate): ~₹59–₹60 — first upside barrier where price may stall.
🔹 R2: ~₹62–₹62.20 — next resistance zone above R1.
🔹 R3: ~₹63.5–₹64 — stronger upper resistance on a breakout.
Support Levels (Downside)
🟢 S1 (Immediate): ~₹56.0 — crucial first support zone.
🟢 S2: ~₹54.6 — secondary support level if price dips below S1.
🟢 S3: ~₹52.2–₹52.3 — major lower support zone on a deeper pullback.
Pivot Reference
⭐ Pivot ~₹58.4 — daily equilibrium level around which price may oscillate.
📊 What This Means (Daily View)
Bullish price structure
• Price above recent supports suggests bulls defending lower levels.
• A close above ₹59–₹60 could add momentum toward ₹62+ resistance.
Caution zones
• Failure below ₹56 may see further pullback toward ₹54.6 then ₹52+.
• Daily momentum might fluctuate — use volume and candlestick patterns to confirm moves.
🧠 Quick Take
Bullish bias above ₹59–₹60 with targets near ₹62–₹64;
Bearish risk below ₹56 with deeper support near ₹54.6–₹52.3.
Pivot near ₹58.4 acts as a short‑term balance point for intraday position decisions.

Impact of US Federal Reserve and Interest Rate DecisionsThe Indian Economy:
The monetary policy decisions of the United States Federal Reserve (commonly known as the Fed) have far-reaching consequences beyond the US economy. As the world’s most influential central bank, the Fed’s interest rate actions significantly affect global liquidity, capital flows, currency movements, commodity prices, and investor sentiment. For an emerging economy like India—deeply integrated into global trade and financial systems—changes in Fed rates play a crucial role in shaping economic growth, inflation dynamics, financial markets, and policy responses. Understanding this relationship is essential for policymakers, businesses, investors, and households.
1. The Federal Reserve and Its Global Influence
The Federal Reserve primarily adjusts interest rates to manage inflation, employment, and economic stability in the United States. However, because the US dollar is the world’s reserve currency and US financial markets dominate global capital flows, Fed rate decisions influence borrowing costs and investment decisions worldwide. When the Fed raises interest rates, global liquidity tends to tighten; when it cuts rates, liquidity expands. These shifts directly and indirectly affect emerging markets like India.
2. Capital Flows and Foreign Investment in India
One of the most immediate impacts of Fed rate changes on India is through foreign capital flows. When the Fed raises rates, US assets become more attractive due to higher yields and lower perceived risk. This often leads to Foreign Institutional Investors (FIIs) pulling money out of emerging markets, including India, and reallocating it to US bonds and equities. Such outflows can lead to volatility in Indian equity and debt markets.
Conversely, when the Fed pauses or cuts rates, global investors search for higher returns, making India an attractive destination due to its relatively strong growth prospects. This can result in increased foreign portfolio investment, boosting stock markets and improving liquidity conditions.
3. Impact on the Indian Rupee and Exchange Rates
Fed rate hikes typically strengthen the US dollar. A stronger dollar puts depreciation pressure on the Indian rupee. Rupee depreciation makes imports—especially crude oil, natural gas, and other commodities—more expensive, contributing to imported inflation. On the other hand, a weaker rupee can benefit exporters by making Indian goods more competitive globally.
When the Fed cuts rates, the dollar often weakens, which can support the rupee. A stable or appreciating rupee helps contain inflation and reduces the cost of imports, but it may slightly reduce export competitiveness. The Reserve Bank of India (RBI) closely monitors these movements and may intervene in forex markets to reduce excessive volatility.
4. Inflation Dynamics and Monetary Policy in India
Fed rate decisions influence global inflation trends and commodity prices, which directly affect India. Higher US interest rates often cool global demand, leading to softer commodity prices. For India, this can reduce inflationary pressures, particularly from oil and metals.
However, capital outflows and currency depreciation caused by Fed hikes can offset these benefits by increasing import costs. In such scenarios, the RBI faces a policy dilemma: whether to raise domestic interest rates to control inflation and stabilize the rupee or to prioritize growth by keeping rates accommodative.
When the Fed adopts an easing stance, global liquidity increases, often pushing commodity prices higher. While this supports global growth, it can raise inflation risks for India, forcing the RBI to act cautiously.
5. Impact on Indian Interest Rates and Borrowing Costs
Although the RBI sets interest rates based on domestic conditions, Fed actions indirectly influence Indian interest rates. Persistent Fed tightening can pressure the RBI to maintain relatively higher rates to prevent excessive capital outflows and currency instability. This leads to higher borrowing costs for Indian businesses and consumers, affecting investment, housing demand, and consumption.
In contrast, a dovish Fed provides the RBI with more room to cut rates or maintain an accommodative stance, supporting credit growth and economic expansion.
6. Effects on Indian Equity Markets
Indian stock markets are highly sensitive to global monetary conditions. Fed rate hikes generally lead to risk aversion, causing corrections in equities, especially in sectors dependent on foreign capital such as IT, banking, and real estate. Growth stocks often underperform during high interest rate cycles due to higher discount rates.
On the other hand, Fed rate cuts or expectations of easing usually fuel global equity rallies. Indian markets benefit from increased foreign inflows, improved liquidity, and positive sentiment, often leading to higher valuations.
7. Impact on Debt Markets and Government Borrowing
Fed tightening can raise global bond yields, influencing Indian government securities (G-Secs). Higher yields increase borrowing costs for the Indian government, potentially widening fiscal deficits. Corporate bond yields may also rise, making debt financing more expensive for companies.
When the Fed eases, global yields tend to soften, which can help lower Indian bond yields, ease government borrowing pressures, and support infrastructure and development spending.
8. Trade, Exports, and Global Demand
Fed rate decisions influence the pace of global economic growth. Aggressive rate hikes can slow down the US and global economy, reducing demand for Indian exports such as IT services, pharmaceuticals, textiles, and engineering goods. This can negatively impact India’s trade balance and corporate earnings.
A dovish Fed stance, encouraging global growth, can boost export demand and improve India’s external sector performance.
9. RBI’s Strategic Response to Fed Actions
The RBI does not mechanically follow the Fed but considers its actions while formulating policy. India’s strong foreign exchange reserves, improving macroeconomic fundamentals, and domestic demand provide some insulation. The RBI uses a combination of interest rate adjustments, liquidity management, and forex interventions to mitigate the spillover effects of Fed policies.
10. Long-Term Perspective for India
In the long run, India’s economic trajectory depends more on domestic reforms, productivity growth, fiscal discipline, and structural factors than on external monetary cycles. However, Fed rate decisions remain an important external variable that can influence short- to medium-term volatility.
Conclusion
The US Federal Reserve’s interest rate decisions have a profound and multi-dimensional impact on the Indian economy. From capital flows and currency movements to inflation, interest rates, and market sentiment, Fed actions shape India’s macroeconomic environment. While India has built resilience through strong reserves and prudent policymaking, it cannot remain completely immune to global monetary shifts. A balanced and flexible policy approach by the RBI, combined with structural economic strength, is key to navigating the challenges and opportunities arising from changing Fed rate cycles.

BSHSL | Agriculture Stock to Watch | Pre-Budget Technical StudyBombay Super Hybrid Seeds Ltd (BSHSL)
With the Union Budget approaching on 1st Feb and Agriculture expected to remain a key focus sector, BSHSL is showing an interesting technical structure after a prolonged correction.
This study highlights important price levels, trend context, and what to watch next.
📉 Primary Trend
Stock is still trading below the long-term 200 EMA, indicating a broader bearish trend
However, the rate of decline has slowed, suggesting selling pressure is reducing
🧱 Support Zone (Demand Area)
₹95 – ₹100 is a strong historical demand zone
Price has reacted positively multiple times from this range
This zone acts as a risk-defined area for positional tracking
📊 Immediate Resistance Levels
₹105 – ₹108 → First short-term supply zone
₹112 – ₹115 → Breakdown + EMA resistance zone
A sustained move above these levels can change short-term structure
📈 Volume Insight
A recent volume spike near the bottom indicates accumulation interest
Volume confirmation is important for any upside continuation
📉 Relative Strength (RS) vs NIFTY
RS remains below zero, showing underperformance
However, RS is flattening, which often appears before sector rotation or reversal attempts
🎯 What Makes This Stock Interesting Now?
🌾 Agriculture is a budget-favored theme
📉 Stock has already corrected significantly
🧱 Price is holding above a key demand base
🔄 Possible base-building phase underway
🧠 Conclusion:
BSHSL is not yet in a confirmed uptrend, but the stock is at an important decision zone.
A budget-triggered move with volume could bring fresh momentum, while the support zone helps define risk.
⚠️ Disclaimer:
This is not a buy or sell recommendation.
Shared purely for educational and study purposes.
Always do your own research and follow risk management.

GIFTNIFTY IntraSwing Levels for 13th JAN 2026GIFTNIFTY IntraSwing Levels for 13th JAN 2026
💥Level Interpretation / description:
L#1: If the candle crossed & stays above the “Buy Gen”, it is treated / considered as Bullish bias.
L#2: Possibility / Probability of REVERSAL near RLB#1 & UBTgt
L#3: If the candle stays above “Sell Gen” but below “Buy Gen”, it is treated / considered as Sidewise. Aggressive Traders can take Long position near “Sell Gen” either retesting or crossed from Below & vice-versa i.e. can take Short position near “Buy Gen” either retesting or crossed downward from Above.
L#4: If the candle crossed & stays below the “Sell Gen”, it is treated / considered a Bearish bias.
L#5: Possibility / Probability of REVERSAL near RLS#1 & USTgt
HZB (Buy side) & HZS (Sell side) => Hurdle Zone,
*** Specialty of “HZB#1, HZB#2 HZS#1 & HZS#2” is Sidewise (behaviour in Nature)
Rest Plotted and Mentioned on Chart
Color code Used:
Green =. Positive bias.
Red =. Negative bias.
RED in Between Green means Trend Finder / Momentum Change
/ CYCLE Change and Vice Versa.
Notice One thing: HOW LEVELS are Working.
Use any Momentum Indicator / Oscillator or as you "USED to" to Take entry.
━━━━━━━━━━━━━━━━━━━━━━━━━━━━━━━━━━━━━━━━━━━
⚠️ DISCLAIMER:
The information, views, and ideas shared here are purely for educational and informational purposes only. They are not intended as investment advice or a recommendation to buy, sell, or hold any financial instruments. I am not a SEBI-registered financial adviser.
Trading and investing in the stock market involves risk, and you should do your own research and analysis. You are solely responsible for any decisions made based on this research.
"As HARD EARNED MONEY IS YOUR's, So DECISION SHOULD HAVE TO BE YOUR's".
━━━━━━━━━━━━━━━━━━━━━━━━━━━━━━━━━
❇️ Follow notification about periodical View
💥 Do Comment for Stock WEEKLY Level Analysis.🚀
📊 Do you agree with this view?
✈️ HIT THE PLANE ICON if this technical observation resonates with you. It will Motivate me.
━━━━━━━━━━━━━━━━━━━━━━━━━━━━━━━━━
💡 If You LOOKING any CHART, You want me to ANALYZE?
Share your desired stock names in the comments below! I will try to analyze the chart patterns and share my technical view (so far my Knowledge).
If Viewers think It can identify meaningful setups. Looking forward to hearing from all of you — let's keep this discussion going and help each other make better trading decisions.

BTCUSD · 15M · SMC BiasPrice is currently compressing inside a higher-timeframe premium discount equilibrium, respecting a clear range structure.
HTF Context
Equal highs / liquidity resting above the range highs.
Premium zone overhead aligned with prior supply + inducement.
Discount zone below marked by clean HTF demand.
LTF Narrative
Market already delivered a strong impulsive leg up.
Current consolidation suggests liquidity engineering, not continuation.
Upside push toward the equal highs is likely a liquidity grab, not acceptance.
Expectation
Sweep of buy-side liquidity into the premium zone.
Immediate reaction from supply.
Sharp displacement to the downside targeting:
Range low
Discount imbalance
HTF demand below
Execution Plan
No chasing longs in premium.
Wait for:
Liquidity sweep above highs
Bearish displacement
LTF MSS confirmation
Shorts favored post confirmation.
Targets trail into discount until opposing demand shows intent.

RELIANCE: Major Weekly Breakout & Long SetupTechnical Analysis
Structure Breakout: The stock has successfully broken out above a key multi-month resistance level at 1592.30 (marked by the green horizontal line). This level previously acted as a significant supply zone, forming the rim of a potential bullish consolidation pattern (resembling a Cup & Handle or Rounding Bottom).
Momentum: The recent weekly candles show strong bullish momentum, pushing through the resistance with conviction. The price is now sustaining above this breakout point, which validates the bullish thesis.
Trend Continuation: After a period of correction and consolidation, the primary uptrend seems to be resuming. The Higher High (HH) formation on the weekly chart confirms the strength of buyers.
Risk/Reward: The setup offers an excellent Risk-to-Reward ratio (approximately 1:3), making it a high-probability trade for positional traders.
Trade Setup (Long)
Entry Zone: 1592 - 1600 (On the retest or continuation above the breakout level)
Stop Loss: 1509.15 (Placed below the breakout candle and recent swing structure to invalidate the thesis)
Target: 1855.60 (Projected measured move based on the depth of the previous consolidation)
Potential R:R: ~ 1:3.1
⚠️ Disclaimer: This analysis is for educational purposes only and does not constitute financial advice. I am not a SEBI registered analyst. Trading involves risk; please consult your financial advisor and conduct your own analysis before executing any trades.

LTFOODS SHORTTrade Rationale
LT Foods is mirroring the broader weakness in the rice exports sector. The stock has broken below its short-term pivot and is facing resistance from the 5-SMA (374.66) and 10-SMA (381.37).
Price Action: Rejection at the 365–367 zone.
Momentum: The MACD is bearish, and the ADX at 28.58 indicates a strengthening downward trend.
Trade Parameters
Level Type,Price Level
Current Price,365.00
Stop Loss (SL),374.90 (Above immediate resistance)
Take Profit (TP),320.70 (Next structural support)
Risk/Reward,1:3.5
⚠️ DISCLAIMER
Educational Use: These setups are for educational purposes only.
Market Risk: Stock trading involves high risk. KRBL and LT Foods are volatile assets with betas above 1.0.
Verification: Perform your own due diligence before entering any trade.

KRBL SHORTShort Setup: KRBL Limited (NSE: KRBL)
Market Context
KRBL is currently exhibiting a strong bearish trend on the intraday timeframe. The stock has faced persistent selling pressure, declining approximately 9.5% over the last month and nearly 8% in the past week. It is currently trading well below its major moving averages, including the 50, 100, and 200-day SMAs.
Technical Setup
The provided 15-minute chart indicates a breakdown from recent consolidation levels, targeting long-term support zones.
Pattern: Distribution followed by a breakdown below the 360 psychological level.
Momentum: Technical indicators like the MACD and multiple Moving Averages (5-SMA to 200-SMA) are signaling bearish momentum. The Stoch RSI indicates an oversold condition, which may lead to a minor relief pullback before further decline.
Level Type,Price Level
Current Market Price (CMP),356.00
Entry Range,356.00 – 363.00 (Pullback entry preferred)
Stop Loss (SL), 375.60
Take Profit 1 (TP1),310.00 (Intermediate psychological support)
Take Profit 2 (TP2),288.70 (Primary target/long-term support zone)
Risk/Reward Ratio,~1:1.8 to 1:2.0 (depending on entry)
⚠️ DISCLAIMER
Educational Purpose Only: This analysis is for informational purposes and does not constitute financial advice.
Risk Warning: Trading involves significant risk. KRBL has high volatility (Beta ~1.63).
Due Diligence: Always use your own analysis and risk management strategies before entering a trade.

GRM OVERSEAS SHORT Short Setup: GRM Overseas (GRMOVER )
Trade Overview
Asset: GRM Overseas Ltd (NSE: GRMOVER)
Timeframe: 15-Minute
Position: Short (Sell)
Strategy: Rejection at resistance following a recent distribution phase.
Technical Analysis
The stock has shown significant volatility in early January. After hitting a high near 175.50, it has struggled to maintain upward momentum.
Price Action: The chart shows a failure to sustain levels above 172. The current price is hovering around the 170 mark, which is acting as a pivot point.
Risk/Reward: This setup targets a move back toward the lower support zones established in late December.
Recent Context: The stock recently processed a 2:1 bonus issue (late December 2025), which has increased liquidity but also led to profit-booking at higher levels.
Level Type,Price Level
Entry Range,168.50 – 170.20
Stop Loss (SL),174.80 (Above recent swing high)
Take Profit (TP),146.00 (Targeting major support)
Risk/Reward Ratio,Approx. 1:4.5
Based on the chart provided and the current market data for Tuesday, January 13, 2026, here is a draft for your TradingView Publication.
This trade setup focuses on a Short (Bearish) position for GRMOVER (GRM Overseas Ltd) on the 15-minute timeframe.
Short Setup: GRM Overseas (GRMOVER)
Trade Overview
Asset: GRM Overseas Ltd (NSE: GRMOVER)
Timeframe: 15-Minute
Position: Short (Sell)
Strategy: Rejection at resistance following a recent distribution phase.
Technical Analysis
The stock has shown significant volatility in early January. After hitting a high near 175.50, it has struggled to maintain upward momentum.
Price Action: The chart shows a failure to sustain levels above 172. The current price is hovering around the 170 mark, which is acting as a pivot point.
Risk/Reward: This setup targets a move back toward the lower support zones established in late December.
Recent Context: The stock recently processed a 2:1 bonus issue (late December 2025), which has increased liquidity but also led to profit-booking at higher levels.
Trade Parameters
Level Type Price Level
Entry Range 168.50 – 170.20
Stop Loss (SL) 174.80 (Above recent swing high)
Take Profit (TP) 146.00 (Targeting major support)
Risk/Reward Ratio Approx. 1:4.5
Market Sentiment & Risks
Bearish Trigger: A break below the 165 support level would confirm the downward momentum toward the primary target.
Risk Note: GRM Overseas is currently in a "Strong Trend" phase (ADX ~39). If the broader FMCG sector rallies, the stop loss at 174.81 must be strictly honored to avoid a squeeze back toward the 52-week high of 185.45.
⚠️⚠️⚠️⚠️⚠️⚠️ DISCLAIMER⚠️⚠️⚠️⚠️⚠️⚠️⚠️
Educational Purpose Only: The information, charts, and analysis provided in this post are for educational and informational purposes only. They do not constitute financial, investment, or trading advice.
Risk Warning: Trading stocks, futures, and options involves significant risk of loss and is not suitable for every investor. You should only trade with capital you can afford to lose.
No Guarantees: Past performance is not indicative of future results. There is no guarantee that the setup described will result in a profit or that the price levels mentioned will be reached.
Personal Due Diligence: I am not a SEBI-registered advisor (or your local equivalent). Always perform your own research and consult with a certified financial professional before making any investment decisions.
Independence: The author of this post shall not be held liable for any financial losses or damages incurred as a result of using this information.


DowJones (DJI) IntraSwing Levels for 12th-13th Jan '26 (2:30 am)DowJones (DJI) IntraSwing Levels for 12th-13th Jan 2026 (2:30 am)
👇🏼Screen shot of Todays (12th Jan 2026 till now) movement
💥Level Interpretation / description:
L#1: If the candle crossed & stays above the “Buy Gen”, it is treated / considered as Bullish bias.
L#2: Possibility / Probability of REVERSAL near RLB#1 & UBTgt
L#3: If the candle stays above “Sell Gen” but below “Buy Gen”, it is treated / considered as Sidewise. Aggressive Traders can take Long position near “Sell Gen” either retesting or crossed from Below & vice-versa i.e. can take Short position near “Buy Gen” either retesting or crossed downward from Above.
L#4: If the candle crossed & stays below the “Sell Gen”, it is treated / considered a Bearish bias.
L#5: Possibility / Probability of REVERSAL near RLS#1 & USTgt
HZB (Buy side) & HZS (Sell side) => Hurdle Zone,
*** Specialty of “HZB#1, HZB#2 HZS#1 & HZS#2” is Sidewise (behaviour in Nature)
Rest Plotted and Mentioned on Chart
Color code Used:
Green =. Positive bias.
Red =. Negative bias.
RED in Between Green means Trend Finder / Momentum Change
/ CYCLE Change and Vice Versa.
Notice One thing: HOW LEVELS are Working.
Use any Momentum Indicator / Oscillator or as you "USED to" to Take entry.
━━━━━━━━━━━━━━━━━━━━━━━━━━━━━━━━━━━━━━━━━━━
⚠️ DISCLAIMER:
The information, views, and ideas shared here are purely for educational and informational purposes only. They are not intended as investment advice or a recommendation to buy, sell, or hold any financial instruments. I am not a SEBI-registered financial adviser.
Trading and investing in the stock market involves risk, and you should do your own research and analysis. You are solely responsible for any decisions made based on this research.
"As HARD EARNED MONEY IS YOUR's, So DECISION SHOULD HAVE TO BE YOUR's".
━━━━━━━━━━━━━━━━━━━━━━━━━━━━━━━━━
❇️ Follow notification about periodical View
💥 Do Comment for Stock WEEKLY Level Analysis.🚀
📊 Do you agree with this view?
✈️ HIT THE PLANE ICON if this technical observation resonates with you. It will Motivate me.

Will Asian Paints see a big move? Let's know through astrologyFriends, today we'll discuss how planetary influences affect a stock, and how this influence will be positive over the next two months, using astrology as our guide. We'll talk about how to understand this. Let's take Asian Paints as an example.
Asian Paints Ltd is India's largest paint company and is no longer limited to just paint, but has become a major player in the field of "Home Decor". According to astrology, the influence of planets on its products and business models is as follows:
1. Venus - The main and dominant planet
Since paint is directly related to beauty, decoration, colors and luxury, Venus has the most influence on this company.
Color and Gloss : The gloss of the walls (Royale, Glitz) and selection of colors are subject to Venus.
Home Decor : The company now also sells furniture, curtains, lighting and wallpaper (Nilaya), which is completely Venus energy.
Luxury Branding : Premium paints and designer collections reflect the influence of Venus.
2. Saturn - Chemistry and manufacturing
Chemicals, pigments and petroleum products are used in the process of making paints, which are factors of Saturn.
Industrial Base : Asian Paints have large manufacturing plants, indicating Saturn's discipline and industrial strength.
Waterproofing : Protection and waterproofing of walls (Smart Care) is associated with Saturn's attribute of 'security and durability'.
3. Mars - Security and Real Estate
Paint is mainly used for the protection of buildings and houses (Real Estate). Mars is the signifier of land and buildings in astrology.
Industrial Coatings : The company also manufactures paints for automotive and large industries (Industrial Coatings), which is part of Mangal's technical energy.
Protection : Coating walls to protect them from sun and rain is the protective tendency of Mars.
4. Mercury - Distribution and Logistics
The biggest strength of Asian Paints is its Supply Chain and Distributor Network.
Business Intelligence: Just-in-time delivery of paint and excellent inventory management reflect Mercury's business intelligence.
Color Consultancy: Features like digital color tools and paint budget calculator also come under Mercury.
Astrological Profile Summary (as of 2026):
Business segment related planets
Paints & Colors Venus
Home Decor & Furnishings Venus
Chemicals & Raw Materials Saturn
Waterproofing & Industrial (Safety) Mars & Saturn
Supply Chain & Distribution (Network) Mercury
Conclusion:
Asian Paints is a Venus-Saturn-Mercury company.
Venus gives it charm and beauty in market.
Saturn gives it strength in chemicals and production.
Mercury gives it unmatched network reach to every corner of India.
Friends , although this is part of India's Nifty 50 index and a leading company, so that we will use the Indian national astrological horoscope for reference. As we discussed in our article of January 11, 2026 (Vedic Astrology and the Indian Stock Market) regarding India's horoscope and what 2026 would be like, we now know that according to the Indian financial horoscope, the benefic planet Saturn, which rules the ninth and tenth houses, is currently situated in the eleventh house, Pisces, which is the house of success.
1) Saturn entered Pisces on March 29, 2025
2) Mars entering Sagittarius December 8, 2025, to mid-January 2026, after that Capricorn for 45 days.
3) Tomorrow (13-01-2026), Venus will move into the Capricorn zodiac sign. In the Indian horoscope, this planet is the lord of the ascendant and is transiting into the ninth house (the house of fortune).
Now, if most important planets are in favorable positions, the outcome should be good. Let's see how much progress we can make in the next two months.
Friends, if you like my effort, please give it a like! Your Like give us great inspiration.

Gold 📌 ASSET: XAUUSD (Gold Spot / USD)
🕒 SESSION: London → NY
📊 ENTRY TYPE: Sell on premium retrace
🔴 BIAS: Bearish continuation
🎯 ENTRY: 4602.609
⛔ SL: 4619.368
🥇 TP1: 4588.295
🥈 TP2: 4565.000
🥉 TP3: 4545.011
🧠 REASON:
• Buy-side liquidity taken near London high, failure to sustain above premium
• Sellers positioned below resistance with expansion toward lower demand
⚠️ RISK:
Single execution only; invalidate strictly above SL; no averaging
— Triple7Capital ♠️📉
━━━━━━━━━━━━━━━━━━

Dow Future (DJI) IntraSwing Levels: 12th-13th Jan 2026 (2:30am)💥Level Interpretation / description:
L#1: If the candle crossed & stays above the “Buy Gen”, it is treated / considered as Bullish bias.
L#2: Possibility / Probability of REVERSAL near RLB#1 & UBTgt
L#3: If the candle stays above “Sell Gen” but below “Buy Gen”, it is treated / considered as Sidewise. Aggressive Traders can take Long position near “Sell Gen” either retesting or crossed from Below & vice-versa i.e. can take Short position near “Buy Gen” either retesting or crossed downward from Above.
L#4: If the candle crossed & stays below the “Sell Gen”, it is treated / considered a Bearish bias.
L#5: Possibility / Probability of REVERSAL near RLS#1 & USTgt
HZB (Buy side) & HZS (Sell side) => Hurdle Zone,
*** Specialty of “HZB#1, HZB#2 HZS#1 & HZS#2” is Sidewise (behaviour in Nature)
Rest Plotted and Mentioned on Chart
Color code Used:
Green =. Positive bias.
Red =. Negative bias.
RED in Between Green means Trend Finder / Momentum Change
/ CYCLE Change and Vice Versa.
Notice One thing: HOW LEVELS are Working.
Use any Momentum Indicator / Oscillator or as you "USED to" to Take entry.
━━━━━━━━━━━━━━━━━━━━━━━━━━━━━━━━━━━━━━━━━━━
⚠️ DISCLAIMER:
The information, views, and ideas shared here are purely for educational and informational purposes only. They are not intended as investment advice or a recommendation to buy, sell, or hold any financial instruments. I am not a SEBI-registered financial adviser.
Trading and investing in the stock market involves risk, and you should do your own research and analysis. You are solely responsible for any decisions made based on this research.
"As HARD EARNED MONEY IS YOUR's, So DECISION SHOULD HAVE TO BE YOUR's".
━━━━━━━━━━━━━━━━━━━━━━━━━━━━━━━━━
❇️ Follow notification about periodical View
💥 Do Comment for Stock WEEKLY Level Analysis.🚀
📊 Do you agree with this view?
✈️ HIT THE PLANE ICON if this technical observation resonates with you. It will Motivate me.
