Technicals are amazingly beautiful Look at the movement of the price from the chart. Is it amazingly good. All we need to do in this chart is for years we would have been went for buy at support and sell at the trend line resistance. It works all these years perfect.
learn technicals and enjoy each and every trade you take.
Tradersasi.
Bhartiairtel

Bharti Airtel showing walking the band of weaknessNSE: BHARTIARTL - We can see that the correction in Bharti Airtel is getting deeper as the stock cutting lower band so next two days more selling can come due to large-cap offloading by funds.
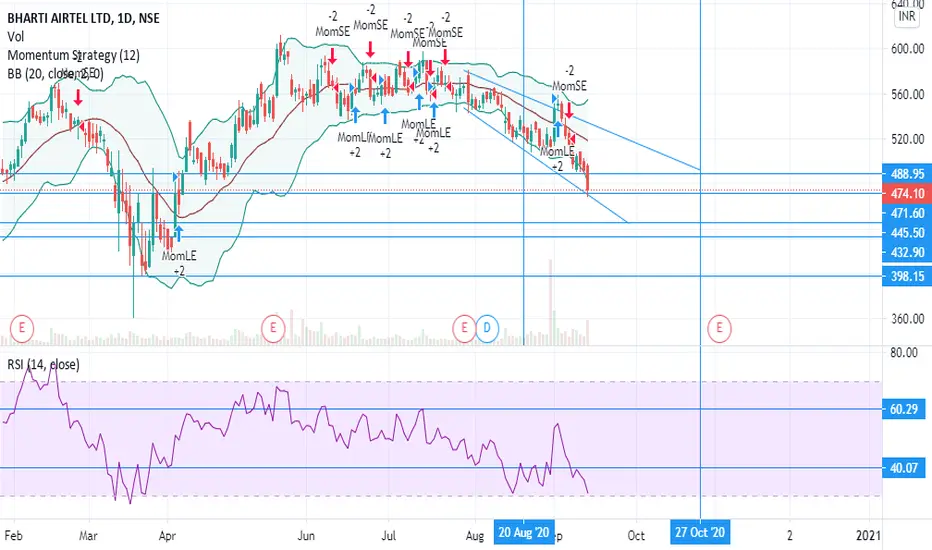

Bharti Airtel long at 485Bharti Airtel should find good support around 485. Can go long here. Stock is good for long term also.

BharatI Airtel - Beautiful Long-side Setup !!! #Ewroxx What an amazing risk to reward ! wohooo ! 16:1 & 33:1 :)

Bharti Airtel standing a support zoneBharti Airtel is at the support level and respecting the channel pattern having chances to trade in the channel, If it breaks the support line it may fall.


Buy BhartiAirtel if it sustains 553+ , tgts 560,563Please consider Price action before jumping into the trade.


BHARTI AIRTELDon't take long position until it break 550 level on daily candlestick.
Other wise it will on sell side.


BHARTI AIRTEL - DETAILED ANALYSISA lot of people have been desperately waiting for Bharti Airtel Price movement. It will be tiring and exhaustive to see it moving up but more the time it will spent near 500 it will get more space on upside range.
Airtel will be a uptrend stock only but i travelling on lower range on the Channel. Till the time 495 is saved on Weekly Closing basis. Airtel is safe to keep in portfolio. We will move towards 545 once and come to lower end of range and then big move up till 680++

Rounded Top???Looks like its rounded top,,, May be it will take support at 200EMA, otherwise looks like it will hit trend line, lets see...

BHARTI AIRTEL Trade SetupThis Analysis Is Done Only For Educational & Intelligence Purpose, Invest Or Trade At your Own Risk & Will.

BhartiArtl Short Term Analysis 25/08/20a. Zone: Strong Bull
b. Resistance 1: 531.25(Double Top Bearish Pattern)
c. Resistance 2: 538.25(Double Top Bearish Pattern)
d. Support 1: 526.55
e. Support 2: 510.25
NSE:BHARTIARTL

BHARTIAIRTEL Trade!You can short Bharti Airtel because it has recently broken its support around 550, currently trading at 525. next support can be seen on 500.

BHARTI AIRTEL LIMITED -1D chart - BullishBHARTI AIRTEL LIMITED trading in channel , now its trading at channel lower line.
Bulls can have look on this.


