Bitcoin (BTCUSD) Rejection – Bearish Move Incoming?📉 Key Observations:
Resistance Zone (Purple Box): Price has tested this area and faced rejection.
Bearish Projection (Gray Box & Arrow): The chart anticipates a drop towards the $76,800 - $77,000 range.
Liquidity Grab? Price might consolidate before a sharp decline.
⚠️ Possible Scenarios:
Rejection Confirmation 🔻: If BTC fails to reclaim $84,470, selling pressure could increase.
Breakout Fakeout? 🤔: A deviation above resistance followed by a dump remains a risk.
🎯 Levels to Watch:
Resistance: $84,470 - $85,078
Support: $80,000 and $76,825
🔥 Final Take: If BTC struggles below resistance, a short setup could play out. Confirmation is key!
Bitcoin-btcusd

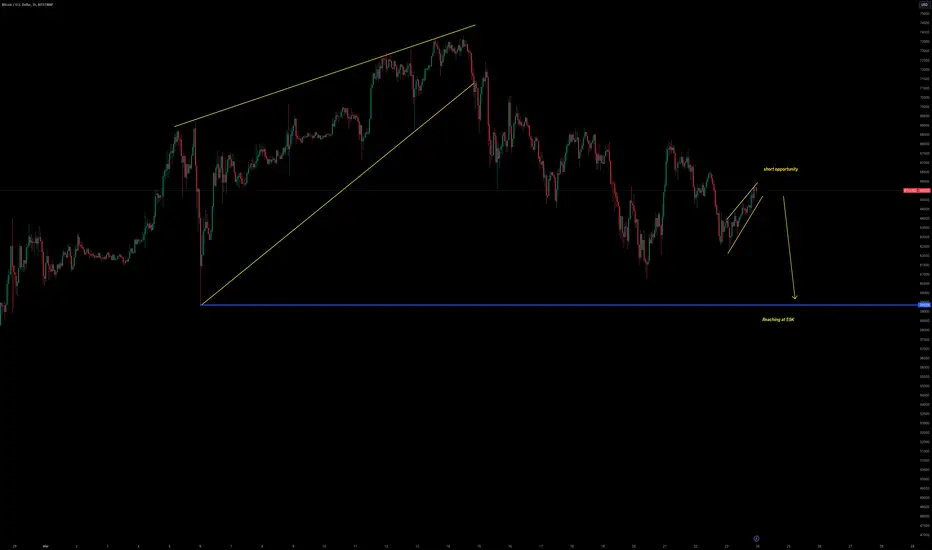
BTC/USD Breakdown! Bearish Target: $78K🔍 BTC/USD 30-Minute Chart Analysis
📉 Market Structure:
The chart displays an ABCDE corrective pattern, likely a descending wedge or contracting triangle, which has now broken to the downside.
Price action shows a breakout below the wedge, leading to further bearish momentum.
The 200-period moving average (red line) is acting as resistance, reinforcing the downward trend.
📊 Current Price: ~$83,057
🔻 Bearish Target: $78,049 (marked as the potential support level)
🛑 Key Observations:
Rejection from wave E indicates a lack of bullish strength.
Lower highs and lower lows confirm a continuation of the bearish trend.
Potential retest of ~$85,000 before dropping further.
🚀 Trading Insights:
Bearish Bias: Short opportunities on pullbacks toward resistance.
Bullish Reversal? Look for price action near $78,049—if buyers step in, a potential bounce could occur.
⚠️ Watch out for:
Sudden Bitcoin volatility (news-driven moves).
A fake breakdown (if buyers reclaim above ~$85,000).

BTC#20: BTC Analysis: Price SW In Triangle – Next Direction?💎 💎 💎As analyzed in the previous article, BINANCE:BTCUSDT gave a bad price reaction when touching the old resistance area of 95~96x. The current price is SW in the triangle. Let's analyze the next plan BINANCE:BTCUSD : 💎 💎 💎
1️⃣ **Fundamental analysis:**
📊President Donald Trump signed an executive order to establish a Strategic Cryptocurrency Reserve that includes 200,000 BTC seized in criminal or civil cases. It will be held as a reserve asset and not sold. In addition, the Government will not purchase additional assets for the reserve.
🚀The Treasury and Commerce Departments may consider budget-neutral Bitcoin purchases. Agencies must provide full accounting books of digital assets to the Ministry of Finance. Regulatory crackdowns on crypto assets are ended
📌 From the above information, it can be seen that BTC and the top 5 coins in the market have been officially recognized as an asset. The legal framework will take time to complete. However, BTC will receive more attention and attention when the US government makes any purchase moves to hoard. This will lead to a huge demand for BTC in the near future.
2️⃣ **Technical analysis:**
🔹 **D Frame**: The price structure is still bearish, we have had a recovery phase to retest the resistance area and give a bad price reaction. It is entirely possible that BTC will go down to the support zone below
🔹 **H4 Frame**: We can see the price reaction more clearly. The continuous reaction of lower peaks in this area shows that the market sentiment is still dominated by the bears even though BTC has been recognized as a reserve asset.
🔹 **H1 frame**: The price is still SW in the triangle area in recent days. The price range is gradually narrowing as shown on the chart
3️⃣ **Trading plan:*
⛔ At the present time, it is no longer suitable to wait for a BUY position. The price has tested the resistance area and reacted badly, so there is a high possibility that there will be a correction below the support area below at any time.
✅ The top priority is to trade in accordance with the main trend in the SELL direction. Although the information about the Reserve Fund has given a positive response, the government not buying more assets for the reserve is also a sign that short-term cash flow will be difficult to push into BTC, especially when tariff policies are giving negative reactions to the economy.
💪 **Wishing you success in achieving profits!**

BTC#17: How Does Bybit Affect BTC? Traders Need to Know This!💎 💎 💎After a long time, BINANCE:BTCUSDT has not escaped the SW zone. So what is the market reflecting? Let's analyze the price reaction of BINANCE:BTCUSD in this area: 💎 💎 💎
1️⃣ **Notable news:**
📊 Coinbase co-founder: A settlement has been reached with the US SEC, the related lawsuit is expected to be officially approved and withdrawn next week. The dismissal of the lawsuit is said to bring many positive signals to the cryptocurrency market in general. 🚀 The security incident on Bybit caused a recent decline, recording the outflow of money from Bybit including hackers' money of 2,235 billion USD. However, liquidity during this time was still maintained stable.
📌 This incident shows the solidarity of the crypto industry community, not the fragmentation of previous attacks. It can be seen that the future potential of the industry will develop even better.
2️⃣ **Technical analysis:**
🔹 **Frame D**: The price structure is still bullish, but yesterday's closing candle completely destroyed BTC's previous attempt to increase in price. A bearish engulfing candle shows that it will take more time to accumulate to break out of this SW area or the price will have to find a better support zone to break out.
🔹 **Frame H4**: The price line is still in the SW area, however, the recent increase gives us a signal about the possibility of BTC increasing in price. Let's look at H1 to see this signal more clearly
🔹 **Frame H1**: The temporary price structure is an upward price structure. Although it cannot be immediately, this is an ideal area to wait for a position whether it is BUY or SELL
3️⃣ **Trading plan:*
⛔ The current price area tests the patience of traders. Trading in the SW price zone always erodes trading psychology due to greed and expectation. FOMO every time the price signals a break through the SW zone will erode the account and trading psychology. Wait for a clearer signal from the price reaction.
✅ As you can see the plan in the H1 frame. Waiting for a clearer price structure to establish a position is the top priority. We do not predict where the price will go but look at reality to decide what to wait for. "Trade what you see, not you think"
💪 **Wish you successful trading!**

Bitcoin -->Continues to GrowBINANCE:BTCUSDT reached $91,433, up $899 (0.99%) from the previous session. During the trading session, the highest price recorded was $92,654 and the lowest was $89,240.
This growth was driven by factors such as the US Federal Reserve (Fed) keeping interest rates unchanged and the increasingly widespread acceptance of Bitcoin in financial transactions. In addition, geopolitical tensions in Europe also caused investors to seek Bitcoin as a safe haven asset.
Experts predict that if this trend continues, Bitcoin could surpass the $100,000 mark in the near future.

Bitcoin analysis History will repeat itself bitcoin going to crash till 40000$ as bitcoin always drop 80 to 60% of its present value and there is no other momentum is there to bitcoin will hit 1lac $$$$ bit event already ended and halving us elections etf and investments from giants from other hedge funds simple logic is bitcoin hardly go above 92 thousand as need more heavy liquidity to push above 1lac$ as of now in my opinion and analysis and experience with bitcoin from last 8years bitcoin will crash till this 2025 nov and 2 year of cycle will repeats as sideways to take all the liquidity from the market and big crashes in bitcoin. the era on as investment and taking profits 2x 5x in bitcoin is already end here and this asset will be stable for day trading and swing trading for upcoming 2 to 5 years.
Check other coins and make 2 to 10x on low to high risk avoid buying at news now hype already end

Can BITCOIN REACH 100K !? MARKETSCOM:BITCOIN
CRYPTO:BTCUSD
BITCOIN breaks all time high what next??
Check out chart levels
Stay invested, stay with the word "hold" 👍🏻
@thetradeforecast 🇮🇳

Bitcoin: BTCUSD bulls eye $68,700 resistance as key week beginsBitcoin's (BTCUSD) recent gains are under pressure as traders await important data this week, including the US Q3 GDP, Fed Inflation, and Nonfarm Payrolls (NFP). However, optimism about post-US election industry regulations and strong ETF inflows continue to support buyers.
BTCUSD braces for major upside
Although Bitcoin (BTCUSD) buyers take a breather, the prices remain above the key resistance-turned-support, and the oscillators are positive, too, suggesting the cryptocurrency pair’s further advances. That said, the quote’s sustained trading beyond the 100-SMA and month-old horizontal support join bullish MACD signals and an upbeat RSI (14) line, keeping the buyers hopeful.
Key technical levels to watch
Among the important technical levels, a one-week-old descending resistance line surrounding $68,700 gains immediate attention. Following that, the monthly high surrounding $69,490 and the $70,000 threshold will be in the spotlight. It should be noted that the BTCUSD pair’s successful trading beyond the $70,000 hurdle enables the buyers to aim for the yearly high of around $73,800.
Meanwhile, the 100-SMA and aforementioned horizontal support restrict the short-term downside of Bitcoin to around $66,600 and $66,100 respectively. In a case where the BTCUSD prices remain bearish past $66,100, an upward-sloping trend line from early September, close to $63,000 at the latest, will be the final defense of the buyers.
An interesting week for buyers
Despite positive technical and fundamental signals for Bitcoin buyers, key data and events could introduce volatility, leading to month-end consolidation. Bulls should stay cautious, as they are likely to maintain control of the market.

Bitcoin: BTCUSD bulls struggle amid overbought RSI, $70,100 eyedOn Monday morning, Bitcoin (BTCUSD) experienced slight losses after reaching a three-month high. This movement highlights overbought RSI conditions, indicating weak upside momentum beneath the horizontal resistance area established since early June.
Buyers remain hopeful
Despite overbought RSI conditions and facing key resistance, Bitcoin (BTCUSD) buyers remain optimistic. The pair is holding above last week’s breakout from a descending resistance line, which is now acting as support around $67,700. Additionally, bullish MACD signals suggest strong buyer momentum.
Key technical levels to watch
The horizontal resistance around $70,100 is a key barrier for Bitcoin bulls. They should also monitor the $70,000 threshold and recent highs near $72,000 as additional hurdles. If BTCUSD breaks through, the yearly peak near $73,800 and the $75,000 mark will attract buyers' attention.
If Bitcoin (BTCUSD) breaks below the former support at around $67,700, it could trigger a short-term decline. Key levels to watch include the previous monthly high near $66,500 and the 200-SMA support around $63,300. If prices fall below $63,300, the next significant support is at $62,500. A move past that could lead to a drop towards the psychological level of $60,000 and potentially a monthly low of around $58,870.
Upside potential remains intact
Overall, Bitcoin (BTCUSD) buyers are likely to remain in control despite the challenges at key resistance. However, a price pullback is possible if the US Dollar strengthens from this week’s PMIs and Durable Goods Orders data.

BTC MARKET ANALYSIS Currently BITCOIN is sitting at a very crucial position, with lower low of 59500 zone. If BTC fails to maintain current support at 60000 level, then we might see a sharp fall toward 54000 level. Technically B5C is above 50EMA on Weekly basis. For upward movement BTC must be above 60000.
60000 ia an important support support level, let's wait for Monday market opening.

BTC BEARISH IDEABTC has entered in bearish zone again after ethereum etf went live on US market, BTC may visit 60k zone in few days. Trade carefully.

BITCOIN Poised for Huge RallyOn Weekly Basis:
BTC/USD completed its correction from 65500 to 16300 in its 3 Wave Down Correction. Previous top was made at 19000 in December, 2017 also a support level. Fibonacci 78.6% retracement from bottom 5300 to top 65500 ends at 16300, a support level. It took a support at 16300. It consolidated at 16300 till December, 2022 then started a fresh new Bull trend. Current rally has its base at 16300 with breaking a strong resistance at 46900. There is a golden cross over at 200 DMA, since then its on up trend. RSI entered in overbought zone, typically always high for Cryptos. It formed a strong base at 26000 level which is also a B Wave. Uptrend started from A Wave (January, 2023) and peaking at 30600 before it started new rally from 26000 (Completion of B Wave). Currently it has completed A and B wave. After it has broken the downward trendline and continuously going up, may give a chance for long position with handsome gains. The current C wave could prove to be very strong which may prove to breach an all time high of 65500 on weekly basis.
Warning and Disclaimer:
Above prediction should not be taken as financial advise, it is a personal opinion.
Consult your financial advisor.
Investment is subject to market risks.
Past performance is not the guarantee for future performance.
It is for educational purpose only.

Bitcoin: time to reversal?As you can see, price has strong reaction at my key level (horizontal line). Now we need to wait price pullback and hold that level again. If we break last D1 candle after pullback, bullish signal is confirmed.
#Bitcoin

BTC Breaks Free from Downtrend: Next Stop $72KBitcoin Shows Bullish Signs: Breaks Downtrend, RSI Rebounds, Targeting $85K and $90K
Bitcoin has recently displayed strong bullish signals in the market. It formed a bullish divergence and successfully broke its downtrend. The RSI (Relative Strength Index) has bounced back from oversold levels, indicating increasing bullish momentum.
To sustain this upward trend, Bitcoin now needs to surpass key resistance levels at $64,500 and $72,000. If these levels are breached, new targets of $85,000 and $90,000 come into focus, potentially marking significant milestones for BTC's price trajectory.
This combination of technical indicators suggests a bullish outlook for Bitcoin in the near term.

#BTC/USDT Bulls Gather Momentum: A Potential Price Surge AheadThe #BTC/USDT pair has recently undergone a significant event, testing a key trend line and subsequently bouncing from it. This bounce has coincided with the formation of a bullish divergence, indicating a potential trend reversal and the beginning of a bullish phase for Bitcoin.
The current price action suggests that #Bitcoin is now poised to retest three critical resistance levels at $62600, $67200, and $71000. If these levels are successfully breached, it could pave the way for a move towards the $85,000 target.
The successful breakout above these resistance levels would confirm the strength of the bullish momentum and could attract further buying interest from traders and investors. However, it's important to monitor the price action closely, as failure to break above these levels could lead to a continuation of the current consolidation phase.

BITCOIN LONG IDEABTC seems to go for long to take liquidity,
Entry 63500 - 64000
Targets 67000, 70000, 73000
Stop 62500

BTCUSDT.P | 4H | TECHNICAL CHART | Hello traders, Wait breakout !
PS: Thank you very much that you support me with your likes and Comments
If you have another analysis at this pair, please share in comments, I will be glad to discuss with you.
Please don't forget to like my posts for continuous update.
TraderTilki

Movement to downsideBTCUSD is looking for short after making ascending channel & has clear formation to the downside.
Bitcoin Blueprint 2024Unpopular opinion: I don't think BTC is going straight to new ATH.
A good shakeout remains ahead. A combination of price and time capitulation.
After great introspection, I believe that Bitcoin will range till September this year and will begin it's parabolic expansion in that month.
Previous ATH should be tested in the month of Nov/Dec, if this manifests.
Halving in April will get a lot of attention but price doesn't move until 2-3 months later.
Don't get liquidated trading the chop. Find new narratives and play select alts.
God Speed.

BITCOIN :- Resistance, Testing, and short Key Points:
Bitcoin currently hovers around $40,900, sitting on the lower edge of a sideways trading channel.
A confirmed channel break with strong volume could lead to a retest of $30,391 (previous breakout level).
Wait for price action to consolidate and confirm support at $30,400 before considering long positions.
Technical Analysis:
The price resides at the channel's support zone, testing its validity.
A breakdown through $40,900 with increasing volume signifies bearish continuation.
The RSI remains neutral, offering inconclusive momentum signals.
Strategy:
Neutral:
Observe price action at $40,900.
If a clean break with volume occurs, wait for confirmation of support at $30,400 before entering long positions.
Alternatively, a bounce off $40,900 with rising volume could indicate a potential trend reversal, warranting further observation.
Risk Management:
Prioritize risk management with well-placed stop-loss orders.
Adjust your strategy based on confirmed price action and volume patterns.
Disclaimer:
This analysis is for informational purposes only and does not constitute financial advice.
Conduct your own thorough research before making any investment decisions

Bitcoin in wave 5OANDA:BTCUSD
I think Bitcoin completed wave 4 triangle pattern and now is in wave 5.
Target:
1) First Target : 40241.7
2) Second Target : 41670.3

$BTC | 1H: Today Plan:Looking short on $BTCUSDT. Expecting a small bounce before a potential drop, as the bulls seem weak. Spot BTC ETF third deadline today, Probably won't get approved today. 35k soon. Lets see!
Previous day:
VAH: $37944
POC: $37591
VAL : $36287
Date: 17 Nov 2023

Movement to the downside!Bitcoin is looking for short after reaching at 37000 & has ascending channel fill in it on weekly timeframe.
