BTC Update 15th august BTC recovers the inefficiency left on10th July, bouncing on the support level at 111K and returning on the last target, in the red zone.
From a technical point, this is could be forecast following the empty zone, as the wick on July 14th, which underlines a POL (point of liquidity), also supported by the heatmap liquidation.
Fundamentally, this new sphere of positivity and institutional adoption is helping BTC's rally to conclude this cycle with the utter targets.
The grow in the past cycle is been sustained- less hyped than the previous two. Both due to the high currency price of the Big coin, which makes difficult have a high percentage changes in short time, and due the consistent consolidation of the VIX index. At the same time, the entrance of new institutional players, as side general traders, investors and big whales, has stabilized a bit the market in terms of entrance and exit, make it more forecastable and stable.
New targets in the next post.
Thanks for reading,
M
Bitcoin-trading

Bitcoin is just 2% away from a new all-time high —will it break?Bitcoin is just 2% away from a new all-time high — will it break or fake? 🚀
BTC is currently trading near $109K–$110K, only 2% below the $112K ATH level.
Strong supports: $94,000 / $80,000
Bullish Case:
If BTC breaks $110K–$112K with strong volume + a bullish weekly close → we could see a rally toward: $135K → $150K
Bearish Case:
If BTC rejects at $110K–$112K, a deep retracement below $100K is possible. Watch for strong support at $100K and $80K levels.
My Personal Take:
I'm bullish overall — but since we’re this close to ATH, I’m opening a short trade with 3% stop loss targeting near $100K.
👉 Not financial advice — do your own research. The crypto market is highly volatile.
Watch this level closely — next big BTC move may be starting NOW. 👀

Bitcoin Bulls vs Bears — Battle Zones Mapped Out#Bitcoin Bulls vs Bears — Battle Zones Mapped Out
🔰 $105K–$106.7K = Bearish Order Block:
Below this zone = CRYPTOCAP:BTC stays bearish unless HTF closes above $106.7K
🔰 Next Moves:
▪️ Likely retest $105K–$106K before next leg ↓
▪️ Target: $97K–$95K zone
🔰 Key Levels:
✅ Holding 0.618 Fib (support)
✅ Unfilled FVG: $97K–$98.3K
✅ Bullish OBs: $95.7K–$97K | $93.5K–$94.7K
If $97,000 holds strong → Expect BIG bounce!

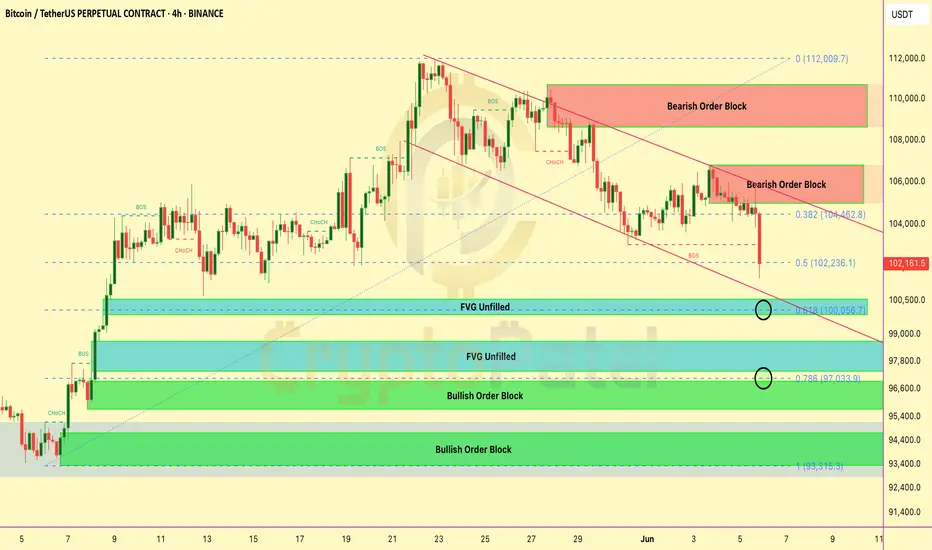
BTC Breakdown or Bounce? Key Levels You Need to Watch!BTC Breakdown or Bounce? Key Levels You Need to Watch!
#Bitcoin 4H Chart Analysis – SMC Overview:
BTC is currently in a short-term downtrend, respecting a descending channel and showing clear bearish structure.
🔴 Bearish Signs:
Price rejected from 2 major Bearish Order Blocks:
▶️ $106K–$104K
▶️ $111K–$109K
Breaks of Structure (BOS) and Change of Character (CHoCH) confirm trend shift to bearish Couldn’t hold the 0.382 Fibonacci level at $104.4K — now testing the 0.5 Fib at $102.2K
🟢 Key Support Zones (Potential Reversal Areas):
1️⃣ $100K Zone
✔️ 0.618 Fib level
✔️ Unfilled Fair Value Gap (FVG)
🔍 Possible bullish reaction from here
2️⃣ $97K Zone
✔️ 0.786 Fib
✔️ Bullish Order Block (OB)
✔️ Another FVG
💥 Strong confluence — good probability of reversal
3️⃣ $93K Zone
✔️ Deep Bullish OB
🛡️ Last strong support if $97K fails
🔼 If bulls reclaim control: We need a clear CHoCH above $104.5K to confirm bullish shift
⚠️ Tip: Mark these zones. Use alerts. Let the price come to you — don’t force trades.
📢 Share if useful & stay updated
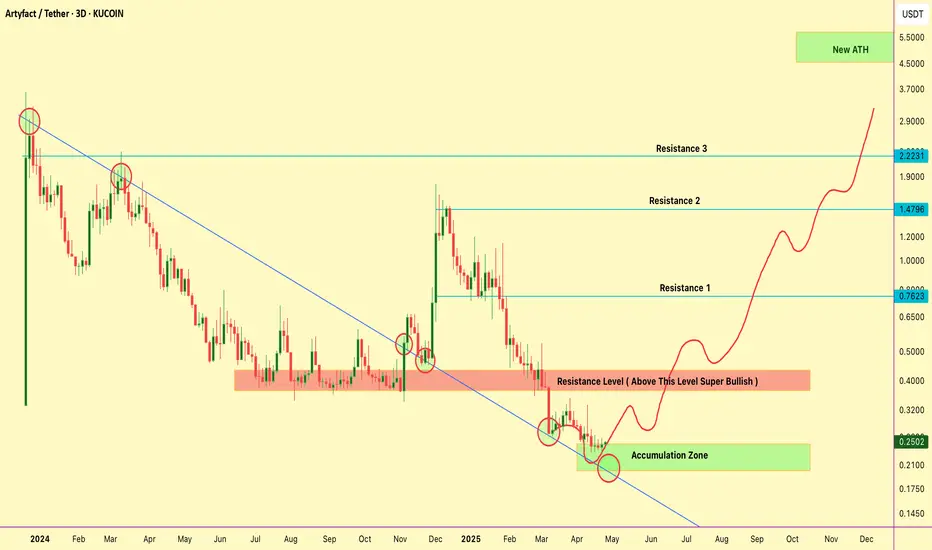
Heavy Accumulation Complete: $ARTY Is Ready to Explode-Don’t MovAMEX:ARTY Chart Looks Perfect – Breakout Coming Soon?
After months of heavy accumulation and technical compression, AMEX:ARTY has officially bottomed out and is now looking extremely undervalued. I’ve personally Bullish at these levels — and here’s why I believe AMEX:ARTY is a massive opportunity before the storm.
Why I Am Bullish on AMEX:ARTY :
✅ Price Action Reversal: The downtrend is broken. AMEX:ARTY has reclaimed key structure and is now sitting firmly in an accumulation zone.
✅ Super Low Market Cap: With a micro-cap valuation and over 80% of tokens already in circulation, this is not just scarce — it’s primed for a supply shock.
✅ Growing Holder Base: On-chain metrics show a steadily increasing number of AMEX:ARTY holders, a strong signal of organic adoption.
✅ Major Catalysts Ahead: Artyfact isn’t just another token — it’s building a next-gen GameFi ecosystem with upcoming launches on PlayStation, Xbox, AppStore, and Google Play. This will potentially attract millions of users globally.
Technical Setup
▶️ Accumulation Zone: $0.20–$0.25 (current entry range)
▶️ Breakout Level (Super Bullish above): $0.37
▶️ Resistance Targets: $0.76/$1.47/$2.22 ( Resistance = Targets)
▶️ Bullrun Target: $5+ — once it clears major resistance, the chart shows high probability for a parabolic run toward new ATHs.
Major Breakout Loading? $LTC Holding Strong at Key SupportMajor Breakout Loading? NYSE:LTC Holding Strong at Key Support
NYSE:LTC is currently consolidating around the $98 level, showing a minor pullback after a failed breakout above the key resistance zone ($101–$128). This red zone has historically acted as a major supply area, rejecting price multiple times.
Key Observations:
➡️ Strong ascending trendline support remains intact since 2019.
➡️ Price retraced from resistance and is hovering near the re-entry zone ($79–$94).
➡️ If LTC reclaims $115+ with volume, a breakout towards $150–$230 is likely.
➡️ Rejection from this zone could lead to another retest of the green re-entry area.
Strategy:
➡️ Watch for bullish confirmation above $115 to aim for mid-term targets.
➡️ Aggressive buyers may consider scaling in between $79–$94 with a tight SL.
➡️ Long-term target remains around $229, $389, and beyond if macro trend continues.

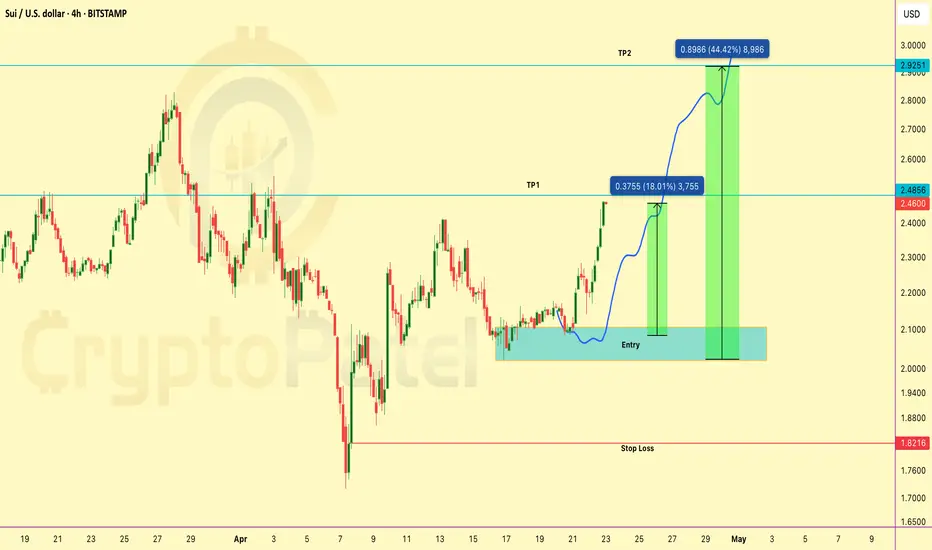
SUI/USDT Now 18% up in Spot from our Entry LevelCRYPTOCAP:SUI just hit +18% on spot and a massive +176% on 10x leverage from our shared trade setup! 🚀
➡️ Entry: $2.08
➡️ Current: $2.4660
Solid breakout play — hope you all caught the move!
Feel free to lock in profits anytime here for a safe exit. ✅
BTCUSD: Trendline Support vs. Key Resistance - What's Next ?Previous Support Turned Resistance: The 91,000-93,000 range that previously acted as support has now flipped to resistance, confirming a classic price action principle.
Diagonal Trendline Support: Currently, price is respecting an upward diagonal trendline (marked by the red lines on the chart), providing short-term support.
Market Structure:
Bitcoin experienced a sharp drop from the 96,000 level in late February
Price found a bottom around the 80,000 mark before forming the current ascending trendline
Recent price action shows a series of higher lows along this trendline, suggesting potential bullish momentum building
Trading Outlook:
As long as price remains above the diagonal trendline support, we can expect a continued move higher
Immediate target would be a retest of the 91,000-93,000 resistance zone and if price sustain above this then more upisde possible.
A successful break above this resistance could signal a resumption of the larger bullish trend
However, a break below (Close on daily) the trendline support would invalidate this bullish scenario

BTC#15: BTC Bottomed Out or Still Falling? Detailed Plan💎 💎 💎 So BINANCE:BTCUSD continues to return to the 96K support zone. However, the price reaction this time is different. We continue to plan for BINANCE:BTCUSDT 💎 💎 💎
1️⃣ Macro Perspective
🔹Oklahoma Bitcoin Reserve Bill: If passed, this could be a big step towards legitimizing Bitcoin as a reserve asset, especially in the context of the US's still hesitant attitude towards crypto.
🔹Former Treasury Secretary Summers warns of inflation: This means the Fed could keep interest rates high longer or even increase them again. High interest rate environments are generally not favorable for risky assets like crypto.
🔹Hong Kong confirms BTC & ETH as investment-proof assets: This is a bullish signal as it promotes legitimate investment flows into crypto.
2️⃣ BTC Technical Analysis
🔹 **D Frame** (Daily)
The bears control the SW (supply zone) area, which confirms the short-term downtrend.
Yesterday's candle closed strongly bearish, showing that selling pressure is still strong.
🔹 **H4 Frame**:
The price is retesting the support zone but the buying force is weakening, confirming that the market sentiment is no longer in favor of continuing to pump up.
It is likely that if BTC has a recovery, it will only be a recovery wave to create momentum to break the support zone below.
🔹 **H1 Frame**:
- The price returns to the downtrend channel → the SELL strategy has an advantage in the short term.
- The 94~96K zone may be broken soon, so it is necessary to monitor the price reaction when the price approaches this zone.
3️⃣ Trading strategy
✅ Priority plan: Look for SELL opportunities
Potential entry zone: 94K - 96K (there may be a slight rebound to clear stop loss before breaking down).
Target: 89K - 90K (next strong support).
Stop-loss: Above 97K (if the price breaks up strongly, the bearish scenario will be negated).
⛔ Do not prioritize BUY at this time
The market structure does not support the bulls.
If you want to BUY, you need to wait for a clearer reversal confirmation signal at the 89K support zone
💪 **Wishing you successful trading!**💪

BTC#8: Read BTC price line and trading plan
💎 💎 💎 Did you make a profit in the previous post #7? Like and follow the channel to follow the earliest trading plan. 💎 💎 💎
🔥 Let's plan for the next BINANCE:BTCUSD BINANCE:BTCUSDT 🔥
1️⃣ **Fundamental analysis:**
📊The Federal Reserve keeps interest rates unchanged
🚀Today is the expiration date of BTC futures
📌 US Senator Cynthia Lummis: will hold a public hearing on strategic Bitcoin reserves. This is important information. If BTC is accepted as a reserve asset. The cash flow into BTC will be huge in the near future.
2️⃣ **Technical analysis:**
🔹 **Frame D**: Once again, the price reacted in the 106xxx area. This test gives a weaker price reaction than the previous one.
🔹 **H4 frame**: The price has not surpassed 107xxx so it is not certain that BTC will break the peak.
🔹 **H1 frame**: The short-term price structure is still increasing. It is highly likely that the price will find the support zone below.
3️⃣ **Trading plan:**
⛔The price line has not completely escaped the SW zone, so if you participate in trading in this area, you must stick to the price structure.
✅ In my personal opinion, BTC will likely have another correction before it can break through the old peak. For the time being, we will wait for the price reaction at important support zones.
💪 **Wish you successful trading!**
📌 For any questions, please contact us directly. I am ready to answer you for free

Will Bitcoin Hit $45000 Next ?Bitcoin Rejected from Resistance
BTC has once again been rejected from the Bull Flag Resistance Line. I'm now expecting a significant correction, with BTC/USDT potentially testing the $45,000-$50,000 level before the next leg up.
Caution:
Avoid buying until the market stabilizes. Global uncertainty with war news is adding to the volatility.
Key Levels:
Support: $48,000
Resistance: $66,000
Bull market resumes if BTC breaks above $66,000.

Can #Bitcoin Pass $70K and Reach $150K?Can #Bitcoin Pass $70K and Reach $150K?
If you want to see Bitcoin reach a new all-time high toward $150K, the price needs to break the $70,000 resistance level.
There's strong support at $50,000."

#Bitcoin LTF Chart Analysis#Bitcoin LTF Chart Analysis
BTC is currently trading at a crucial support level.
Here's what to watch:
Support Level: $66,500
Scenario 1: If support holds, it's a positive sign for the bulls.
Scenario 2: If support breaks down, BTC could drop below $65,000.
Trading Tip: Always wait for confirmation before entering a trade.
Stay alert and trade wisely.

Will #Zcash hit $800 in Bull Market?Would you believe #Zcash will hit $800 of it's Past ATH?
Bullish Engulfing in HTF but SEED_DONKEYDAN_MARKET_CAP:ZEC is a privacy coin and the current market scenario is very negative for Privacy coins.
You can enter between $20-$24 with Strong SL $19.
Major Resistance: $32/$130
Note: Currently #SEC is against Privacy Coins & #ZEC is a Privacy coin so investment in Securities coins is high risky.
NFA

Bitcoin Crash Alert: Ready for $22k as per Past Fractal AnalysisPotential Bitcoin Price Movement Based on Previous Cycles
Greetings crypto community! I wanted to share an interesting observation about potential bitcoin price movement based on fractals from past market cycles.
- In 2019, BTC was 42% below its previous all-time high (ATH). Currently, in 2024, it is 41% below the 2021 ATH.
- In 2019, BTC dumped 73% from the 0.786 Fibonacci retracement level. It is currently trading at the 0.786 level.
- In 2020, BTC was 73% down 322 days before the 3rd halving. Currently, it is 100% up 322 days before the upcoming 4th halving.
- There are similar price "boxes" between 2019 and 2024 - GETTEX:13K - GETTEX:14K back then versus $50k- GETTEX:52K now, and $4k-$5k versus FWB:21K -$23k.
If these fractals play out similarly, we could potentially see BTC in the $22k- GETTEX:25K range soon.
Please Like Share and Follow me for more quality analysis

BONK/USDT Bullish Pennant Breakout AlertSEED_DONKEYDAN_MARKET_CAP:BONK Bullish Pennant Breakout Alert
1️⃣ Bullish Pennant Breakout ✅
2️⃣ 200% Potential if hold $0.000010 Support
3️⃣ 20,000% Pumped Before Binance Listing ✅
4️⃣ I already Booked 40x From #BONK
Before Listing on Binance ( Honestly )
5️⃣ Note: Bearish Mode will be Activated Below $0.0000095

Bitcoin LTF Chart Analysis#BITCOIN LTF Bearish Update:
CRYPTOCAP:BTC Currently Trading in Bearish as per Fractals.
If this Bearish Fractals work then Next Stop will be at $36800
Current Sequence According This Fractals:
$40800 ➡️ $36800 ➡️ $38800 ➡️ $35000
Note: LTF Fractals Invalidated if #BTCUSDT 2H candle Closed above $41000

Bitcoin Bearish Divergence -15% down form our Entry#Bitcoin Bearish Divergence Alert: Ready for $31000 ?
- CRYPTOCAP:BTC Down 15% since our last alert.
- Today $41000 Strong Support Broken so I am Expecting the Next Target would be $35500 and $29800
Are you Ready for #buythedip ?

Bitcoin Ready for Correction Before Bull Run?Bitcoin HTF Chart:-
Breakout -> Expansion -> Corrections -> Bull Run

ICX/USDT Bullish Bounce and Expecting 30% Profit from HereICX/USDT Scalp Analysis:
Price Update: Strong Bounce from Support Level $0.24
Hey traders!
ICX/USDT has shown resilience with a strong bounce back from the support level at $0.24.
I'm looking to add some long positions around this support, anticipating a potential 10%-20% target gain.
Target Range: 10%-20%
Timeframe: 2-15 Days
Stop Loss: 4H Candle Close Below $0.24 Support Level
Let's ride the waves together!
Happy trading!
#ICX #USDT #CryptoTrading #BounceBack

Bitcoin Short Trade Idea : Bitcoin is currently trading at 37,072$
: I am Bearish on BTC since 38k got mitigated again
: Look at the trend and try to understand how easily the trend is fading out
: Avoid Shorts or Futures market will deleverage you
: Bitcoin can easily eradicate the longs as of now
: Keep your Spot bags light stay cash or in Fiat
: Accumulation Zones - 34-35,000$ Second - 30,000-32,000$
: STAY CASH #BTC

Trade like a casino Operator (Risk Management) Trading Like a Casino
Introduction:
If you want to become a successful trader, it's essential to adopt a mindset similar to that of a casino. In this tutorial, we will explore how casinos operate and extract valuable principles that we can apply to our own trading. Two key components of a casino's success are having an edge and implementing effective risk management. By understanding and replicating these principles, we can increase our profitability in the long run.
How does a Casino operate?
- Casinos operate with an edge, meaning they have an advantage in every transaction.
- Understanding the concept of probability is crucial. Games like roulette demonstrate that the outcomes are not evenly split between options.
- Casinos calculate their edge by analyzing the probabilities of each outcome, which allows them to ensure profitability.
- Risk management is also a vital aspect of a casino's operation. They set maximum limits on bets to protect their downside.
Trade like a Casino
- As traders, we want to replicate the casino's success by incorporating the same principles into our trading.
- Our goal is to have an edge in every trade we take and implement effective risk management to protect our capital.
- By aligning these two components, we can create a profitable trading system.
Applying the principles to trading
- Trading is a probability game. Each trade has a probability of going up or down.
- To gain an edge, we need to identify the probability of our trades and establish our trading style.
- Having a high probability trade doesn't guarantee success, but it improves our chances.
- Risk management is crucial to protect our capital. We should only risk a small percentage of our account on each trade (e.g., 2%).
- Balancing our edge and risk management will help us become successful traders.
Backtesting and refining strategies
- Once we have identified our edge and established risk management, we need to test our strategies.
- Backtesting involves analyzing historical data to see if our strategies have been consistently profitable.
- By testing and refining our strategies, we can ensure they work in real market conditions.
- Continuous evaluation and improvement are necessary for long-term success.
Conclusion:
Trading like a casino involves having an edge and implementing risk management. By understanding and applying these principles, we can increase our profitability as traders. Remember to assess the probability of each trade, establish risk management rules, and test your strategies. Just like a casino, our goal is to create a consistently profitable system that ensures long-term success in trading.

BTC projection for this weekendNOT FINANCIAL ADVICE
Analysis indicate that BTC will hit 48k-49k by this weekend
Entry- 44k
