$IO Could Be the Next 100x AI Coin?SEED_ALEXDRAYM_SHORTINTEREST2:IO Could Be the Next 100x AI Coin — Don’t Miss This Supercloud Revolution
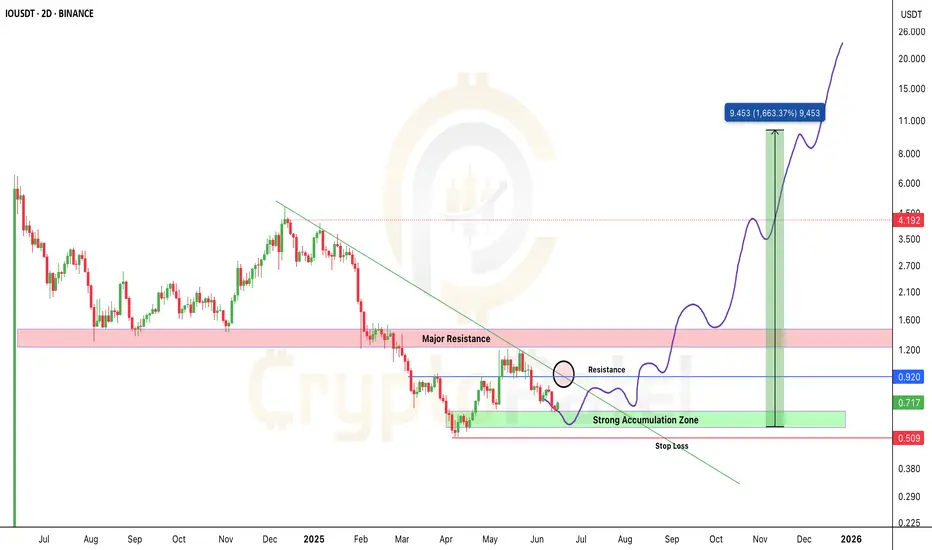
SEED_ALEXDRAYM_SHORTINTEREST2:IO is showing early signs of strength after bouncing from the key accumulation zone ($0.51–$0.73).
Structure still bullish.
A breakout above $0.92 = confirmation for next leg up.
If volume kicks in, SEED_ALEXDRAYM_SHORTINTEREST2:IO has macro breakout potential.
▶️ Entry Zone: $0.51–$0.73
▶️ Breakout Trigger: $0.92
▶️ Resistance Zone: $1.20–$1.60
▶️ Target: $5/$9/$15/$20
▶️ ROI Potential: 10x / 20x
❌ Invalidation: Break below $0.50
🔥 Long-term holders and breakout traders — don’t miss this.
io.net is turning idle GPUs into a supercloud to power AI, ML & big data — without relying on AWS or GCP.
✅ 90% cheaper than trad cloud
✅ 16,000+ GPUs live
✅ Built on Solana
✅ Backed by Multicoin, Delphi, Solana Ventures
🔰 Token Utility: Pay for compute | Staking rewards | Governance rights
This is DePIN + AI — a powerful combo. If adoption scales, SEED_ALEXDRAYM_SHORTINTEREST2:IO could be massive.
📢 If this analysis helped you, please RT & drop your thoughts in comments 👇
Let’s spread the alpha.
NFa & DYOR
Bitcoin (Cryptocurrency)
BTC Decision Point – Are You Watching This?BTC Decision Point – Are You Watching This?
Bitcoin is reclaiming momentum after sweeping liquidity at $102.7K. It's now pushing toward major resistance at $106.1K.
But the real battle? The bearish OB at $107.2K–$108.9K — where price nuked last time.
✅ Break above = clear skies toward new ATHs
❌ Rejection = another trip to $102K or even Under $100K
🔁 Retweet if this helped
💬 Drop your bias below: Long or short?👇

$ETH BLOODBATH: -15% Dump! Next Stop $2100? CRYPTOCAP:ETH BLOODBATH: -15% Dump! Next Stop $2100?
I shorted right from $2862 — nailed the move.
Now trading below critical $2550 support.
👉 Hold $2550? Reversal towards $3000-$4000 possible.
👉 Lose it? We likely fill $2100-$2200 FVG — 0.618 fib at $2116.
$2860 remains THE level to watch for a New ATH.
💬 Comment your ETH target!
🔁 Retweet if this helps your gameplan.

BITCOIN ANALYSIS UPDATE — READ THIS CAREFULLY!🚨 BITCOIN ANALYSIS UPDATE — READ THIS CAREFULLY! 🚨
Hope you followed our last BTC analysis — and DID NOT open any longs at the top.
If you followed: Congrats — you either made big profits on the short, or at least saved your money by not longing.
✅ We clearly warned when BTC was around $110K — more correction was coming.
Result? Bitcoin is now 7% DOWN since that call.
❗ Now the situation is DANGEROUS:
👉 BTC broke my Bullish Order Flow at $105K.
👉 If this $105K support doesn’t hold soon → we may see a deep correction towards $90K.
$105K is the level to watch like a hawk.
👉 Iran-Israel news just accelerated the fall — but we already predicted this move before the news.
🚫 NEVER gamble with your hard-earned money.
✅ Always wait for solid confirmation before entering trades.
👉 Stay smart. Stay safe. Stay patient.
💬 Comment your thoughts below.
🔁 Forward this to your crypto friends — they NEED to see this!
BITCOIN ANALYSIS UPDATE — READ THIS CAREFULLY! BITCOIN ANALYSIS UPDATE — READ THIS CAREFULLY!
Hope you followed our last BTC analysis — and DID NOT open any longs at the top.
If you followed: Congrats — you either made big profits on the short, or at least saved your money by not longing.
We clearly warned when BTC was around $110K — more correction was coming.
Result? Bitcoin is now 7% DOWN since that call.
Now the situation is DANGEROUS:
👉 BTC broke my Bullish Order Flow at $105K.
👉 If this $105K support doesn’t hold soon → we may see a deep correction towards $90K.
$105K is the level to watch like a hawk.
Iran-Israel news just accelerated the fall — but we already predicted this move before the news.
🚫 NEVER gamble with your hard-earned money.
✅ Always wait for solid confirmation before entering trades.
Stay smart. Stay safe. Stay patient.
Comment your thoughts below.
Forward this to your crypto friends — they NEED to see this!

BTC/USD 4H Trade Setup – Demand Zone Reversal Play🔵 1. Demand Zone 🧲💎
📍 Range: 100,418.83 – 102,253.51
🟦 Strong support zone
💡 This is where buyers are expected to step in
📉 Price is currently testing this zone — potential reversal area
🚀 2. Entry Point 🎯
📍 Zone: 102,232.52 – 102,264.33
✅ Just above demand zone for safe entry
🧘♂️ Wait for bullish confirmation (wick rejections, engulfing candles)
🛑 3. Stop Loss 🔻
📍 Zone: 100,498.77 – 100,538.74
🔒 Below demand zone — protects you from false breakouts
⛔ Invalidates setup if price breaks below this level
🎯 4. Target Point 💰
📍 Target: 108,800.00
🧱 Major resistance zone
📈 Offers a solid Risk/Reward setup (approx. 1:4)
🪜 Possible take-profit scaling around 108,656.78 – 109,256.50
🔁 5. CHoCH – Change of Character 🔄
📍 Confirmed structural break above a lower high
🕵️♂️ Indicates shift from bearish to bullish
🔁 Needs confirmation with higher low near demand zone
📏 6. EMA 70 (Exponential Moving Average) 📉
📍 Level: 106,849.30
🔴 Price is currently below EMA = short-term bearish
🧗♂️ Reclaiming the EMA will strengthen the bullish bias
✅ Quick Summary with Emojis
📌 Plan:
🔵 Buy near: 102,250
🛑 Stop Loss: 100,500
🎯 Take Profit: 108,800
📊 Trend:
🔻 Bearish short-term (below EMA)
🔁 Potential reversal from demand zone
⚠️ Watch For:
🔍 Bullish confirmation at demand zone
🔄 Reclaim of EMA (106.8k)
🧱 Resistance near 108.8k

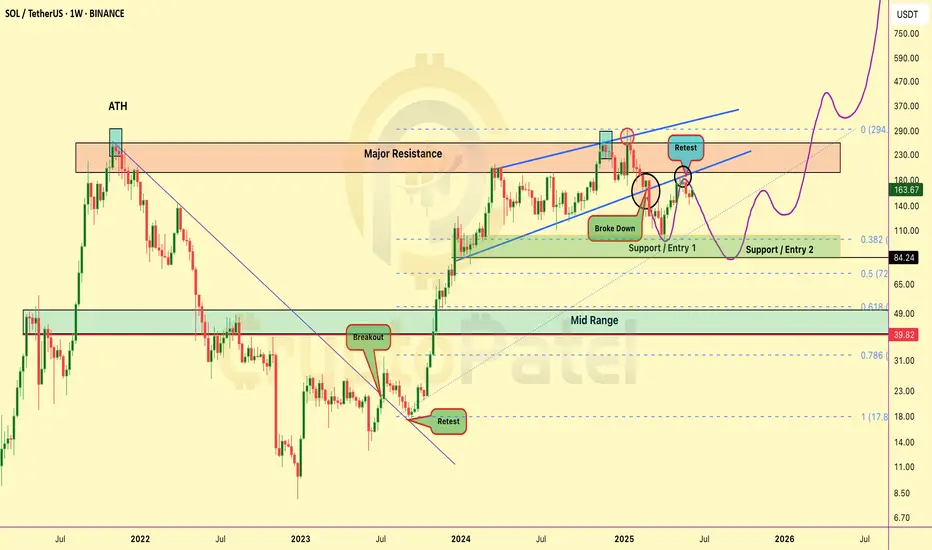
Is $SOL about to DUMP… or set up a MASSIVE BUY ZONE?Is CRYPTOCAP:SOL about to DUMP… or set up a MASSIVE BUY ZONE?
Solana is now at a critical level on the higher timeframe chart:
✅ After a breakdown, SOL is now retesting the bearish retest zone
✅ Strong resistance seen at $170–$180
✅ If rejected → price could dip toward the $100 range
But here’s the key: A dip to $100 would be a massive long-term buying opportunity for many investors (including me).
Long-term targets? I’m still eyeing $500 → $1000 if the macro trend plays out.
👉 Keep a close eye — the next few weeks could set up the next big move for $SOL.
Are you ready? Will you be buying the dip? Comment below! 👇
NFA & DYOR
#Ethereum Breakout Attempt #Ethereum Breakout Attempt 📢
After weeks of consolidation inside this range → CRYPTOCAP:ETH is now testing a breakout above major resistance $2750
👉 If this breakout holds → we could see a BIG upward rally toward $3500–$4000 in the coming weeks. 🚀
Keep an eye on this level — the next move could be massive.

Bitcoin is just 2% away from a new all-time high —will it break?Bitcoin is just 2% away from a new all-time high — will it break or fake? 🚀
BTC is currently trading near $109K–$110K, only 2% below the $112K ATH level.
Strong supports: $94,000 / $80,000
Bullish Case:
If BTC breaks $110K–$112K with strong volume + a bullish weekly close → we could see a rally toward: $135K → $150K
Bearish Case:
If BTC rejects at $110K–$112K, a deep retracement below $100K is possible. Watch for strong support at $100K and $80K levels.
My Personal Take:
I'm bullish overall — but since we’re this close to ATH, I’m opening a short trade with 3% stop loss targeting near $100K.
👉 Not financial advice — do your own research. The crypto market is highly volatile.
Watch this level closely — next big BTC move may be starting NOW. 👀

Founder’s Wallet HACKED → $4M Gone → $MASK Crashes! Full Story IFounder’s Wallet HACKED → $4M Gone → NASDAQ:MASK Crashes! Full Story Inside
Dropped -51% in few hours! 😱
*Here’s the FULL story you need to know:*
🟥 Founder’s Wallet HACKED → $4M stolen!
🟥 Big WHALE dumped $2.1M worth of MASK on Binance!
🟥 Binance DELISTING rumors caused PANIC SELLING!
Result? Massive crash — from $3.73 → $1.735 in just HOURS!
🔥 Is this the BOTTOM? Or will it DUMP more?
🔥 Are smart traders BUYING this DIP?
👉 I’ll be tracking NASDAQ:MASK LIVE — join my channel & stay ahead of the next BIG MOVE!

Bitcoin Bulls vs Bears — Battle Zones Mapped Out#Bitcoin Bulls vs Bears — Battle Zones Mapped Out
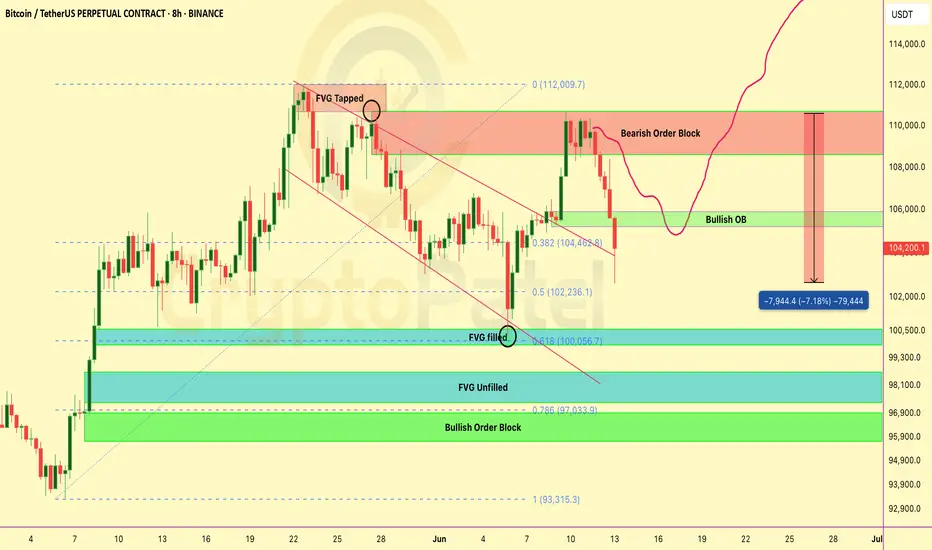
🔰 $105K–$106.7K = Bearish Order Block:
Below this zone = CRYPTOCAP:BTC stays bearish unless HTF closes above $106.7K
🔰 Next Moves:
▪️ Likely retest $105K–$106K before next leg ↓
▪️ Target: $97K–$95K zone
🔰 Key Levels:
✅ Holding 0.618 Fib (support)
✅ Unfilled FVG: $97K–$98.3K
✅ Bullish OBs: $95.7K–$97K | $93.5K–$94.7K
If $97,000 holds strong → Expect BIG bounce!

Bitcoin (BTC/USD) 1H Chart Analysis – Double Top Signals BearishPattern Formed: DOUBLE TOP
⚠️ Bearish Reversal Pattern Spotted!
📍 Formed near 111,794.8
⬆️ Price tested the top twice and failed – strong resistance confirmed!
Key Zones:
🔶 SUPPLY ZONE (Resistance):
🟧 111,794.8 - 111,829.8
🔼 Expect selling pressure here!
🔷 SUPPORT Zone (Broken!):
🔻 Price fell below this level, confirming a bearish breakout
🟩 TARGET ZONE:
🎯 102,500.0
✅ This is the likely drop target based on the pattern
🧊 Other minor supports:
* 102,820.6
* 102,750.8
* 102,227.0.
Indicators:
📈 Trend Line
* Supported the price during the uptrend
* ❌ Now broken — indicates momentum shift
📉 EMA 70 (Red Line)
* Current Price (108,238.6) is below EMA 70 = 109,245.0
* Indicates bearish pressure.
Trade Setup:
🔽 Short Entry Idea: After support break
🛑 Stop Loss: 111,829.8
🎯 Take Profit: 102,500.0
⚖️ Risk-Reward looks attractive!
Summary:
📉 Bearish bias confirmed by:
* Double Top pattern
* Supply zone rejection
* Support break
* EMA crossover
🚨 Traders Watch Out: Bears are in control — next major stop likely at 102,500.0!

BTC Breakdown or Bounce? Key Levels You Need to Watch!BTC Breakdown or Bounce? Key Levels You Need to Watch!
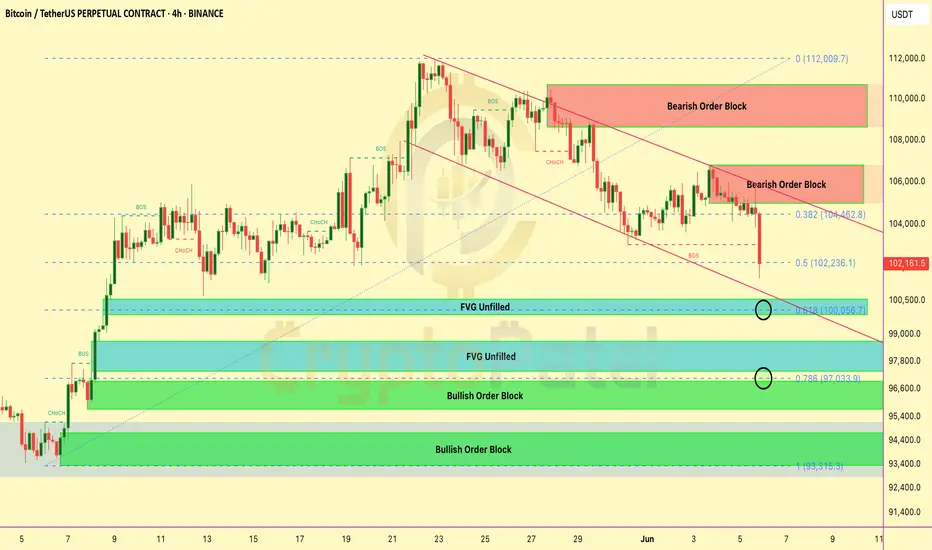
#Bitcoin 4H Chart Analysis – SMC Overview:
BTC is currently in a short-term downtrend, respecting a descending channel and showing clear bearish structure.
🔴 Bearish Signs:
Price rejected from 2 major Bearish Order Blocks:
▶️ $106K–$104K
▶️ $111K–$109K
Breaks of Structure (BOS) and Change of Character (CHoCH) confirm trend shift to bearish Couldn’t hold the 0.382 Fibonacci level at $104.4K — now testing the 0.5 Fib at $102.2K
🟢 Key Support Zones (Potential Reversal Areas):
1️⃣ $100K Zone
✔️ 0.618 Fib level
✔️ Unfilled Fair Value Gap (FVG)
🔍 Possible bullish reaction from here
2️⃣ $97K Zone
✔️ 0.786 Fib
✔️ Bullish Order Block (OB)
✔️ Another FVG
💥 Strong confluence — good probability of reversal
3️⃣ $93K Zone
✔️ Deep Bullish OB
🛡️ Last strong support if $97K fails
🔼 If bulls reclaim control: We need a clear CHoCH above $104.5K to confirm bullish shift
⚠️ Tip: Mark these zones. Use alerts. Let the price come to you — don’t force trades.
📢 Share if useful & stay updated
Bitcoin (BTC) Technical Analysis for the Week of Jue 02 -June 09Technical Analysis
Price Action: Bitcoin is consolidating around $105,000–$108,000 after a sharp rally from April lows (~$74,000) and a peak near $112,000. A recent 3% correction was driven by profit-taking, with BTC stabilising near $106,000.
Trend: Medium-term trend remains bullish, but momentum is slowing. BTC has broken the previous resistance , indicating a potential slower rise or horizontal movement.
Note : Indicator MACD making bearish diversions in my view its not strong .
Key Levels:
Support: ~$102,600–$103,500 (recently tested)
Resistance: ~$106,000 (current resistance) and $110,500–$123,000 (next major target).
-- Disclaimer --
This analysis is based on recent technical data and market sentiment from web sources. It is for informational purposes only and not financial advice. Trading involves high risks, and past performance does not guarantee future results. Always conduct your own research or consult a SEBI-registered advisor before trading.
#Boost and comment will be highly appreciated

BITCOIN WARNING – $104K IS KEY🚨 BITCOIN WARNING – $104K IS KEY
#Bitcoin is showing signs of weakness on the 4H chart! Let’s break it down:
🔻 Trend Shift Detected:
Recent CHoCH and BOS suggest the uptrend is over. Market structure has turned bearish.
Key Levels to Watch:
▪️ Support at $104K is being tested again. If it breaks, we may see a drop.
▪️ Next major targets:
➤ $100.5K (Unfilled Fair Value Gap)
➤ $98K – Strong demand zone
➤ $96.6K – Bullish Order Block + FVG confluence
Why It Matters:
▪️ Price rejected hard from the $107K zone (supply + FVG)
▪️ Liquidity was grabbed from Equal Highs
▪️ Now it’s hunting lower liquidity near $100K
⚠️ If $104K fails, get ready for a quick drop to $100.5K or even $96.6K
Plan: Short-term bearish unless BTC breaks back above $106K with volume.
Stay alert — volatility incoming!

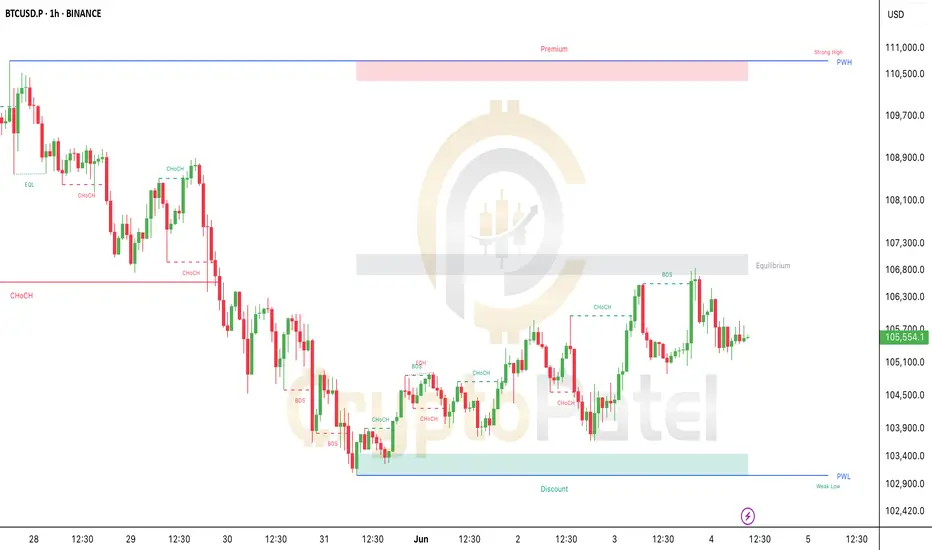
Breakout or Breakdown? BTC at Critical Level!Breakout or Breakdown? BTC at Critical Level!
#Bitcoin is showing early bullish signs after a clean reversal from the discount zone (~$103K).
We saw a CHoCH → BOS → Retest sequence play out perfectly!
Price is now consolidating just below a key supply zone (~$106.8K). This is the Equilibrium Zone – where smart money decides the next move.
🔹 As long as BTC holds above $104.2K, we stay bullish.
🔻 BUT – if we break below $103.4K, expect a deeper pullback, and we could even see Bitcoin drop under $100K for a proper liquidity sweep.
What’s Next?
If we reclaim $106.8K with strength, the next target is the Premium Zone around $110K–$111K, where major liquidity sits!
Watch for breakout or rejection – don’t FOMO. Patience = Profits.
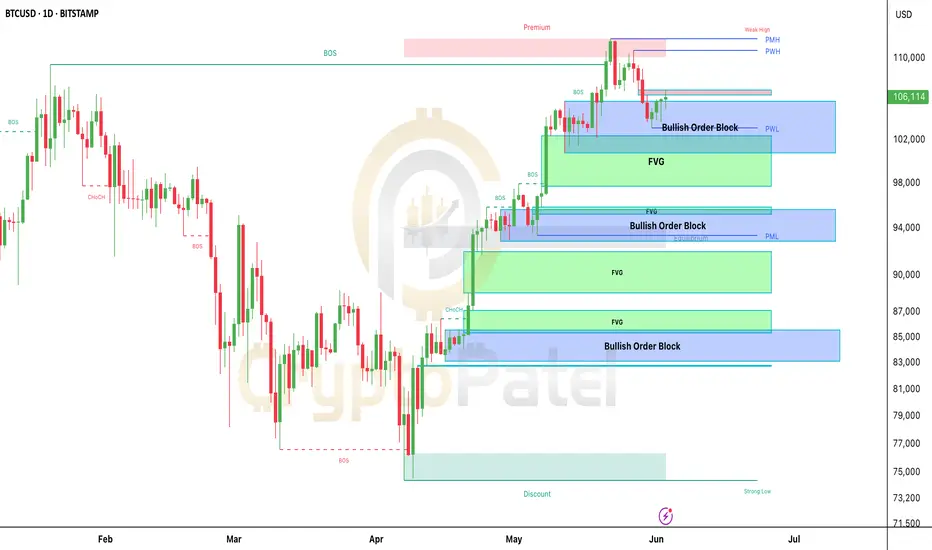
Bitcoin's Next Move: $110K Breakout or $94K Dip? SMC Decides#Bitcoin Daily Chart Analysis – Smart Money Update
As of today, BTC is trading around $105,800 and is showing signs of consolidation after reaching a key resistance zone near $110K.
Let’s break down what’s happening on the chart 👇
Current Market Structure
▶️ BTC has been in a clear uptrend, with multiple Breaks of Structure (BOS) confirming bullish momentum throughout April and May.
▶️ However, price recently entered a premium zone (above $110K), where it faced strong resistance.
▶️ This created a weak high, and we saw a Change of Character (CHoCH) that suggests buyers are slowing down.
Key Levels to Watch
$102K–$106K Zone (Current Area)
▶️ Price is sitting inside a Bullish Order Block + Fair Value Gap (FVG).
▶️ This is a strong support zone.
▶️ If this area holds, we could see a move back up toward $110K or even higher.
$93K–$96K Zone
▶️ Another clean Bullish OB + FVG combo.
▶️ If BTC breaks down from the current zone, this is the next major area where Smart Money might step in to buy.
$83K–$87K Zone
▶️ Deep discount zone, far below equilibrium.
▶️ If price reaches here, it’s a high-probability reversal area.
What Smart Money Might Do
▶️ If BTC holds above $102K–$105K, bulls could regain control and retest the highs near $110K.
▶️ If we break below this zone, expect a pullback toward $94K–$95K or even $87K, where more demand is waiting.
Fair Value Gaps (FVGs)
▶️ Several FVGs are visible, especially between $98K–$103K and $93K–$96K.
▶️ These gaps are areas of imbalance where price is likely to return and fill before the next move.
Summary
▶️ BTC is currently in a decision zone.
▶️ Holding above $102K = bullish continuation likely.
▶️ Breakdown = retracement into deeper bullish zones.
⚠️ As always, wait for confirmation on lower timeframes before entering any trade. Let the market show its hand.
Stay patient. Smart Money doesn’t chase—It waits.
NFA & DYOR
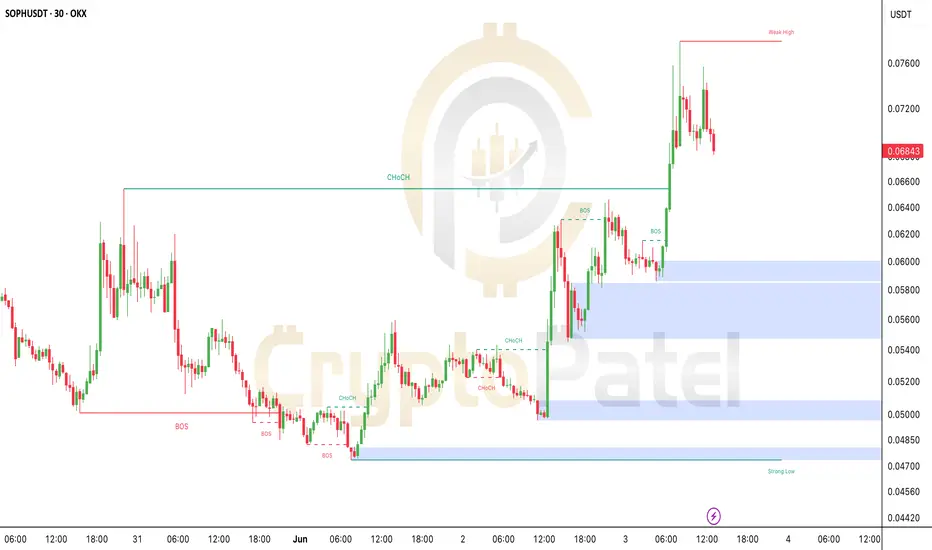
SOPH Price Reversal Confirmed – Here’s What Comes Next!#SOPHUSDT Market Update – Bullish Structure in Play!
SOPH just flipped bullish on the 30-min chart! Here's the breakdown in simple terms:
🔸 Trend Reversal Confirmed
After a long downtrend, SOPH broke structure and shifted to bullish with strong price action from the $0.058–$0.060 demand zone.
🔸 Smart Money Accumulation
Price grabbed liquidity below $0.052, then pumped hard — a classic move by smart money to trap sellers and fuel the rally.
🔸 Weak High at $0.076
The recent high looks weak and might get taken out soon. Price is consolidating just below it — a sign of strength.
🔸 Next Moves to Watch:
Holding above $0.060 = bullish bias stays strong
Retest and bounce from $0.060–$0.058 zone = ideal entry
Targeting above $0.076, maybe even $0.080+ in the coming hours
If SOPH drops below $0.058, we’ll watch the $0.050–$0.047 zone for the next strong support.
Smart Money Playbook: Accumulation → Manipulation → Expansion
Stay sharp & watch the zones closely!
Note: this is Not Financial Advice so DYOR
$SUI Looks Super Bullish, But There’s a Catch!CRYPTOCAP:SUI Looks Super Bullish, But There’s a Catch!
SUI Network is heating up in this bull market, and yes — it could potentially reach $10… even $15–$20 long-term! 🔥
But here’s something you need to know 👇
🔓 Today, 44M CRYPTOCAP:SUI (~$143M) tokens got unlocked — that’s 1.32% of the circulating supply.
▶️ Only 33.87% of total supply is unlocked — meaning 66.13% is still locked with early investors and the team.
▶️ That’s ~$140M worth of tokens unlocking every month. This could put serious sell pressure on the price!
✅ I'm still bullish long-term, already holding from $0.50–$0.60.
▶️ If CRYPTOCAP:SUI drops to around $2.80, I’ll be buying more.
Short-term dip = Long-term opportunity?
Be smart. Track unlocks. Buy low. Think long.
NFA & DYOR

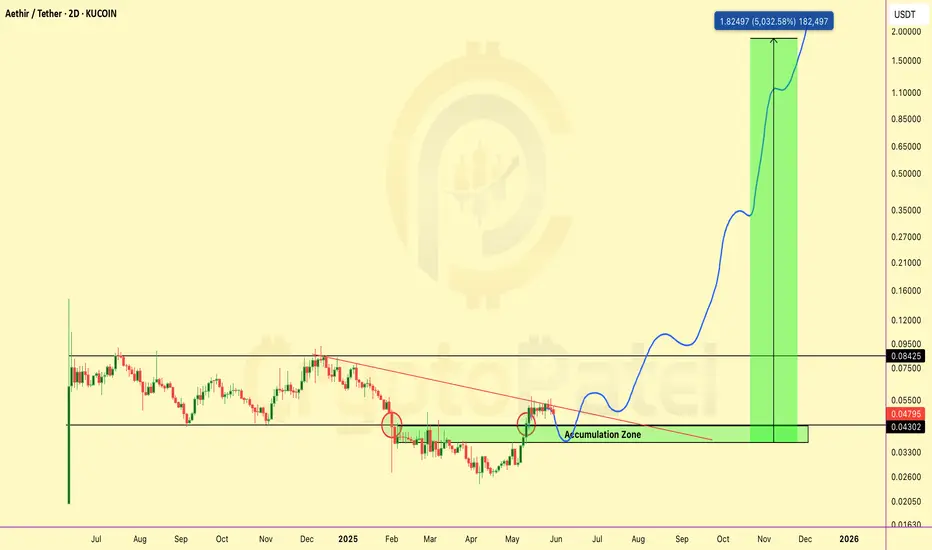
$ATH = AWS of Web3? Backed by Big VCs & Could 50xTSX:ATH = AWS of Web3? Backed by Big VCs & Could 50x
Here’s Why I’m Bullish on #AETHIR 👇
Aethir ( TSX:ATH ) is building a decentralized GPU cloud for AI, gaming, and big compute — imagine AWS on Web3.
And guess what? It’s still early.
Why Aethir is Super Bullish Right Now:
▶️ Massive Use Case – Powers AI, metaverse, & cloud gaming
▶️ Strong Team – Built by blockchain + AI veterans
▶️ Top VC Backing – Hashkey, Sanctor Capital, Merit Circle
▶️ Real Revenue Model – Users pay in TSX:ATH to access GPU power
This isn’t just a token — it’s a working product with real-world demand.
My Long-Term Accumulation Strategy (Not Financial Advice):
▶️ Buying Zone: $0.048–$0.035
▶️ Major Resistance Level: $0.085
▶️ If we break above, next leg could fly.
▶️ Targets I’m Watching: $0.1 → $0.5 → $1 → $2
I’ll add more if price dips hard — I see long-term potential.
This could be one of the biggest infrastructure plays of this bull run.
The kind of project you’ll wish you bought early.
Save this. Come back in 1-2 Years. Let’s see who was early.
🔥 If you found this early alpha valuable:
👍 Like to show love
🔁 Retweet to spread the gem
💬 Comment your TSX:ATH target below
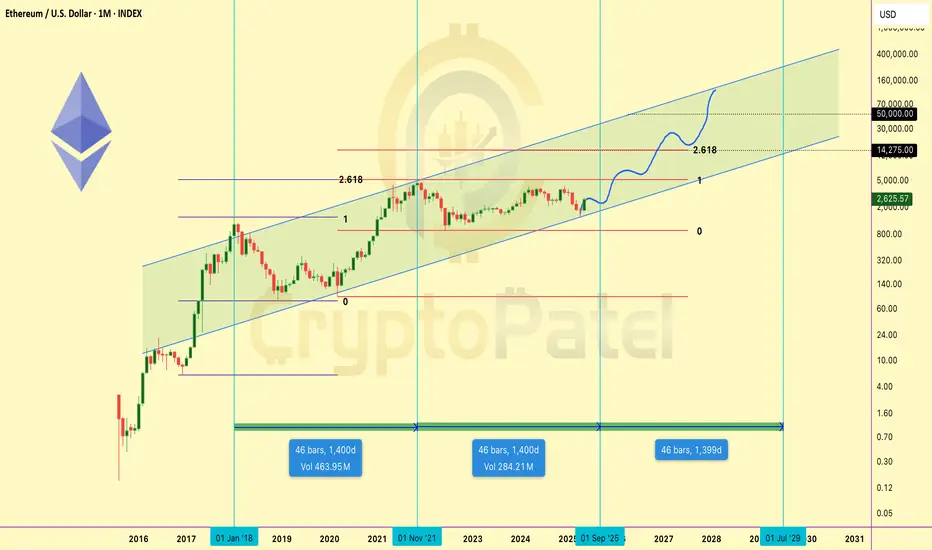
Ethereum Macro Chart Breakdown – Eyeing $10K+ Targets! Ethereum Macro Chart Breakdown – Eyeing $10K+ Targets!
Let’s zoom out and look at the bigger picture for CRYPTOCAP:ETH – this isn't just a pump; it’s a potential parabolic supercycle forming.
Technical Outlook:
Fractal Pattern Analysis
Ethereum is following a similar macro-structure to its 2017–2021 cycle, where after a long consolidation and accumulation phase, it exploded nearly 30x from bottom to top.
Current price action mirrors the post-2019 structure, and we’re at the same breakout stage right now.
Fibonacci Projections
Using the Fibonacci extension from the previous bear market low to the bull market top, and applying the same ratio from the 2022 bottom:
🔹 1.618 Fib = ~$10,000
🔹 2.618 Fib = ~$14,000
These targets align with Q4 2025–Q1 2026, based on previous cycle timings.
Structural Support
ETH is now trading above its 100-week EMA and holding bullish structure on higher timeframes. Previous resistance at $2,500 has flipped into strong support.
Momentum & Fundamentals
🔹 Layer 2 scaling is booming (Arbitrum, Base, zkSync)
🔹 Institutional ETH ETFs are launching
🔹 ETH powers Web3, DeFi, AI infra, RWAs, and more
🔹 Ultra-sound money supply dynamics + staking yield
🔹 Ecosystem growth is organic and robust
Projected Targets:
🎯 Short/Mid-Term (Q4 2025): $10,000 – $14,000
🚀 Ultra Long-Term (2029–2030): $40,000 – $50,000
If you still believe ETH is “just another altcoin,” you’re missing the bigger picture. Ethereum isn’t a meme — it’s the backbone of digital value, smart contracts, and future finance.
I’m long and accumulating ETH on dips. This isn’t just a trade — it’s a conviction play.
🗨️ Drop your ETH target in the comments 👇
🔁 Share this with someone sleeping on ETH!
Note: This is NFA So DYOR
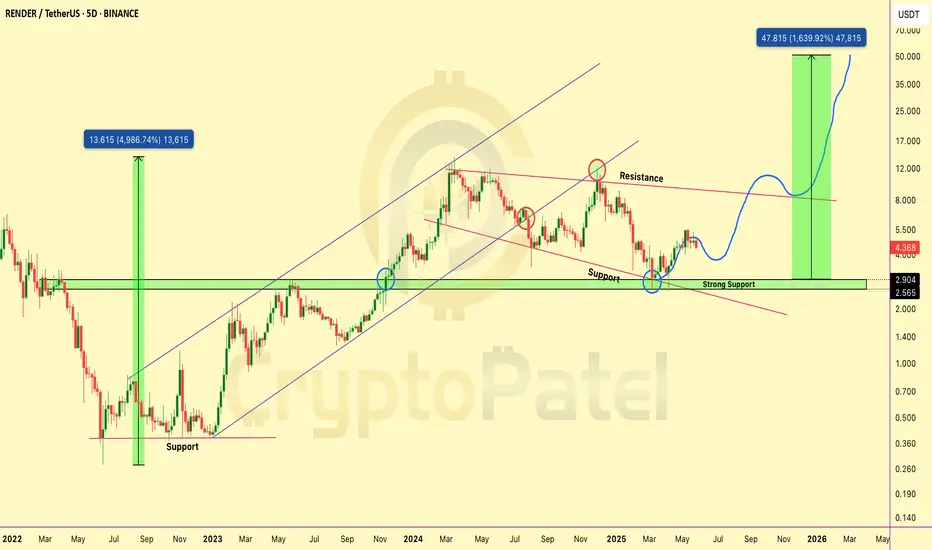
$RENDER Could Be the Next Nvidia of CryptoCRYPTOCAP:RENDER Could Be the Next Nvidia of Crypto
CRYPTOCAP:RENDER is one of the strongest AI projects in crypto right now — and it’s only getting started. The dip you see now?
That’s an accumulation opportunity for long-term believers!
▶️ Best Buy Zone: $4 – $3.40
▶️ Targets: $8.6 / $15 / $25 / $40 / $50
▶️ Strong Support: $2.90 – $2.50
As long as we’re above that — we’re super bullish! ✅
Why CRYPTOCAP:RENDER Can Hit $30–$50 This Cycle:
✅ Solves real problems – powers AI, 3D, VFX, gaming
✅ Trusted by giants – Netflix, Disney, Apple, Unreal Engine
✅ Limited supply + burn = strong tokenomics
✅ On Solana now – faster, cheaper, better
✅ Rides the AI wave – GPU demand is booming
✅ Last cycle = 49x. This time? Bigger stage, bigger vision.
It’s like the Nvidia of Web3 — but decentralized.
👇 If you believe in the future of AI + GPU power…
Keep your eyes on $RENDER. This one’s not just hype.
NFA & DYOR
Big Triangle Forming on $NEAR — Massive Breakout Ahead!Big Triangle Forming on CBOE:NEAR — Massive Breakout Ahead!
CBOE:NEAR is showing strong bullish structure on the HTF – it's forming a large symmetrical triangle pattern, which often signals an explosive breakout move.
Technical Analysis Overview:
▶️ Best Accumulation Zone: $2.90 – $2.10
▶️ Targets: $5 / $10 / $20 / $30 / $50
▶️ Invalidation Below: $1.80
Once we break out of this triangle, the upside move could be massive.
Why I’m Bullish on NEAR:
✅ AI + Blockchain = Future – NEAR is already delivering real AI tools & apps
✅ User & Dev Growth – Ecosystem expanding fast
✅ Modular Infrastructure – Becoming the base layer for multichain apps like Celestia
✅ FastAuth + BOS – Easy Web2-like onboarding + AI-native UX
✅ Backed by Big Players – a16z, Circle, Tiger Global all invested
In the last cycle, CBOE:NEAR did 38x with just hype.
This cycle? It has the tech, adoption, and perfect timing.
Don’t sleep on $NEAR. It’s not hype — it’s building the future.
Note: NFA & DYOR
