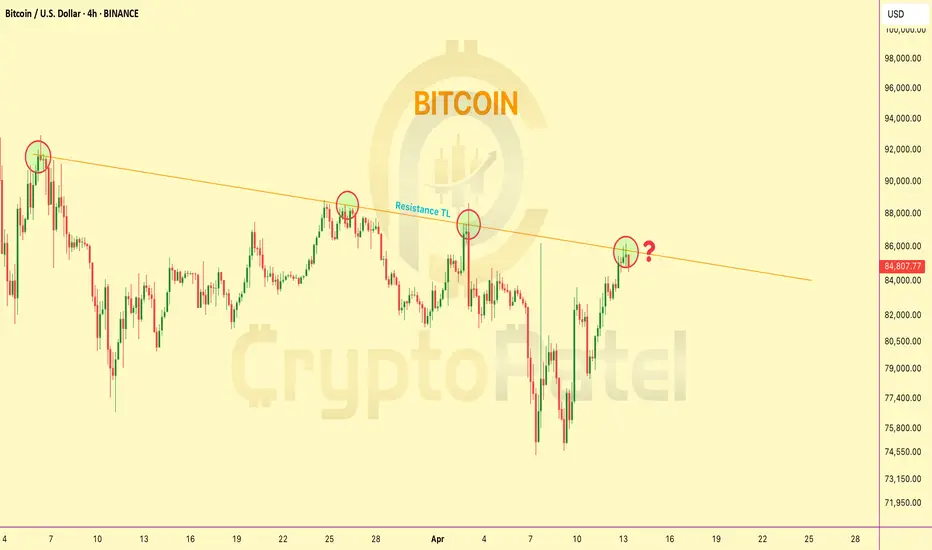
Bitcoin trading at Resistance level so What Next?🚨 Bitcoin 4H Chart Update
CRYPTOCAP:BTC is now trading right at the trendline resistance on the 4H chart
So what’s next?
1️⃣ Breakout and blast toward $100K?
2️⃣ Or another rejection down below $70K?
The decision point is HERE.
This breakout could change the game.
👇 Drop your thoughts –
Bitcoin (Cryptocurrency)
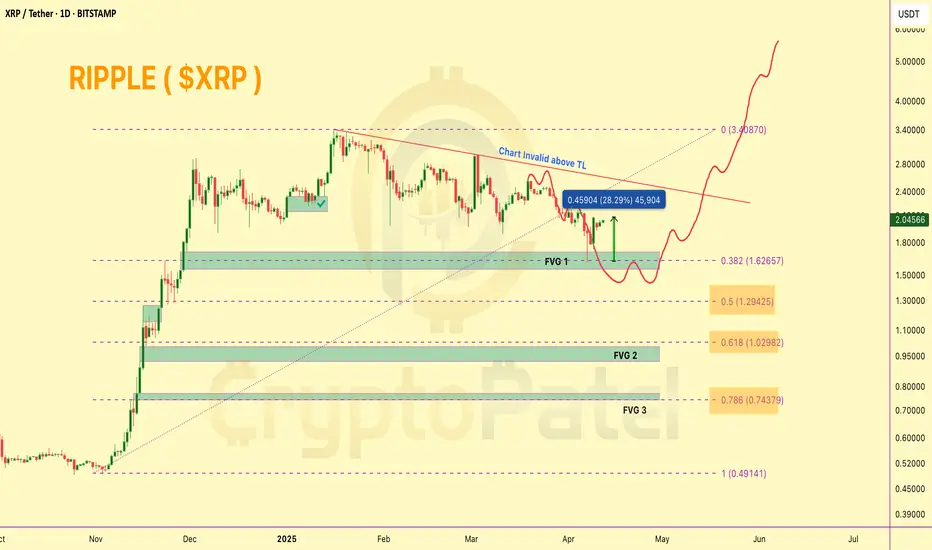
XRP Up 28% From Our Support Call – What’s Next?XRP Up 28% From Our Support Call – What’s Next?
CRYPTOCAP:XRP perfectly respected the FVG 1 zone around $1.60, which we previously marked as a strong support. Since then, price has rebounded over 28% from that level.
Hope you didn’t get caught buying the $2.40–$2.50 zone — as warned, that area showed signs of exhaustion, and price has dropped 30% since.
What’s Next?
If bullish momentum continues, #XRP could revisit the $2.40–$2.50 resistance area. However, this zone may act as a rejection point once again.
From there, we could potentially see a pullback toward $1.30 and $1.00, which aligns with FVG support zones and the 0.5–0.618 Fib retracement levels — key areas where a strong bounce is likely.
🟢 Macro Bias: I remain bullish on XRP/USDT in this cycle and still expect a move toward $7–$10 in the broader bull market. Best entries will likely come during dips into major support zones.
❌ Invalidation Level: This chart setup gets invalidated on an HTF close above $2.50.
Keep it smart — entries on dips, not at tops. 👀
BTC/USDT – 30-Min Chart Technical BreakdownBTC/USDT – 30-Min Chart Technical Breakdown
🔺 Pattern Formation:
Price action is currently developing a rising wedge, generally considered a bearish continuation pattern. However, the ongoing Higher High (HH) and Higher Low (HL) structure suggests short-term bullish momentum is still intact.
Key Resistance Levels:
* $84,700 – Major horizontal resistance
* $83,600 – Local supply zone / recent rejection point
Key Support Levels:
* $81,200 – Trendline + structure support (wedge base)
* $78,400 – Secondary structural support
* $74,900 – High-confluence demand zone
Long Setup (High-Risk Trade – Counter to Pattern Bias):
* Entry Zone: $82,500 – $83,000 (wedge support retest zone)
* TP1: $83,900
* TP2: $85,200
* TP3: $87,000 (upper wedge boundary)
* SL: Below $81,100 (wedge break + structural invalidation)
Confirmation Needed:
Watch for bullish engulfing or a strong bounce from the wedge support (red dashed trendline) with solid volume influx.
Risk Note:
Despite current bullish flow, wedge patterns often resolve bearishly. If price breaches below $81,100, invalidate longs and reassess for possible shorting opportunity.

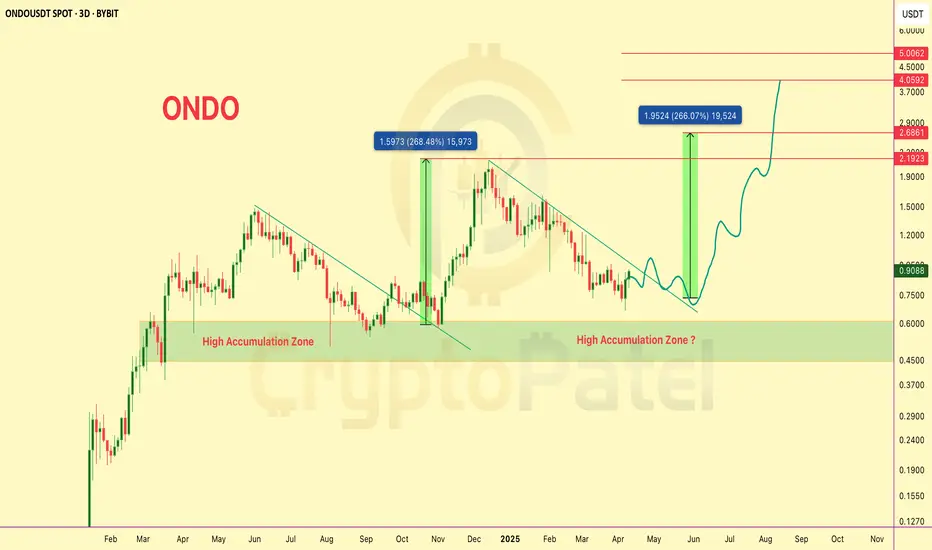
$ONDO/USDT – 3D Chart Analysis (Fractal-Based Outlook)$ONDO/USDT – 3D Chart Analysis (Fractal-Based Outlook)
🔰 Pattern Recognition & Fractal Analysis:
▪️ ONDO previously broke out from a falling wedge pattern in late Q4 2024, resulting in a +268% rally.
▪️ Current price action mirrors that historical fractal, again forming a descending channel with strong demand visible around the $0.60–$0.45 zone — marked as a High Accumulation Zone.
🔰 Current Market Structure:
▪️ Price has respected the descending resistance trendline and now shows signs of breakout attempt.
▪️ A recent bullish engulfing candle near the lower boundary of the accumulation zone suggests potential reversal.
▪️ Volume is picking up, aligning with previous breakout volume behavior.
🔰 Key Technical Zones:
▪️ Accumulation Zone: $0.60 – $0.45
▪️ Immediate Resistance: $1.20 (psychological)
▪️ Breakout Confirmation: Weekly close above $1.30
▪️ Fibonacci Extensions:
1.618 Fib Target: $2.18
2.618 Fib Target: $2.68
Final Bullish Extension: $4.05–$5.00 zone
🔰 Future Projection (Fractal Repeat):
▪️ If breakout mirrors previous fractal, expect ~266% upside — targeting $2.60+ in the next 2–3 months.
▪️ Intermediate pullbacks likely near $1.50 and $2.20 due to historical liquidity zones.
⚠️ Risk Management Note:
▪️ Invalidity below $0.45. If price fails to hold the current range, possible revisit to $0.30–$0.25 range.
▪️ Traders should monitor for volume confirmation and potential bullish divergence on LTFs (Lower Timeframes).
📌 For more real-time analysis, stay tuned. More fractal setups dropping soon.
Bitcoin Ready for New ATH or New LowBitcoin Update:
If Bitcoin Price Break $83000 and 4H Close above then It Turned into Bullish Mode Otherwise Ready for New Low Again....

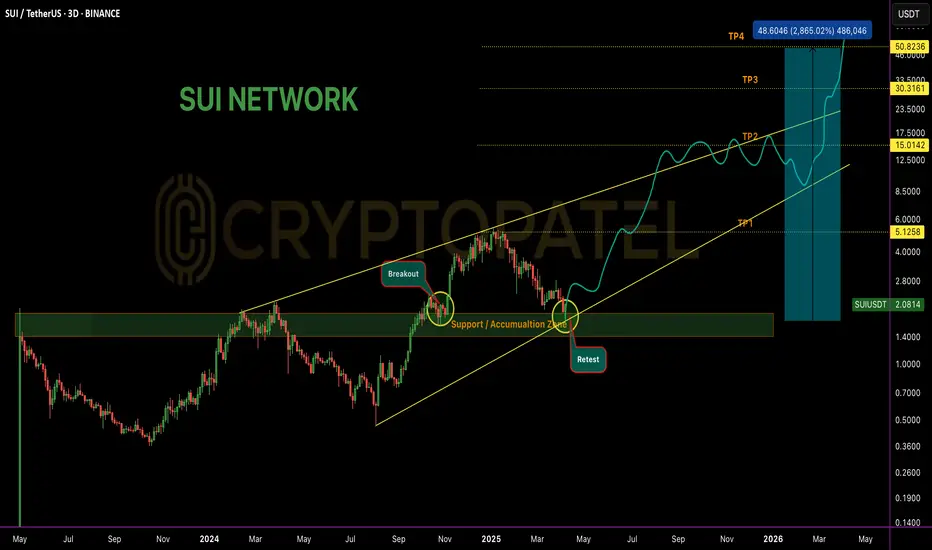
#SUI to $50 in the Future? Which is 25x-30x ?#SUI to $50 in the Future?
I won’t tell you why — because that’s where your research comes in.
But here’s a clue:
▪️ Accumulation Zone: Below or around $2
▪️ Patience = Potential
▪️ Come back and thank me in 3–4 years.
Not Financial Advice — Always DYOR.
The Market Looks Brutal Right Now... But Stay With MeThe Market Looks Brutal Right Now... But Stay With Me
It feels like a bloodbath out there… but here’s the truth:
A fast and brutal dump is honestly better than a slow, painful bleed. It shakes out the weak hands quickly—and sets the stage for stronger recoveries.
We've seen this movie before:
▪️ The Covid flash crash
▪️ War shocks like Russia vs Ukraine
▪️ Black swan events like FTX blowing up
▪️ The chaos of the LUNA death spiral
➡️ Each time, fear dominated the feed.
➡️ Each time, the "This time it's different!" crowd got louder.
➡️ And each time, those who stayed calm and DCA’d into real projects walked away with massive wins.
So why should this time—just because of tariffs or macro FUD—be any different?
It’s not.
Zoom out.
The long-term trend is built on strong fundamentals, not headlines.
Stick to the plan: accumulate multi-cycle, high-cap coins. Ride the wave.
The short-term noise fades, but smart strategy compounds.

BITCOIN BULLISH POTENTIALPrice has entered the discount zone near a weak low, signaling a potential reversal as smart money may be accumulating after a liquidity sweep. This area often serves as a launchpad for bullish moves, especially when sell-side liquidity has been taken.
Short-term sentiment is shifting bullish, suggesting momentum could be building for a move upward. With key bearish targets already met, the downward pressure may be fading, setting the stage for a corrective move or full reversal.
If bullish structure forms—such as a break of structure or a bullish order block holding—price could begin climbing toward equilibrium and possibly into premium territory. Look for confirmation through price action and volume shifts.

Huge fall in bitcoin, let's play some contra now with small SLHello Traders! In today’s post, we’re looking at Bitcoin (BTC) on the 15-minute chart. The price is currently showing a potential reversal setup, with the market consolidating around 78,000. The recent price action suggests that Bitcoin could either push higher or face further downside depending on how it reacts to this level.
The MACD is showing some Bullish crossver on chart, may be we can see some positive reversal momentum from here, but watch for the price action to confirm whether a reversal is likely. If Bitcoin does not take our stop loss, we could see a move toward 79,892. Stay sharp, and as always, manage your risk effectively!
Disclaimer: This analysis is for educational purposes only. Please consult a financial advisor before making investment decisions.
If you Found this helpful? Don’t forget to like, share, and drop your thoughts in the comments below.

Bitcoin - 140 K in 2025 - 5th wave targetPrice is at technically buying zone - Fib buy zone and also breakout zone and right now double bottom. at any price around this price based on big players buying orders fourth wave will get completed and 5th wave will start. Breakout of resistance red line is confirmation of 5th wave progress. previous resistance areas could give selling pressures due to tax fears and global recession fears. Supporting reasons - Strategic reserve and US Govt is one new player now. what ever buying happening during bear trend will be visible only in data about who is buying like Black Rock, Strategy - Saylor etc. As and when positive mood comes in market BTC will keep bouncing back and price is accumulation area for sure for big players. This is not a time to sell but to accumulate BTC for sure. All tax war will only slowdown the BTC up move but will not fall further much. But still hold long qty with required margins and to be safe keep liquidation levels as 73 at least to be safer to avoid any big liquidation candle in case any exchange liquidate retail people's holdings. US Strategic reserve data is awaited. Every Monday Saylor in his X profile posting his purchases and Black Rock too seen buying BTC last several days or weeks, Price is dropping since loose hands sell in fear. As per data, spot buyers didnt sell at all. Its only traders with 50x or 100x moving the market.

Btc Current Posible scenario
Please note that cryptocurrency markets are highly volatile, and prices can change rapidly. It's advisable to consult multiple sources and stay updated with the latest market trends before making any investment decisions.

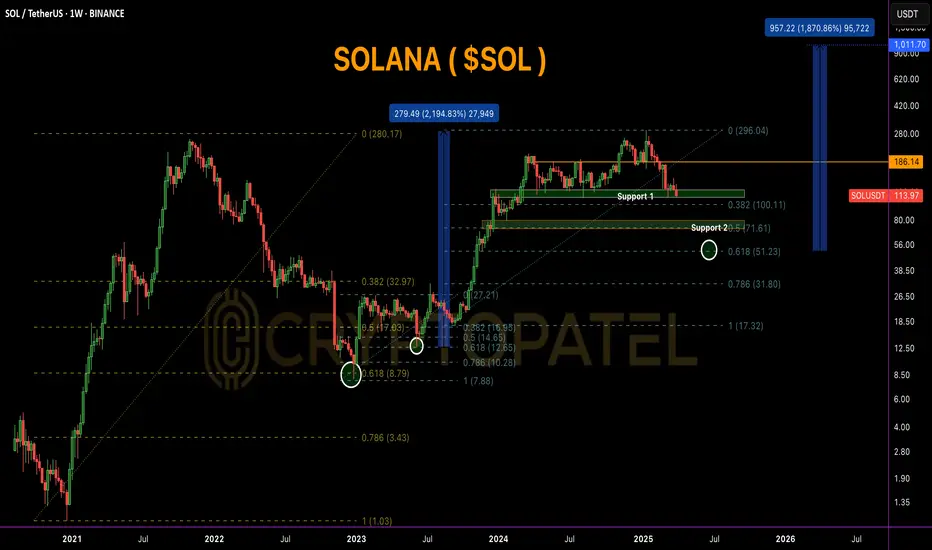
SOLANA Weekly Chart Breakdown–2020 Fractal Signals Massive Bull#SOLANA Weekly Chart Breakdown – 2020 Fractal Signals Massive Rally Ahead!
CRYPTOCAP:SOL is trading at $114.35, currently sitting on a key Fibonacci 0.382 support zone ($100–$115). This area has historically acted as a strong bounce level and is perfect for early accumulation.
If this zone fails, the next major support is the golden pocket ($50–$72) — also marked as Support 2, aligning with the 0.618 Fib retracement.
Historically, this level triggered a 2,100% rally back in 2020-21. If this fractal pattern repeats, we could be looking at a future target near $1,000+.
Breakout level to watch:
▪️ $186 = Bullish confirmation
▪️ $296 = Previous ATH
▪️ $1,011 = Fibonacci-based bull cycle target
Accumulation Plan:
▪️ Zone 1: $100–$115 → Light spot entries
▪️ Zone 2: $50–$72 → Heavy long-term accumulation
✅ Holding above $100 keeps the bullish structure intact.
✅ Break above $186 = start of the next bull wave.
Smart accumulation now can lead to 10x+ returns in the upcoming cycle!
It's All About SO/USDT Overview.
Bitcoin Short played out perfectly and Down 7%Bitcoin Short played out perfectly.
Price respected the SMC chart structure — 4H candle failed to close above FVG + -OB zone.
Post Trump Tariff news, market triggered high-leverage stop hunts with a fake pump before a sharp dump.
📉 Entry: $88,440 ✅
📈 Exit: $82,200 ✅
✅ ~7% move captured. Trade closed in profit.

BTC - 3rd April 2025 At Support now - Good to buy long qty nowBTC looks good to buy long qty at previous support zone of 82200 to 81300 zone. In 2 days US Govt going to announce how much crypto they have now and what they did last few days after announcing strategic reserve. At least for again 88 or 89 K levels looks possible from there. By next week or this april month all tax fears will fade. And good change for this weekend NFP and other data could take importance for new trend. Use this view for educational purpose and consult ur advisor or take your own decision for taking trades.

Bitcoin Fresh Update#Bitcoin 4H Chart Update
🔻 Bearish OB: $86,940 – $87,728
🕳️ FVG: $86,750 – $84,800 (Filled)
📌 Key Level: 4H close above OB = bullish continuation
❌ Rejection = prepare for the next leg down

Btc analysis 31st marchHello
It's a jayesh balar.
If you have a any "Questions"
Ask me in comment
If my analysis is helpful,
press booster bottom.
Bitcoin Breaks Key SupportBTC has just broken down from an important support level, which is now likely to act as resistance around the 84,000 area. The price currently at 81,415, indicating a relatively significant breakdown.
What's particularly concerning here is that we've not only dropped below that horizontal support zone (now resistance), but we've also broken below the green ascending trendline that had been supporting price action since early March. This double breakdown (horizontal support + trendline support) strengthens the bearish case in the near term.
The chart shows that Bitcoin had been trading within a rising channel, but this recent move suggests we might be seeing a shift in market structure. Note how price already attempted a recovery after the initial breakdown but was rejected right at the underside of that previous support zone, confirming it's now acting as resistance.
Looking at the bigger picture, there's still that major resistance zone sitting around 93,000-95,000 that capped previous rallies. For longer-term bulls, the substantial support zone around 72K-74K (marked by the green horizontal area) could be the level to watch if this current weakness continues.

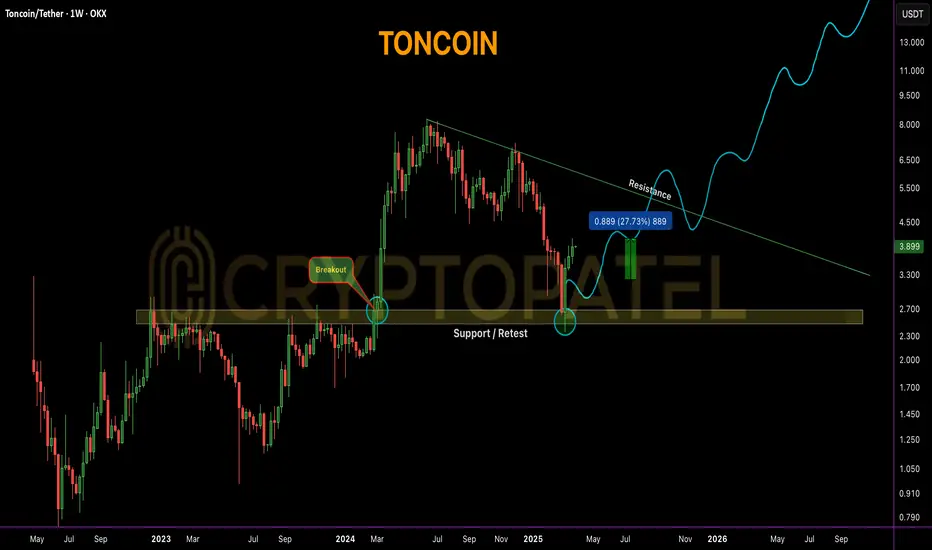
$TON Alert: FVG, Accumulation Range & Bullish Roadmap ExplainedCRYPTOCAP:TON Traders Alert: FVG Zone, Accumulation Range & Bullish Roadmap Explained!
#TONCOIN is currently trading around $3.90, up +27% from our earlier entry near $3.20.
🔹 Scalpers may consider booking partial profits at current levels due to short-term resistance zones.
Key Levels:
🔹 Support: $2.50, $2.95–$3.33 (FVG zone), $2.50 (major demand zone)
🔹 Resistance: $4.15 – $4.50 (next breakout levels)
FVG Zone (Daily TF): $3.33 – $2.95
If price revisits this imbalance zone, it may offer a high-probability entry opportunity.
Long-Term View: As the native token of Telegram’s TON blockchain, #TON has strong utility. If adoption continues, potential upside targets could be:
Targets: Mid-Term: $10+ | Long-Term: $50 – $100
Accumulation Zone (for long-term investors): $3.50 – $2.50
Price bounced strongly from $2.50, confirming it as a solid base.
⚠️ This is not financial advice. Always DYOR before investing.
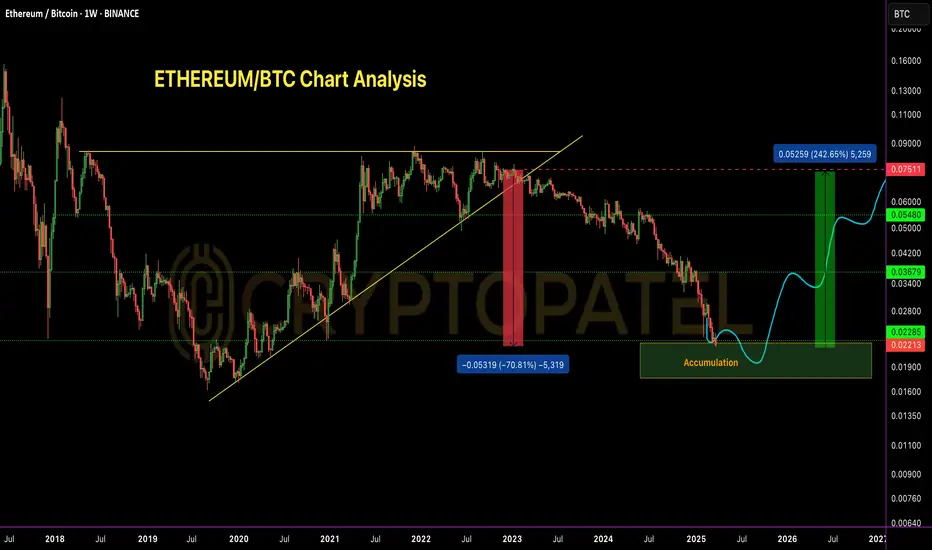
ETH/BTC – 70% Drop Achieved | Perfect Short ExecutionETH/BTC – 70% Drop Achieved | Perfect Short Execution
As projected in my analysis dated 10th Nov 2022, ETH/BTC has completed the anticipated 70% correction from the top.
Short Entry: 0.075 BTC ✅
TP1: 0.055 BTC – ✅
TP2: 0.037 BTC – ✅
TP3: 0.023 BTC – ✅
All targets achieved with precision.
Bearish structure played out as expected.
Current Outlook:
CRYPTOCAP:ETH Price has now entered a historical demand zone, coinciding with major multi-year support levels.
Accumulation Phase Activated –
Starting to scale into long positions from current levels, targeting mid-to-long term reversal setup.
Patience required – this could be the base of the next macro leg up.
Note: NFA & DYOR
#Ethereum
#Ethereum Is Down Now, But History Says a $10K Rally Is Coming…#Ethereum Is Down Now, But History Says a $10K Rally Is Coming…
1⃣ CRYPTOCAP:ETH rallied 228x post-2016 BTC halving
2⃣ ETH did 27x post-2020 halving
3⃣ Currently -57% from ATH post-2024 halving
📅 Projection: Q4 2025 ATH
🔼 Target Range: $7,000 - $10,000
Based on cyclical trend extension, Fibonacci macro structure, and historical BTC-ETH correlation.
What’s your ETH EOY 2025 target? RT & Comments if you Agree👇
#Altseason
Note: This is Not financial Advice so DYOR before Investing.

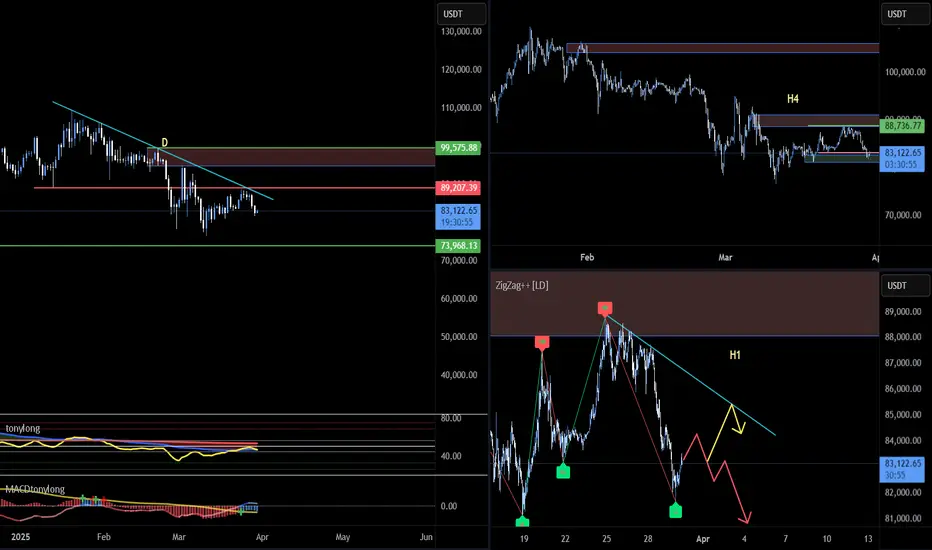
BTC23: BTC falls again. Testing support or finding a new bottom?📊 BINANCE:BTCUSD continued to decrease again in the past 2 days. Let's evaluate and look for opportunities through the multi-timeframe perspective below BINANCE:BTCUSDT :
🔹 **D Frame**: Before the price decrease in the past 2 days, we can see that although BTC had a recovery phase before, the fake decrease structure has not been broken yet.
🔹 **H4 Frame**: The keylever zone has been broken as marked on the chart, however, this is the first decrease after the increase wave in the past days, so it will need clearer confirmation.
🔹 **H1 Frame**: Currently, the price is reacting to the support zone of 81~83k. However, the price is still in a downward wave if looking at the price structure.
🚀 **Trading plan:*
📌 At the present time, we can look for a SELL position in line with the main trend in diagonal resistance areas to look for a trading position in line with the main trend. The current price is at an important support area, so it is no longer suitable to SELL at this time. BUYing in this area is not recommended when the downtrend has not shown any signs of ending. We will have to wait for a clearer signal from the price structure to properly assess the effect of the current support area.
💪 **Wishing you success in making a profit!**
$ETH has dropped -40% since Eric Trump recommended buying it.JUST IN : CRYPTOCAP:ETH has dropped -40% since Eric Trump recommended buying it.
Just a gentle reminder to always DYOR (Do Your Own Research) before making investment decisions.
#Ethereum

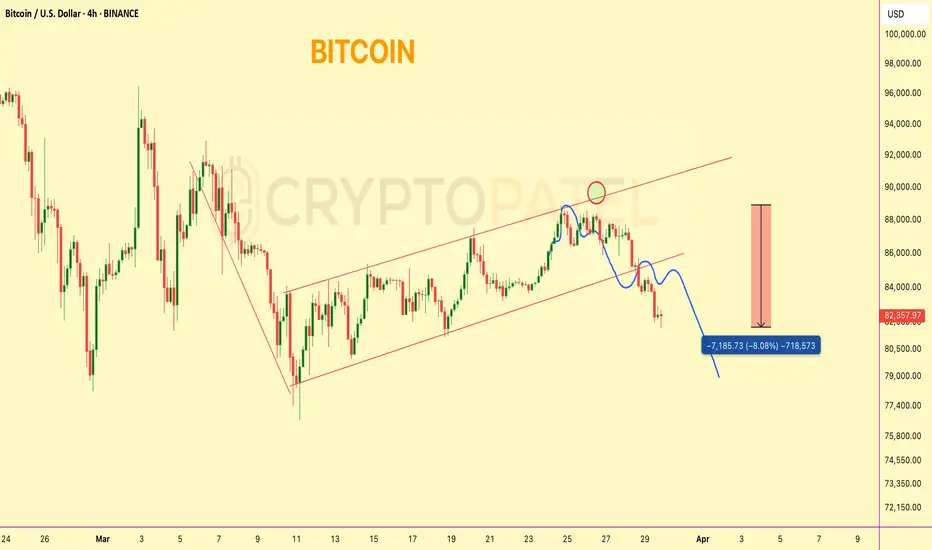
Bitcoin Dumped from our Entry levels and now 8% down#Bitcoin Bearish Flag Update
Price rejected perfectly from $89,000 resistance — our short setup played out with a solid -8% move.
Currently trading around key support at $82,000.
Trend Bias: Bearish below $85,700
Next major support: $75,000–$70,000 zone
Structure still favors further downside unless $85.7K is reclaimed.