Wave 4 Trap Complete as Bitcoin Prepares for Final Flush6 Days Ago
3 Days Ago
1 December 2025 :
BTC moved into the expected corrective zone last week but stayed inside the falling channel, showing that wave 4 was only a temporary bounce. Buyers failed to break any key resistance, and momentum kept fading. This kept the broader outlook bearish and hinted that wave 5 was still pending.
BTC has now broken below the short-term rising structure, confirming that wave 4 topped out near the 0.786 retracement. The rejection from that zone triggered a clean shift back into the main downtrend, with price sliding toward the key 86,280 support. As long as BTC holds below the upper channel boundary, the market remains positioned for further downside, with the 1.618 extension around 79,650 emerging as the next probable target for wave 5 completion.
Note:
The rejection from the 0.786–resistance zone shows buyers failed to take control.
Wave B at 86,280 is the immediate pivot level; staying below it keeps downside pressure intact.
The next major target for wave 5 sits near the 1.618 extension around 79,650.
Stay Tuned :)
@Money_Dictators
Bitcoin (Cryptocurrency)

Bitcoin - Elliott Wave Analysis - weekly TFHallo crypto traders bitcoin completed Expanding leading diagonal pattern in grand super cycle degree now in correction phase so wait for long fib ret 61.8% level then big move starts (wave 3)

$BTC: Technical Breakdown (High-Probability Bearish Setup)CRYPTOCAP:BTC : Technical Breakdown (High-Probability Bearish Setup)
Market Structure Shift
Bitcoin has Already lost $107000 major bullish support and is sustaining below it, confirming a bearish market phase.
The Head & Shoulders distribution pattern is fully validated.
Head & Shoulders Measurement
As per classical H&S rules, the 162% extension target of the pattern has already been achieved on the downside, indicating:
🔹 Pattern completion
🔹 Cycle top likely formed
🔹 Transition from bull to bear phase
Fibonacci Retracement (Macro Bear Framework)
Measured from bear-market low → cycle top, Fibonacci levels project:
0.382 Fib: ~$56,700
0.5 Fib: ~$44,000 → key bear market acceptance zone
0.618 Fib: ~$35,000 → strongest macro support / worst-case scenario
Current price action still reflects a healthy macro retracement, not capitulation.
Liquidity & Imbalance
Despite the bearish structure, a Fair Value Gap (FVG) remains unmitigated in the $98,000–$100,000 range.
This level may act as a liquidity magnet before the next impulsive leg down.
Bias & Scenarios
Primary bias: Bearish
Relief rally possibility: $98K–$100K (FVG fill)
Next downside leg: $70K–$60K, then deeper Fib supports
Conclusion
With H&S 162% target completed and structure broken, BTC remains bearish by technical definition.
Trade only with confirmation, manage risk, and respect all valid scenarios.
NFa & DYOR

How Funds Actually Make Money From Bitcoin📰 I’ve followed financial markets long enough to notice a strange paradox:
spend more than five minutes scrolling Crypto TikTok (YouTube or X isn’t much different), and you’d think the entire crypto market is run by a few whale clicks and a handful of flashy headlines.
You’re constantly told that:
📉 Someone is “buying the dip”
📈 Someone else is “selling the top”
🐋 And a major institution is “deciding the fate of the market”
It sounds reasonable.
But in reality… it’s far more complex than that.
📣 I’ve watched hundreds of videos like these. The script is always the same.
Glossy thumbnails, rushed voices, and absolute statements:
“BlackRock is buying — PRICE IS GOING UP!”
“Whales are selling — THE MARKET IS ABOUT TO CRASH!”
“Institutional money is here!!!”
🎭 But beneath the drama, what’s really there?
No nuance. No structure. And almost no understanding of how institutions actually make money.
🔍 Here’s the truth I’ve learned after years of observing the markets:
Whether BlackRock buys or sells Bitcoin has very little to do with you.
Large funds don’t trade on emotion, nor do they survive by predicting direction like retail traders do.
They don’t need Bitcoin to go up.
They don’t need Bitcoin to go down.
🎯 What they need is volatility — calculated, measured, and modeled.
🧠 This is the part most TikTok content completely ignores.
A fund can buy Bitcoin and at the same time:
🛡️ Hedge 100% of its risk
⚖️ Stay delta-neutral
📊 Maintain a neutral market view
🔒 Be protected against both upside and downside moves
👉 For them, buying BTC is not a gamble.
It’s simply the first layer of a multi-leg trading structure.
What matters isn’t how much they buy,
but what comes next — the steps most retail traders have never even heard of.
📉📈 I often ask myself:
Why do so many “TikTok analysts” talk about institutions every day, yet never mention delta, gamma, hedging, or basis?
The answer is simple:
👉 Because they don’t understand it.
If someone:
screams “bullish” and “bearish” in every video
believes institutions are “pumping prices”
but can’t explain delta-neutral hedging
then their opinion on what BlackRock is “doing” has no analytical value.
📊 To really understand this, let’s look at how a fund actually makes money.
Assume Bitcoin is trading at $100,000.
The fund doesn’t care whether price goes up or down.
They deploy a neutral options structure, betting on volatility , not direction.
When price rises:
they sell part of the position to rebalance risk
profit comes from selling at higher levels
When price falls:
they buy back at lower prices
profit comes from buying cheaper
🔁 Price up → sell high
🔁 Price down → buy low
👉 Repeat. With discipline. Without emotion.
This is gamma scalping — the quiet, persistent profit engine behind institutional trading.
💰 So where does their real profit come from?
Not from news.
Not from influencers.
Not from ETF headlines.
It comes from:
continuous hedge adjustments
realized volatility exceeding expectations
direction-neutral structures
strict mathematical discipline
⛔ The rare moment they struggle?
When the market… doesn’t move at all.
🧭 And here’s what I want to say to you directly, as a market professional:
You are not BlackRock.
You don’t have their infrastructure.
You don’t have their capital, speed, or risk models.
👉 Trying to predict or mimic their actions won’t make you a better trader — it will only make you more confused.
✍️ My conclusion is very clear:
Watching what large funds do without understanding the structure behind it
is the fastest path to losses.
BlackRock doesn’t trade narratives.
They don’t trade emotions.
And they certainly don’t trade TikTok stories.
🎯 They trade structure.
And you?
Stop watching what they do.
Start understanding what you should do.
That’s the difference between surviva l and being washed out by the market.
PS: BlackRock and TikTok are used purely as illustrative examples.

Why Bitcoin Hits Your Stop Loss Before the Real MoveWhy Bitcoin Hits Your Stop Loss Before the Real Move
Have you ever placed a Bitcoin trade and noticed this? 🤔
Your stop loss 😭💸 gets hit… just a few pips from your entry… then the price suddenly rockets 🚀💎 in the direction you were expecting!
This is not bad luck. It’s a Stop Loss Hunt 💥, used by smart money 🏦💰 to collect liquidity before the real trend begins.
1️⃣ Liquidity Pools Above Highs & Below Lows 📊💎
Retail traders place stop losses at obvious highs/lows 📈📉
These stops create liquidity zones 💧, which smart money targets 🔍
Price moves to these zones to collect liquidity → fuels the next trend 🚀
Example:
BTC trending upward 📈
Traders place buy stops above the previous high ⬆️
Smart money pushes price to trigger stops 💥 → collects liquidity 💎 → then moves the price in the real trend direction 🚀
2️⃣ Stop Loss Sweep 💥⚡
Price triggers retail stop losses 🛑
Retail traders get stopped out 😭💸
Institutions enter large positions with minimal resistance 💹
Key Insight:
Price needs liquidity 💧 to move strongly.
Without collecting stops, smart money cannot drive momentum efficiently ⚡
3️⃣ Fake Breakouts & Wicks 🌪️🔥
Watch for wick spikes or sudden breakouts 🕵️♂️
These are stop loss hunts
Many traders panic 😱 and exit positions
Smart money uses this to trap retail traders and continue the trend 🚀
4️⃣ The Real Move Begins 🚀🔥
After liquidity is collected 💎💧
The true trend resumes 📈
Traders who waited can enter safely 🧘♂️💹
Often, the move is stronger and faster ⚡ because institutions now control the market
5️⃣ Market Psychology Behind Stop Hunts 🧠💭
Retail traders panic when stops are triggered 😅💸
Fear is used to manipulate sentiment 🧲
Recognizing this psychological trap helps you stay calm 🧘♂️ and trade strategically 🏆
6️⃣ How to Trade Stop Loss Hunts 💡🧠
✅ Avoid stops at obvious highs/lows 🚫
✅ Wait for liquidity sweep ⏳💧
✅ Watch for wick spikes 🌟 — early signs of stop hunts
✅ Follow market structure 📊 (BOS/CHoCH)
✅ Trade after confirmation ⏱️
✅ Patience + discipline = profits 💎💹
7️⃣ Examples in Bitcoin Trading 🔍
Double top wicks above high → triggers stops 💥 → continues trend 🚀
Price dips below support → triggers stops 😭 → rebounds ⬆️
💡 Observation: Every wick tells a story 🌟 — learn to read it!
💬 Key Takeaways
Stop Loss Hunts = institutional footprints 👣
Price hunts liquidity 💧 — that’s why your SL is hit 💥
Understanding this helps you:
Trade smarter 💎
Avoid losses 😅💸
Spot trends before they happen 🚀

$LUNA Finally Catching a breath After Brutal Red Days VIE:LUNA Finally Catching a breath After Brutal Red Days 😮💨
From Bloodbath to Bounce:
🔴 -99.88% massacre (RIP portfolios)
🟢 Now +286% relief at $0.23 From $0.06415 within 21 Days
▶️Major Downtrend line overhead
Major resistance at $0.30-0.38 ahead.
Potential bottom formation or dead cat bounce?
Recovery or bull trap? Time will tell 🤔
EXTREMELY HIGH RISK asset - trade with caution
Not financial advice | DYOR

BTC: Liquidity Sweep SetupBTC: Liquidity Sweep Setup
Bitcoin continues to operate inside a broad equilibrium zone after completing a prolonged downward phase earlier in the month. The decline lost momentum as price entered a high-participation area, where trading activity became increasingly balanced and rotational. Since then, the market has developed a wide consolidation band, signaling a temporary standoff between directional conviction and liquidity accumulation.
Recent sessions show price repeatedly rotating through the center of this zone, forming alternating impulses that lack continuation. This pattern reflects a market focused on collecting orders rather than trending. Each short-lived push quickly transitions back into the range, indicating absorption on both sides and limited willingness from participants to sustain directional movement.
The lower portion of the range has begun attracting more activity, suggesting interest from larger players seeking efficient fill zones before any expansion. Price behaviour here is characterized by controlled sweeps, shallow recoveries, and frequent re-tests of the mid-band — signs of liquidity harvesting rather than aggressive distribution.
Forward behaviour on the chart implies that the market may first dip into the lower liquidity pocket to finalize order collection. Once this pocket is satisfied, conditions become favourable for a transition into an expansion phase targeting the upper boundary of the current equilibrium. This type of structure is common before major repricing, as it reflects the buildup of untriggered positions awaiting execution.
Overall, Bitcoin is in a preparation phase where energy is being stored, volatility is compressing, and liquidity is reorganizing. The next significant development is likely to emerge once the market completes its sweep of inefficient areas inside the range and finds a stable base for expansion.

BTC Breakdown Confirmed – Here’s Where BTC Could Surge NextBTC Breakdown Confirmed – Here’s Where BTC Could Surge Next
1️⃣ Long-Term Trendline Breakdown Confirmed
🔹 BTC has decisively broken the multi-year ascending trendline supporting price since Nov 2022.
🔹 The Breakdown + Retest at ~$104k-$108k confirms bearish structure ✅.
🔹 Retest failed in Oct 2025, confirming sellers are in control.
2️⃣ Fibonacci Levels Highlight Strong Demand
🔹 Price is now hovering between 0 Fib ($125,647) and 0.382 Fib ($56,494).
🔹 Measured move Targets: Strong Demand Zone $34,477 - $56,494 (0.618 - 0.382 Fib)
🔹 This is the accumulation zone for long-term positions, historically providing strong bounce potential.
3️⃣ Critical Support / Resistance Zones
🔹 Immediate Support: $85k-$87k (psychological)
Major Support:
🔹 $56,494 (0.382 Fib, upper demand)
🔹 $44,133 (0.5 Fib, middle demand)
🔹 $34,477 (0.618 Fib, “Golden Pocket”, lower demand)
Resistance: Broken trendline now acting as key supply
4️⃣ Potential Scenarios
Bearish (High Probability)
🔹 Continuation down to Strong Demand Zone ($34k-$56k)
🔹 Represents 38-61% retracement from ATH, typical after trendline breakdown + retest
Bullish (Needs Reclaim)
🔹 Reclaim broken trendline (~$95k-$100k)
🔹 Close above $104k = false breakdown, continuation to new highs
Why I’m Watching $56,500 - $34,500 for Longs
🔹 Historical accumulation zone with high probability of a strong bounce
🔹 After breakdown + retest, price often retraces to 0.5 or 0.618 Fib before resuming bull trend
🔹 Perfect long-term entry for those aiming for multi-year BTC upside
BTC may test the $56k-$34k demand zone soon. For long-term holders, this is a prime accumulation area before the next bull cycle. Stay patient and strategic – $1M BTC dreams require discipline, not FOMO.
Guys, don’t judge me: I’m a Bitcoin lover too. I’m just reading what the chart is showing. Even if the short-term looks bearish, I see the setup for a massive long-term move toward $1M 🚀
NFA & DYOR

ETH Premium OB & FVG Zones – ChoCh Could Hit at $3,660ETH Premium OB & FVG Zones – ChoCh Could Hit at $3,660
Market remains in a Bearish Structure with steady LH → LL and clean BOS down. The current upward move is just a retracement into premium.
Key Zones:
FVG: $3,250–3,350 – First Reaction Zone for Short Entries
Bearish OB: $3,600–3,660 – Prime Supply Zone for Shorts
Shorting Strategy:
If you are Shorting ETH, these are the best levels to scale in.
Caution:
Any HTF candle closing above $3,660 Bearish OB signals a ChoCh. Exit shorts immediately, Trend flips bullish, opening the path toward new ATH.
Below $3,660 → bearish continuation likely
Above $3,660 → trend flip, bullish momentum expected
Until the OB break happens, bias stays bearish.
NFA & DYOR

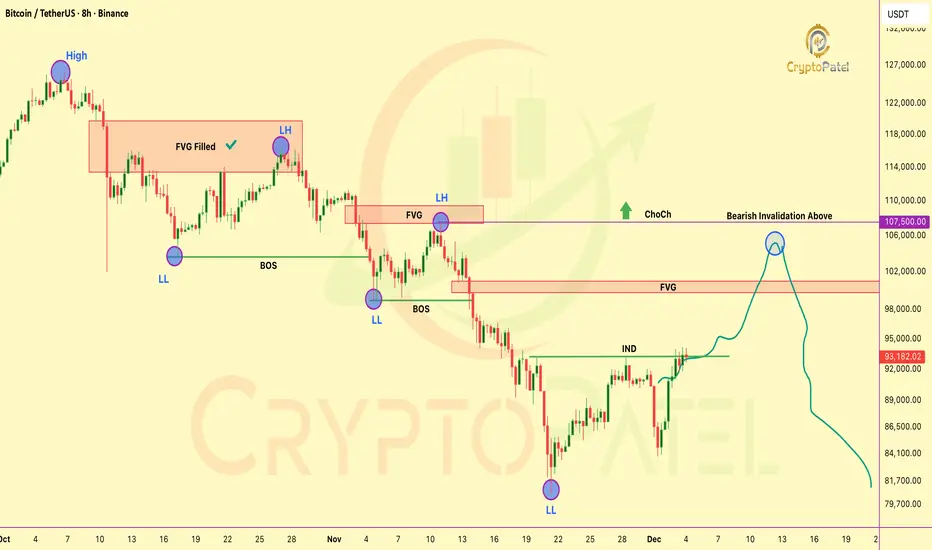
HTF ChoCH Alert: BTC’s Macro Bias Is Still BearishHTF ChoCH Alert: BTC’s Macro Bias Is Still Bearish
BTC is still following clean HTF bearish order-flow (LH → LL → BOS).
The current push up is just a premium retracement, driven by internal liquidity grabs.
Price is reaching for the premium FVG at 99,866–101,184, the next clear draw on liquidity and a prime reversal zone.
Below 107,500 bias stays bearish (Bearish Invalidation / HTF ChoCH)
Expect: BSL sweep → FVG fill → mitigation → sell-side continuation.
ICT view:
Market is simply rebalancing inefficiency before delivering lower.
NFA & DYOR
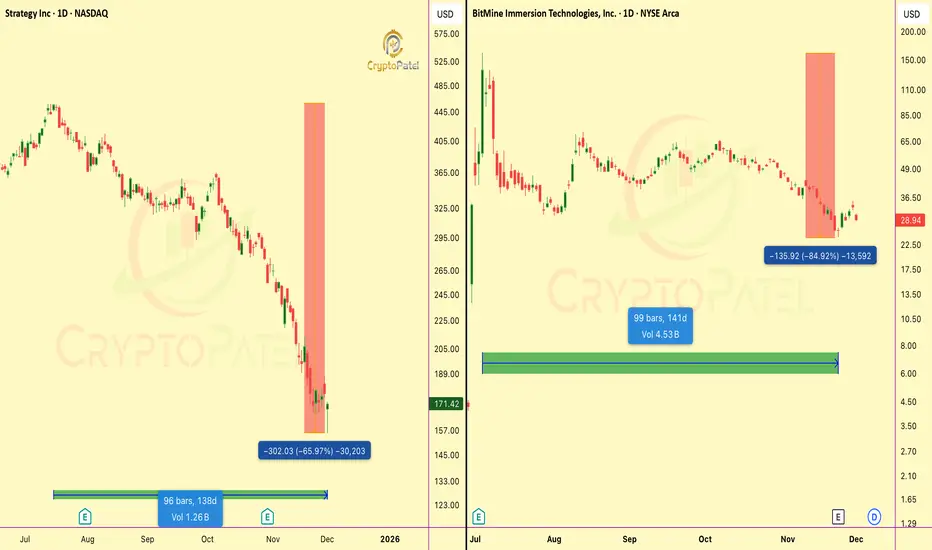
TOP TREASURY COMPANIES BLOODBATHTOP TREASURY COMPANIES BLOODBATH
👉 NASDAQ:MSTR : -64% from ATH ($457→$156) ( BITCOIN TOP HOLDER)
👉 AMEX:BMNR : -82% from peak ($161→$25) (ETHEREUM TOP HOLDER)
Is this capitulation or just the beginning?
NFA & DYOR
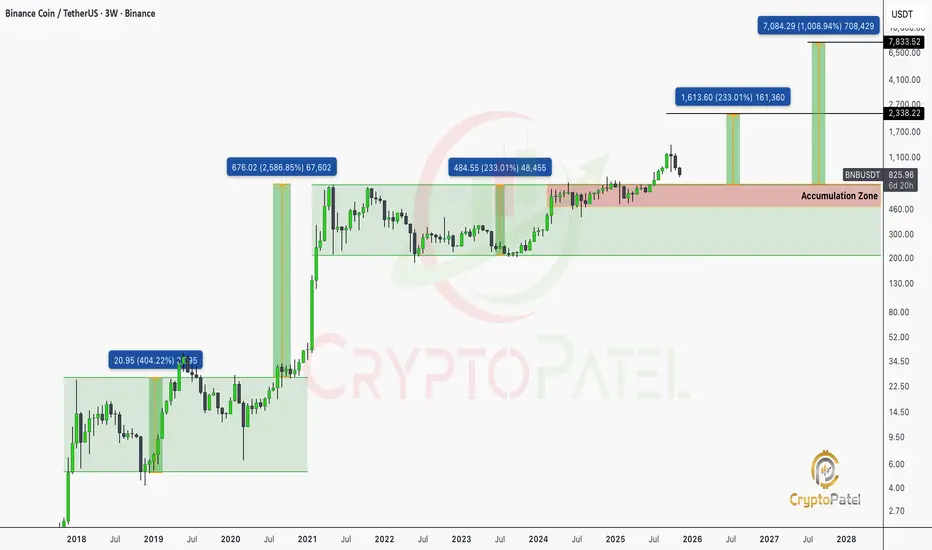
BNB/USDT 3-Week Chart Analysis: Is a Massive Breakout Coming?BNB/USDT 3-Week Chart Analysis: Is a Massive Breakout Coming?
Current Price: $827.05 (down 10.74%)
BNB is currently consolidating in a key Accumulation Zone between $700-$800, signaling institutional accumulation and balance.
Key Levels to Watch
Support Zones:
🔹 $484.55 – Critical demand from 2023 lows
🔹 $676.02 – Former ATH turned support
🔹 $700-$750 – Bottom of current accumulation
Resistance Targets:
🔹 $1,613 – First major upside
🔹 $2,338 – Next intermediate target
🔹 $7,084 – Long-term “moonshot” scenario
Volume & Structure Insights
🔹 2019 Breakout: Started the long-term uptrend
🔹 2021 Bull Run: Peak at $676, classic blow-off top
🔹 2024-2025 Accumulation: Renewed institutional interest
Bearish Risk
🔹 Failure to hold $700 → Retest $484 (-41%)
🔹 Breakdown below $484 → Bullish thesis invalid
NFA & DYOR
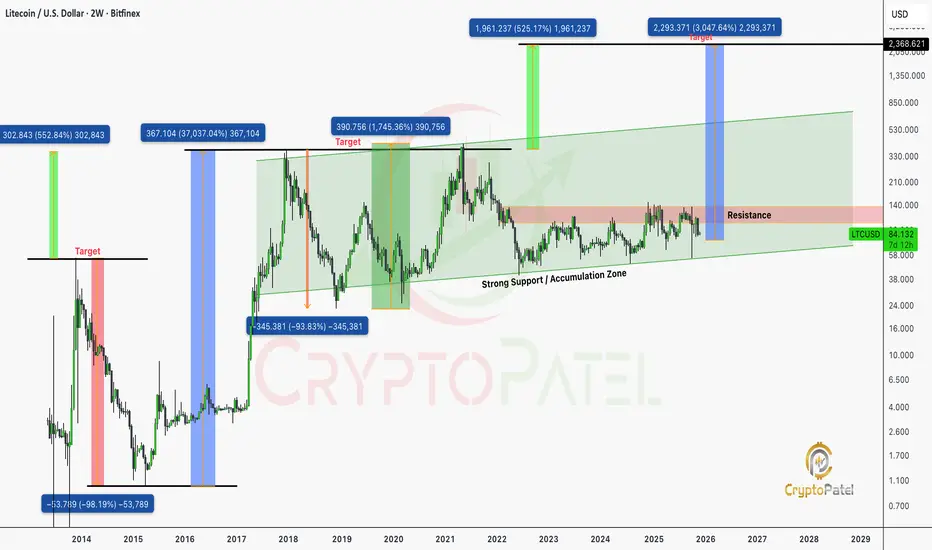
Is $LTC Dead? The Same Question Asked Before Every Major Rally…Is NYSE:LTC Dead? The Same Question Asked Before Every Major Rally…
When markets forget history, they repeat it. Litecoin has gone through multiple full-cycle Retracements, Each time followed by explosive multi-X expansions. Let’s walk through the data:
🔰 2013–2015 Cycle: “LTC is Dead” #1
🔹 LTC hit an ATH of $55 from $1.
🔹 Retraced ~98%, bottoming at $0.985 within 16 months.
🔹 Retail sentiment: “LTC is dead.”
🔹 Smart money quietly accumulated.
Result?
$0.985 → $9 in 4 months (≈ +900%)
Eventually: $0.985 → $370 in 3 years (≈ +37,000%)
🔰 2017–2018 Cycle: “LTC is Dead” #2
🔹 New ATH: $370
🔹 Retracement: 92%, down to $23
🔹 Again: retail capitulation.
Result?
$23 → $146 in 6 months
$23 → $413 by May 2021 (≈ +1700%)
🔰 Current Market Structure (2021–2025)
🔹 Previous ATH: $413 (May 2021)
🔹 Current price: ~$84
🔹 Drawdown: 80%
Retail narrative: “LTC is dead.”
TA narrative: This is historically the accumulation zone.
Technical Outlook (Cycle-Based TA Projection)
Every prior deep-cycle retracement (80–98%) has led to:
🔹 Fresh multi-year impulse waves
🔹 New macro highs
🔹 Massive ROI expansion for accumulator wallets
Based strictly on historical cycle symmetry, volatility bands, and LTC’s halving-driven structure:
LTC Bull-Run Projection:
$600 – $1,000 is a reasonable and technically sound target range for the current macro cycle.
This would represent:
🔹 Breaking the 2021 high
🔹 Completing a full 5-wave macro structure
🔹 Returning to historical expansion ratios seen in every prior cycle
So You Already Know What Happens Next.
Litecoin’s entire history is built on max pain → max gain cycles.
Every 80–98% retracement has delivered its largest multi-X rallies after retail gave up.
Smart investors accumulate when the chart says accumulate, not when the crowd screams “dead.”
FINAL MESSAGE
LTC is not dead. It is in the same deep-value zone where every previous mega-cycle began.
If the market delivers another historical impulse, the $600–$1000 range remains a technically justified target.
Accumulate dips.
Ignore noise.
Let the chart speak.
Not Financial Advice so Always Do your Own Research Before Any Investments.
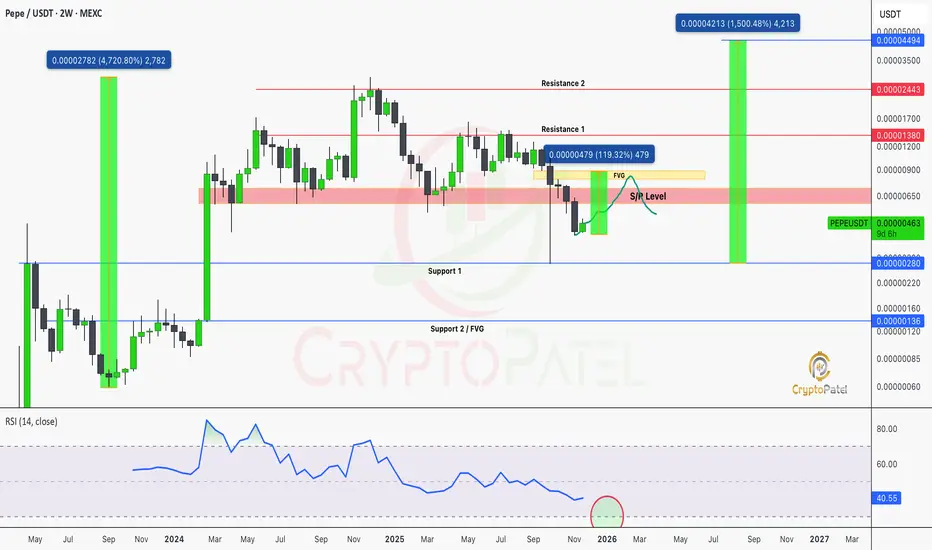
$PEPE Weekly Support Broken Or the Perfect Trap Before a Pump?CRYPTOCAP:PEPE Weekly Support Broken Or the Perfect Trap Before a Pump?
CRYPTOCAP:PEPE lost its weekly support and is now trading below it, which looks more like a full liquidity sweep than a real trend shift. I’m expecting a 50–100% relief rally before the next major move.
If key S/R flips and holds, we could see another memecoin cycle, with 1,000–1,500% upside back on the table.
Support / Accumulation: $0.00000280 / $0.00000136
Resistance / Targets: $0.00000914 → $0.00001380 → $0.00002443 → $0.00004494
Watch my levels closely before entering any trades.
NFA & DYOR
BTCUSD – Demand Zone Reaction & Trendline Reclaim | Bullish Setu📌 Key Highlights
Liquidity grab below previous lows triggered strong bullish momentum.
Clear demand zone reaction with buyers defending the same region multiple times.
Price has reclaimed the ascending trendline, showing a potential shift in short-term structure.
Now sitting in the retest zone, aligned with intraday support.
🎯 Trade Plan
Entry Zone: Retest of the trendline + support cluster
Invalidation: Below the demand zone (~$84,600)
Targets:
TP1: $93,200
Final Target: $94,000 supply zone
📈 Bias
Bullish, expecting continuation toward the next supply zone as long as BTC holds above the trendline and the retest support.
❌ Invalidation
Setup becomes invalid if BTC breaks below $84,600, which would signal weakness and potential continuation to the downside.

Biggest Altseason 10x-20x Loading for 2026?If You're Panicking Right Now, You're About To Miss The Easiest 5x-20x Of Your Life
The Total Market Cap (excluding BTC & ETH) just painted a picture we've seen before...
HISTORICAL CONTEXT:
Last bull run → 1200% pump after breakout & retest
Current situation → Long-term trendline support broken
This looks like a classic liquidity sweep before the next major leg up.
KEY LEVELS TO WATCH:
🔴 Strong Support: $750B - $600B
🟡 Strong Resistance: $1.1T
🟢 2026 Target: $4.25T
THE MATH:
If we hit that Target, we're looking at a 5x on total alt market cap
Individual Altcoins could Easily do:
Quality projects: 5x-10x
High potential gems: 10x-20x
Moonshots: Beyond 20x
MY TAKE:
This current "Crash" is NOT the beginning of a Bear Market. It's a shakeout. Big money is accumulating while retail panics.
The setup is almost identical to previous cycles:
✅ Panic selling at support
✅ Fear at maximum levels
✅ Long-term holders getting shaken out
This is exactly when you want to be positioning for the REAL altseason ahead.
RISK MANAGEMENT:
DCA at support zones ($750B-$600B)
Don't go all-in at once
Keep some powder dry for further dips
Focus on fundamentally strong projects
The biggest gains come to those who stay calm when others panic.
Are you ready for what's coming? 🚀
Not financial advice. DYOR. Manage your risk.

Is BTCUSD (Bitcoin) heading towards $91,000?Hello!
BTC has finally broken through its main downward trendline, signaling a shift in market sentiment after a prolonged period of selling pressure. Following this breakout, the price formed a clear inverse head and shoulders pattern, indicating that buyers have stepped in strongly after the final liquidation at the head level. Since then, BTC has been moving within a clearly defined ascending channel, consistently creating higher highs and higher lows, which confirms the bullish trend.
As long as the price respects the lower boundary of this channel, the bullish structure remains intact. The next significant resistance lies between the 92,500 and 93,000 levels, which also aligns with the previous breakout area you marked. This area is likely to attract sellers, making it a realistic target for the current move.
Overall, the chart continues to support an upward movement towards the 93K level, unless the price breaks below the channel support, which would weaken the bullish reversal setup.

ETHEREUM ANALYSIS UPDATE:ETHEREUM ANALYSIS UPDATE:
Exactly as projected, CRYPTOCAP:ETH bounced perfectly from the 0.5 FIB retracement at $2,622.
That level has now transformed into a strong structural support, increasing the probability of an upside continuation and a potential run toward a new All-Time High.
But remember 👇
If Ethereum breaks below $2,622 (0.5 FIB), the market will likely hunt liquidity into the 0.618 Golden Zone or the Bullish Order Block before launching toward the $10K macro target.
Big dips = Big accumulation discounts. Stay strategic, not emotional.
1️⃣ $2,622 (0.5) – First Defense ✅
2️⃣ $2,256 (0.618) – Golden Zone
3️⃣ $1,821 (0.786) – Nuclear Support
NFA & DYOR

UPDATE: $HYPE/USDT SHORT PLAYED TO PERFECTIONUPDATE: $HYPE/USDT SHORT PLAYED TO PERFECTION
Perfect short entry nailed at $50, after the clean retest, price flushed to $29, now stabilizing near $32.
That’s 38% down from our entry.
📉 5x Short = ~190% Profit
📉 Spot Position = 38% Gain
Both sides winning exactly as planned.
If you’re satisfied with the massive profit, feel free to secure and book here.
I’m still eyeing the $23–$19 zone for the full high-risk/high-reward target but safer traders already have their bag made.
We literally rode it from $50 → $29 in real time. 🔥
NFA & DYOR

Bitcoin Ready to hit New Low?BITCOIN QUICK UPDATE: LEVELS PLAYING OUT EXACTLY AS EXPECTED
As we mentioned earlier, the $88,600 FVG has now been fully filled, and CRYPTOCAP:BTC is currently trading below that zone.
Here’s what matters next:
🔹 If $85,000 holds as support → BTC likely pushes toward the next major Bearish Order Block at ~$93,000.
High probability this zone gets tapped.
🔹 If BTC fails to reclaim and break above $88,000 → expect a deeper leg down toward ~$75,000.
Stay sharp. NFA.

BTCUSD: Overbought Rally Approaches Strong Support ZoneBINANCE:BTCUSD is nearing a crucial support zone, one where buyers have consistently stepped in before and sparked significant reversals. This price history alone makes this level incredibly important to watch closely. Price is approaching this zone once more, and the current market structure suggests potential for a bullish move if we see signs of rejection, such as a strong bullish engulfing candle, long lower wicks indicating absorption of selling pressure, or an uptick in buying volume.
If this support holds, I anticipate price will push towards the 98,700 area, fitting well with a short-term rebound scenario. However, if price breaks through this support and remains below it, the bullish thesis will be invalidated, opening up the possibility for a deeper pullback.
The best approach here is to wait for confirmation from the chart. Pay attention to how candles close, how volume behaves, and only consider long positions if the market defends this support level clearly. Solid risk management is key: position sizing, stop loss placement, and invalidation levels should always be aligned with the volatility that could arise around such a critical area.
This is just my personal view on the current support and resistance structure, not financial advice. Always do your own research and trade with a well-structured risk management plan. Best of luck out there!

BTCUSD Liquidity Sweep Setup Before Bearish ContinuationBTCUSD Liquidity Sweep Setup Before Bearish Continuation
Overview
BTCUSD continues to display persistent downside pressure across the mid-term structure. Price action on the 3H timeframe shows a sequence of lower highs and lower lows, reflecting sustained bearish control. Despite short periods of stabilization, the overall market environment remains distribution-driven.
Market Structure
Recent price behavior confirms multiple break-of-structure (BOS) events, each reinforcing the broader downward momentum. Every attempt at upward expansion has been met with supply absorption, indicating that buyers are failing to regain initiative. The consolidation developing in the current region suggests an accumulation of short-term liquidity, but without structural evidence of reversal.
Supply & Liquidity Context
Price is positioned directly beneath a key supply zone highlighted on the chart. This zone remains unmitigated and acts as the primary area where counter-trend reactions are likely to be absorbed. The tightening range beneath this level indicates liquidity buildup, commonly preceding engineered sweeps by institutional players.
The current model suggests that the market may execute a short-term liquidity run above local highs before resuming its downward trajectory. Such a move would align with previous behavior in this trend cycle, where short-term rallies were primarily used to deliver liquidity into higher-timeframe supply.
Downside Expansion Risk
Should the market complete a liquidity sweep into the supply zone, the next phase of downside continuation becomes probable. The structural projection on the chart anticipates a revisiting of the lower demand region around 74,300 – 75,000, an area aligning with previous inefficiencies and untested demand.
This target supports the continuation of the broader bearish structure unless a significant shift in order flow emerges.
Summary
BTCUSD remains positioned within a well-defined bearish cycle, characterized by repeated structure breaks and unmitigated supply zones controlling price. Current compression suggests the market is preparing for another liquidity-driven move. Unless buyers regain structure above the key supply region, the market retains a high probability of extending toward lower demand zones.

BITCOIN JUST DID EXACTLY WHAT WE DISCUSSED: CURRENT UPDATEBITCOIN JUST DID EXACTLY WHAT WE DISCUSSED: CURRENT UPDATE
CRYPTOCAP:BTC bounced perfectly from the 0.786 Fib ($83,308), The FINAL bullish support.
Now trading above $86,500, already +5–6% up from the exact level I alerted.
As long as BTC holds $83,308, upside relief rally remains active:
$88,000 (FVG)
$93,000 (Bearish OB)
$98,000 (FVG inefficiency)
But… if BTC loses $83,000, say hello to the $66,000 demand zone, The next real bullish orderflow.
For now: Structure is bullish above 0.786, cautious below it.
(NFA / DYOR)
