BTC/USD Pullback: What’s Next for Bitcoin?Hello, passionate and wealthy traders! What are your thoughts on BTC/USD?
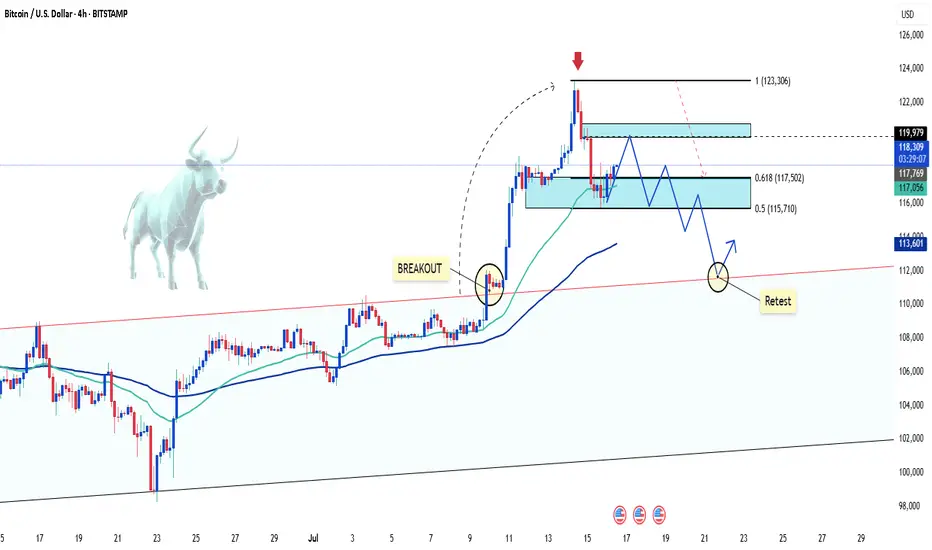
After a strong surge above the 122,500 USD zone, BTC/USD has started to experience a slight pullback. This is completely normal and necessary for Bitcoin to gain new momentum.
In my personal view, the recent peak of BTC/USD signals that this correction is in play. But where do you think BTC/USD will adjust to? Personally, I believe the 111,500 USD zone is quite reasonable. It’s also the previous breakout level, and this pullback aims to test the uptrend safely.
What about you? Where do you see BTC/USD heading? Looking forward to hearing your thoughts!
Bitcoin (Cryptocurrency)
Institution Option Trading🔍 What Are Options?
Options are financial contracts that give you the right, but not the obligation, to buy or sell an asset at a specific price within a set time. There are two types:
Call Options – Right to buy
Put Options – Right to sell
Institutions use these tools not for speculation but for hedging, portfolio insurance, income strategies, and market positioning.
🧠 How Institutions Trade Options Differently
1. Multi-Leg Strategies
Institutions use advanced strategies like:
Covered Calls
Iron Condors
Vertical Spreads
Calendar Spreads
These strategies allow them to generate income and control risk, unlike directional bets most retail traders make.
2. Risk Management Focus
Institutions never “go all in.” They manage risk using:
Delta-neutral positioning
Hedging with opposite positions
Dynamic rebalancing
Volatility-based exposure control
They measure every trade based on risk-reward, not hope or prediction.
3. Understanding Option Greeks
Institutions actively monitor:
Delta (directional exposure)
Gamma (sensitivity to price change)
Theta (time decay)
Vega (volatility impact)
They use this to manage trades like professionals and adjust positions based on market conditions.
4. Implied Volatility & Volume Triggers
They don’t chase options with hype — they analyze:
Open interest spikes
Volatility crush or expansion
Skew analysis
These help detect big moves before they happen.
5. Smart Money Flow Tracking
Institutional traders leave footprints. You can learn to track:
Block trades
Unusual options activity
Dark pool activity
This reveals where big money is being placed — giving you a serious trading edge.
🎯 What You’ll Learn in Institutional Option Trading
Institutional mindset and objective-driven trading
How to trade options with structure and clarity
How to use Greeks for trade management
Institutional strategies vs. retail mistakes
Real-world case studies from option chain data
👨🏫 Who Is This For?
Traders who want to learn professional-grade options trading
Retail traders looking to stop losses and build consistency
Intermediate traders who want to move beyond basic buying
Investors looking to hedge or enhance returns with options
✅ Final Thoughts
Institutional Option Trading is not about quick profits — it's about risk-managed, high-probability trading with purpose. By learning how institutions trade options, you can elevate your trading game, improve consistency, and avoid emotional mistakes.

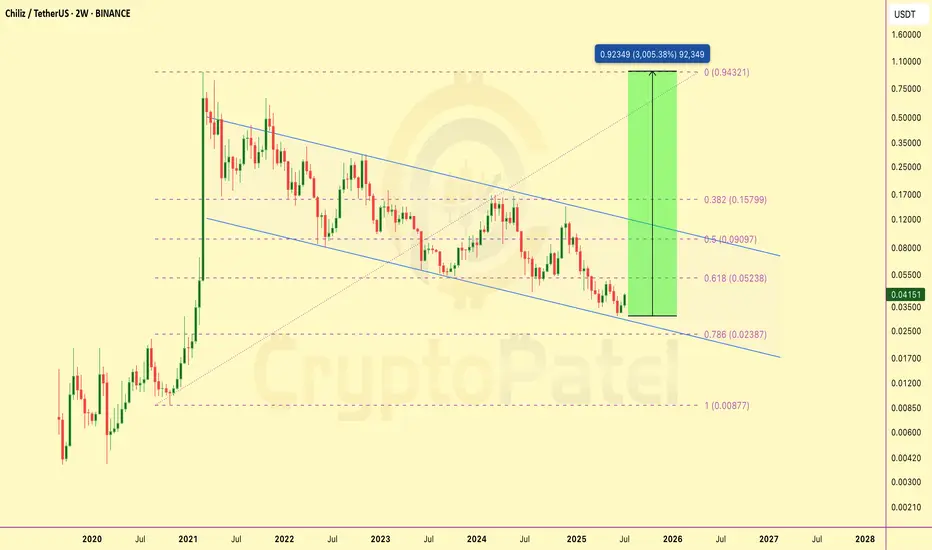
$CHZ did a 30x in 2021. Nobody cared until it was too lateBack in 2021, Chiliz ( GETTEX:CHZ ) delivered a 30x move — climbing from a $130M to $4B market cap in just a month. That move was fueled by strong fundamentals and massive hype around fan tokens.
Fast forward to now — price is sitting at the bottom of a multi-year falling wedge on the 2W timeframe. It just tapped the 0.786 Fibonacci retracement and showed a strong bounce with rising volume — a classic sign of potential reversal.
With solid partnerships, real-world utility, and a historical setup this clean, I’ve started building my position here. If the wedge breaks out, upside targets line up around $0.05 → $0.09 → $0.15 → $0.90 — back toward ATH levels.
Bottom might be in. Watch this closely.
Note: NFa & DYOR
BTC/USD Soars: A Surge That Took the Market by SurpriseBitcoin BITSTAMP:BTCUSD has shocked the market with a massive surge, reaching new highs in recent days. This unexpected jump has taken many traders and analysts by surprise, as BTC breaks through previous resistance levels.
The driving forces behind this surge appear to be increased institutional interest, positive market sentiment, and strong demand from retail investors. As Bitcoin enters new territory, it's essential for traders to stay vigilant and manage their risk, as volatility remains high.
Will Bitcoin continue its rally or face a correction? Keep an eye on the charts for the next move!

$PENGU is up 180% from our entry. Insane move.CSECY:PENGU is up 180% from our entry. Insane move.
Entry was around $0.010 — today it touched $0.0308. Almost 3x.
I booked 50% profits here. Still bullish, but I always play safe.
Profit booking is part of the game — don’t wait till it’s too late.
If you’re holding big — at least secure your free capital.
Then ride the rest with peace of mind.
What’s your move? Booked profits or still holding? 👇
Drop a comment + Retweet if you caught this run.
NFA & DYOR

THETA Price Prediction: Can It 20x From This Weekly Support ZoneMYX:THETA is now trading at a strong support area — the same zone where it started big moves in the past.
In previous cycles, from this level:
🔹 THETA went up over 2,700% (to $15.38)
🔹 Later, it again moved up around 570% (to $3.23)
🔹 Now, it's showing signs of a similar bounce from the same level.
Possible Future Price Levels:
Targets: $0.95 / $3.18 / $7.51 / $14.02
These are levels to watch if the upward trend continues.
⚠️ Risk Point:
If THETA falls and stays below $0.65, the setup will no longer be valid and it may go lower.
THETA – Fundamental Overview
🔹 THETA is a blockchain built for decentralized video streaming.
🔹 It lets users share internet bandwidth to help deliver videos and earn TFUEL in return.
Key Use Cases:
🔹 Powering video apps like Theta.tv
🔹 Creator-focused NFTs and content access
🔹 Web3 streaming, gaming, and AI tools
Backed by Big Names:
Google Cloud, Samsung, Sony, CAA, and more.
Real adoption, not just hype.
Token Model:
🔹 THETA: Staking + governance
🔹 TFUEL: Gas + rewards
Fixed supply = No inflation risk
Why It Matters:
As Web3 and AI grow, THETA could become the backbone of content delivery.
Key Takeaway:
🔹 This zone has worked well as a bounce point before.
🔹 THETA is reacting from it again now.
🔹 The potential reward is high, and the risk is limited if managed properly.
Keep an eye on it. This might be a good setup for long-term traders.
Let us know your thoughts & Would you invest in projects like THETA? 👇
Note: NFA & DYOR

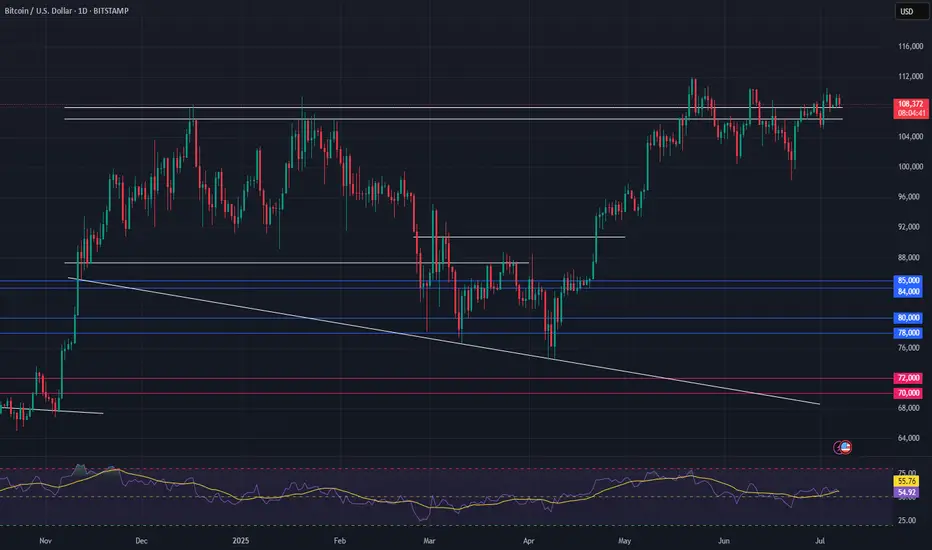
Renderwithme | Bitcoin at resistance Bitcoin Price Analysis for Next Week (July 14–20, 2025)Predicting Bitcoin's price for the
upcoming week involves analyzing current market trends, technical indicators, and macroeconomic factors. Based on recent data, here’s a concise analysis for Bitcoin (BTC) for the week of July 14–20, 2025. Note that cryptocurrency markets are highly volatile, and predictions are speculative. Always conduct your own research before making investment decisions.Current Market OverviewCurrent Price: As of July 7, 2025, Bitcoin is trading around $108,000–$109,420.41, with slight variations across sources.
Recent Performance: Bitcoin has shown a modest upward trend, with a 0.56% increase over the past week and a 4.38% gain over the last month. It reached an all-time high of $112,000 on May 22, 2025, but recently pulled back from $110,000 due to whale transfers and macroeconomic uncertainty.
Market Sentiment: Sentiment is cautiously optimistic, with the Fear & Greed Index in the Neutral zone, indicating investors are accumulating during dips. Technical indicators suggest a bullish outlook, though short-term volatility is expected.
Technical AnalysisPrice Levels and Trends:Bitcoin is trading above key support levels at $106,700 and $103,709 (20-day and 50-day EMAs), with resistance at $109,800–$112,000. A weekly close above $109,000 could confirm a breakout, potentially targeting $113,500 or higher.
A descending triangle pattern is noted, with a potential breakout by early August. If bullish momentum persists, $110,000 is a key resistance to watch. Failure to hold above $99,000 could lead to a retest of $94,000–$96,000.
Disclaimer --
This analysis is based on recent technical data and market sentiment from web sources. It is for informational purposes only and not financial advice. Trading involves high risks, and past performance does not guarantee future results. Always conduct your own research or consult a SEBI-registered advisor before trading.
#Boost and comment will be highly appreciated

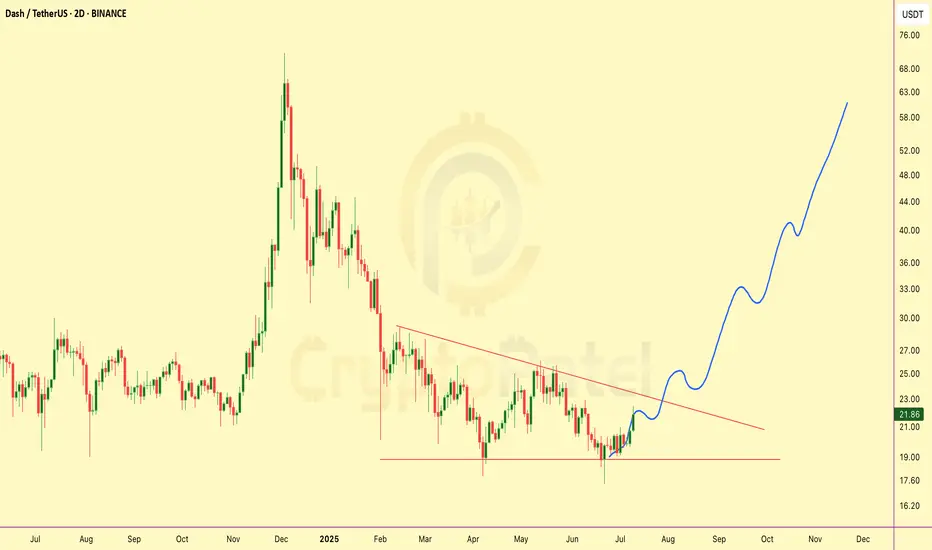
$DASH breakout loading… 100%+ upside in sight!NASDAQ:DASH breakout loading… 100%+ upside in sight!
Price swept liquidity and bounced strong. Now aiming for a major trendline breakout. If it clears, $50 → $60+ is on the cards.
Drop your target
Retweet if you see the setup
Note: NFA & DYOR
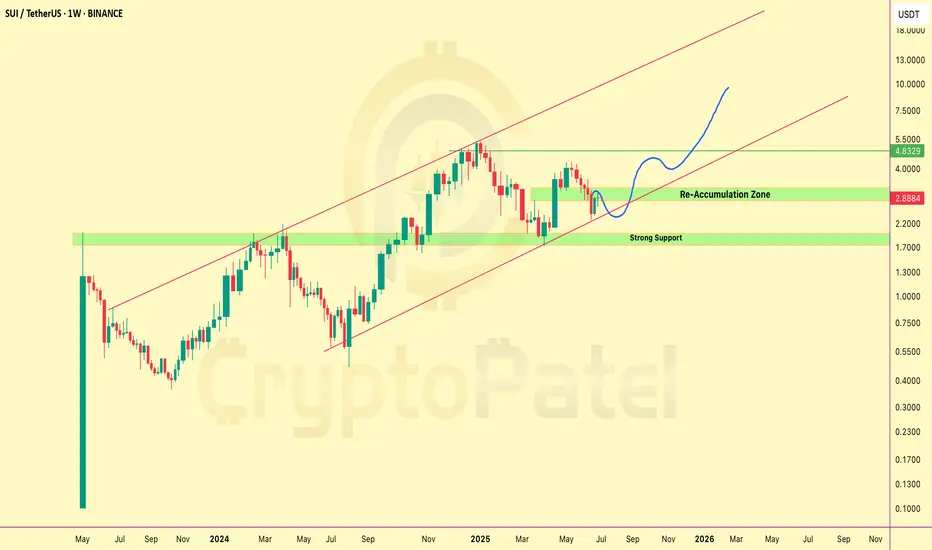
SUI to $10, $20.. Even $50? The Setup Looks Insane-Weekly ChartSUI is trading around $2.89, currently sitting in a key re-accumulation zone after a correction.
Trend: Still holding inside a long-term uptrend channel — structure remains bullish.
Support Zones:
🔹 $2.00–$2.50 is a strong demand area
🔹 $1.70 is a critical support — bullish above this,
but if price breaks below, we may enter major bearish mode
What to watch: If SUI holds this zone and continues upward:
🔹 Short-term target: $5/$10
🔹 Long-term potential: $20 → $50
I’m watching the $2.50 zone closely for possible long entries.
This could be a solid long-term opportunity if support holds.
NFA. DYOR.
$BTC Potential Longing OpportunityWe’ve successfully opened our previous long position at $105,398.80.
What’s next?
I’m currently eyeing the $106,335.70 – $106,716.90 range as a potential zone for the next long entry. Price may retest this area before continuing its move to the upside.
This is not financial advice. Always trade at your own risk.

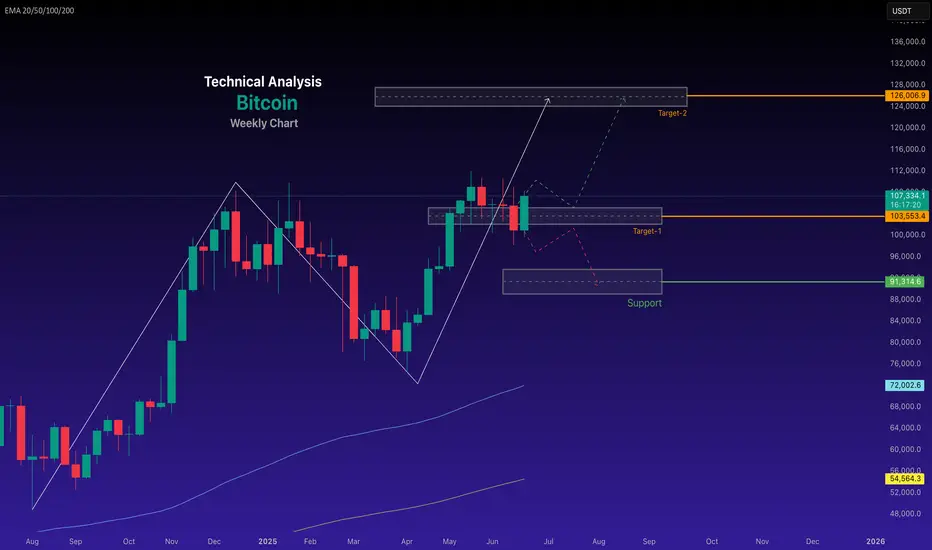
Bitcoin Eyes Breakout — Bullish Setup Gathers StrengthConsolidation Above Key Support:
Bitcoin continues to hold firmly above the $100,000–$105,000 support zone, a critical area that acted as major resistance earlier in 2025. This sustained price action reinforces the prevailing bullish momentum and signals strength beneath the surface.
Wedge Formation Nearing Resolution:
The prolonged wedge pattern now taking shape suggests a substantial move is imminent. The structure supports a breakout scenario, with an initial target of $130,000–$135,000 in play.
Uptrend Intact, No Signs of Exhaustion:
Despite recent weeks of sideways action, Bitcoin continues to consolidate near its highs—a pattern that historically favors continuation, not reversal. The broader trend remains upward and firmly intact.
Focus & Opportunity:
Bitcoin's technical setup justifies close attention in the days ahead. At the same time, traders and investors should keep an eye on select altcoins, which could offer amplified upside as capital rotation picks up momentum.
#Bitcoin #BTC #Crypto #TechnicalAnalysis #BullishSetup #WedgeBreakout #PriceAction #Altcoins #CryptoMarket #MarketUpdate #AllTimeHigh
BTC/USD Stuck in Range | Watch VWAP & Key Support at 107.5K The recent rejection from near $110K and persistent selling pressure below VWAP across all intraday timeframes (45m/15m/5m/1m) shows bearish momentum building.
$BITSTAMP: BTCUSD
🔍 Key Observations:
VWAP: Price is trading below session VWAP on all short timeframes, showing intraday bearish sentiment.
Structure: Lower highs on the 4H chart signal weakening strength.
Support Zone: Immediate intraday support is seen near $107,500; a breakdown could lead to $106,000 or lower.
Resistance: Sellers are active at $109,000–$110,000.
Optionally add RSI (14) on 1H or 4H to watch for divergences near support/resistance levels.

BITCOIN: Wait For The Drop! Fellow Traders,
Hope you are doing great, in our view bitcoin is likely to drop around 90k region. So Expect price to breakthrough the sellers pressure and then drop around 95k first and then 90k which will be a key level for swing buyers.
Thank you

BTCUSD Short Opportunity – Bearish Channel Resistance TestPair: BTCUSD
Timeframe: 4H
I’m planning a short position on Bitcoin based on this well-defined descending channel structure.
🔹 Setup Explanation:
Price has been respecting a downward-sloping channel, with multiple touches at both the upper and lower bounds.
Currently, BTC is testing the upper trendline resistance of this channel near the $108,000–$109,000 area.
This area also aligns with prior supply zones where strong selling pressure emerged.
The recent impulsive move up appears overextended, increasing the likelihood of a technical pullback.
🔹 Potential Reversal Area:
Upper channel boundary: ~108,500–109,000 USD
Confluence with previous horizontal resistance
Weak momentum candles forming near this resistance
🔹 Trade Plan:
Entry Zone: Between 108,000–109,000 (as price consolidates near the channel top)
Stop-Loss: Above 110,000 to protect against breakout and invalidation of the pattern
Target Zone:
First Target (TP1): 104,500 (gray support zone mid-channel)
Second Target (TP2): 97,000 (lower channel boundary)
🎯 Risk-to-Reward:
Targeting a 1:2 to 1:3 R:R, depending on execution
This means risking ~1,500–2,000 points for a potential reward of 4,000–10,000 points
🛡️ Important Notes:
Watch for strong bullish momentum or a clean breakout above 110,000—this invalidates the setup.
Confirm rejection with lower timeframe bearish signals (e.g., bearish engulfing or supply zone rejection).
Be prepared to trail stop after TP1 is hit to secure profits.
✅ Summary:
This setup aims to capitalize on the potential rejection from the upper boundary of a long-standing descending channel, expecting BTCUSD to retest the mid and lower range support zones.

$BTC 45-min Chart Analysis
Bitcoin 💰 has just completed a clean 5-wave impulse move, peaking near $109K, and is now entering a short-term ABC correction phase.
Wave Count Overview🔎
(1)-(5) impulse wave completed
Wave (a) correction underway – already bounced off local support
Currently tracking Wave (b) relief rally
🔁 Wave B Retracement Key Level
0.618 Fib = $108,004
This level is a critical rejection zone. If CRYPTOCAP:BTC faces resistance here, expect continuation toward Wave C next.
🔻 Short-Term Scenarios
Bearish Case (ABC plays out)
🅰️ Wave (b) bounce may fade near $108K
🅱️ Wave (c) could drag price down toward $105.5K–$106K zone for completion
Bullish Case (Shallow Correction)
Holding above $107K and breaking $108K cleanly could invalidate Wave C
Price may resume impulsive structure if no deeper correction follows
⚠️ Key Observations
This is a standard post-rally correction, not a reversal
No panic unless $105K breaks
Next 12–24 hours crucial: will CRYPTOCAP:BTC reclaim $108K or head into deeper Wave C?
The trend is still bullish — this short-term ABC is a healthy cooldown. If bulls defend above $106K and reclaim $108K, momentum could quickly flip back in favor of a new rally.

Shorting BTCUSD After Trendline Failure & Bearish RetestPlanning to short BTCUSD as price has rejected from the descending trendline resistance after breaking the minor ascending trendline support. The confluence of trendline rejection and bearish retest suggests potential downside continuation.
Entry Zone: ~107,300–107,350
Stop-Loss: Above 107,550 (recent high)
Target: 106,550 support area
Risk-to-Reward Ratio: ~1:2 (Min) 1:4 (Final Target)
Quote:
"Trendline confluence and failed bullish continuation often lead to deeper pullbacks."
📊 Summary of the Idea
✅Reason for Entry: Multiple rejections at trendline + structure breakdown.
✅Confirmation: Retest rejection candle.
✅Invalidation: A clean breakout and hold above the descending trendline.

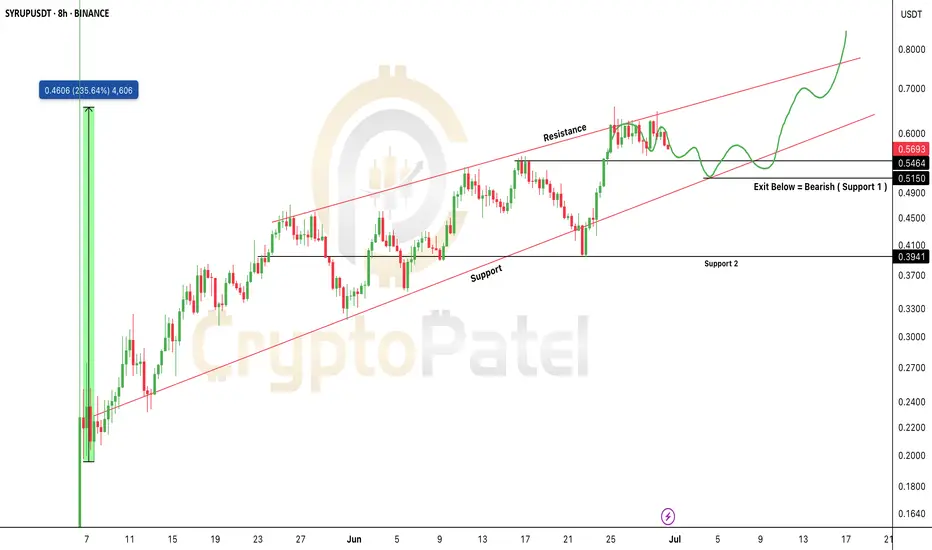
$SYRUP Price Prediction Analysis as per Ascending ChannelSYRUP/USDT – Technical Chart Update (8H Timeframe)
SYRUP is trading inside a clean ascending channel, showing a bullish structure with higher highs and higher lows.
Key Levels to Watch:
Support: $0.51
Resistance Targets: $0.70 → $0.80+
Exit Level: Bearish if price breaks below $0.51
Current Setup:
Price is respecting the lower trendline of the channel. A bounce here could lead to another leg up toward resistance.
Strategy:
Bullish bias as long as SYRUP holds above $0.51
Ideal zone to look for buy opportunities on dips
Exit or hedge if price closes below $0.51
Important Note:
If CRYPTOCAP:SYRUP holds the $0.51 support, it could soon enter the $1 club 🚀
But if it drops below $0.50, we may see a 30–50% retracement.
So always watch the chart closely before entering any trades.
Note: NFA & DYOR
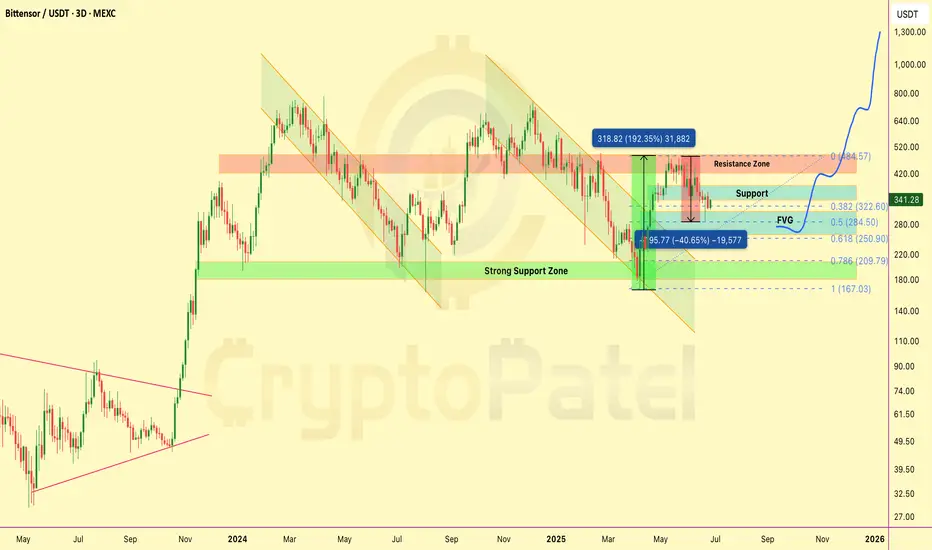
$TAO dumped 40% — exactly as predicted.LSE:TAO dumped 40% — exactly as predicted.
If you didn’t buy the top, you saved cash.
If you shorted near $500, you printed 200%+ profit on 5x.
Now what?
Price bounced cleanly from our FVG zone
Accumulation zone: $250–$200 — it’s coming...
I’m still aiming for $3,000–$5,000 this cycle.
Don’t rush. Accumulate smart.
Patience = profits.
What’s your LSE:TAO game plan now? 👇
Bitcoin Technical Analysis for the Week of 29, June - 07, July
Here's a Bitcoin price analysis for June 29, 2025, based on available data and technical indicators from recent sources:
#Current Market Overview
Price: Bitcoin is trading around $107,331.08 as of June 28, 2025, with a slight 24-hour decrease of approximately 1.99%.
#Market Sentiment: The market shows a neutral to bullish sentiment. The Fear & Greed Index is at 65 (Greed), indicating optimism but not extreme euphoria. Technical indicators suggest a 67% bullish sentiment, with 25 bullish signals versus 5 bearish signals.
Trading Volume: 24-hour trading volume is around $43.1 billion, slightly below recent averages, suggesting cautious trading amid volatility.
~~ Technical Analysis ~~
Price Trends:
Bitcoin is currently testing support at the 20-day EMA ($106,211), with additional support at the 50-day EMA ($103,110) and 100-day EMA ($98,807). The 200-day EMA ($93,092) serves as a key macro support level.
The 50-day moving average is rising and remains above the 200-day moving average, forming a golden cross, a bullish indicator.
Bitcoin is within a descending triangle pattern, which could resolve by July 1, 2025. A breakout above $110,000 could signal a new bull run, while failure to hold $102,000–$104,000 may lead to a drop toward $95,000–$98,000. even to $90,000.
Key Levels:
Support: $100,000 (recently held), $98,000 (psychological), $95,000 (flag pattern lower border).
Resistance: $108,700 (recent high), $110,000 (key psychological level), $112,000 (all-time high from May 2025)
Trend Bullish - Chart for your reference
-- Disclaimer --
This analysis is based on recent technical data and market sentiment from web sources. It is for informational purposes only and not financial advice. Trading involves high risks, and past performance does not guarantee future results. Always conduct your own research or consult a SEBI-registered advisor before trading.
#Boost and comment will be highly appreciated
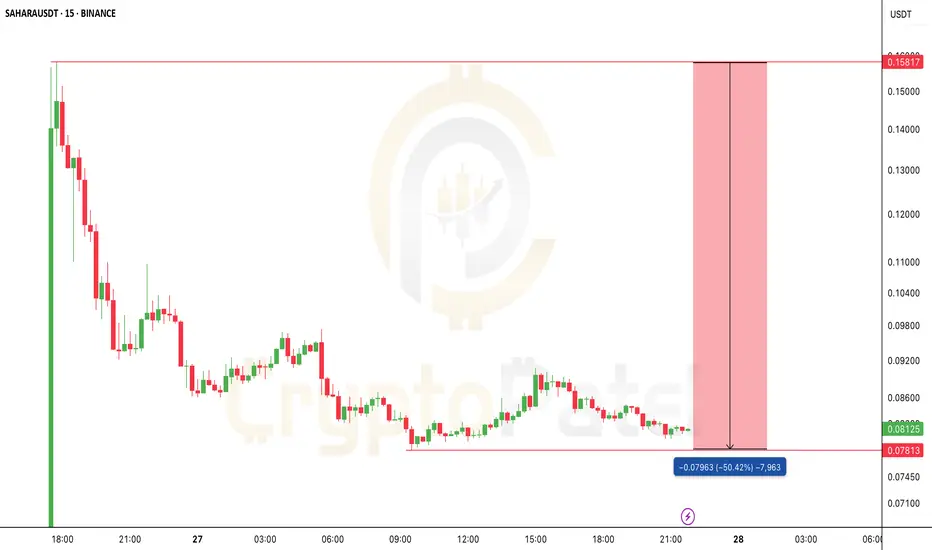
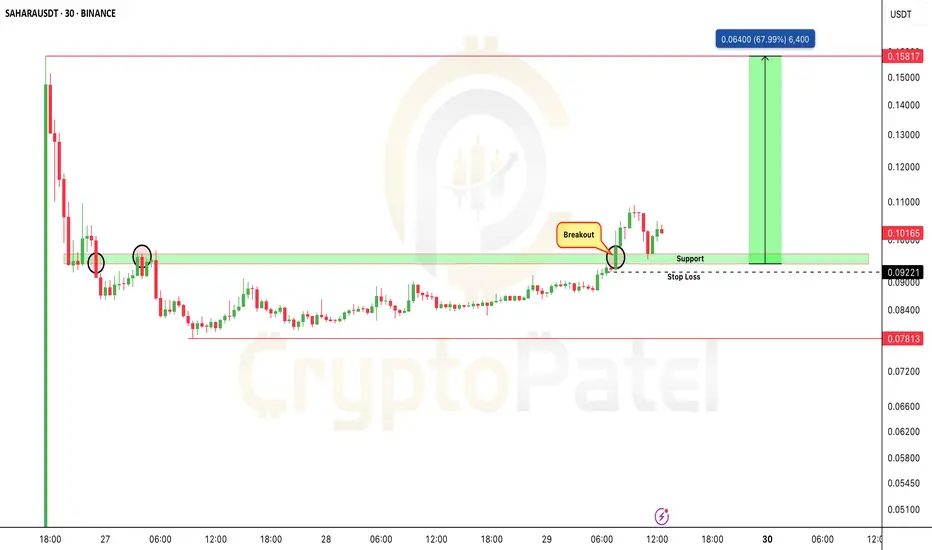
$SAHARA is at a critical level BSE:SAHARA is at a critical level
If the $0.09 support holds, a 60% upside is on the table.
But if it fails to hold $0.095… We could be looking at new lows.
This support zone decides the next big move.
Keep it on your radar
Retweet if you're watching
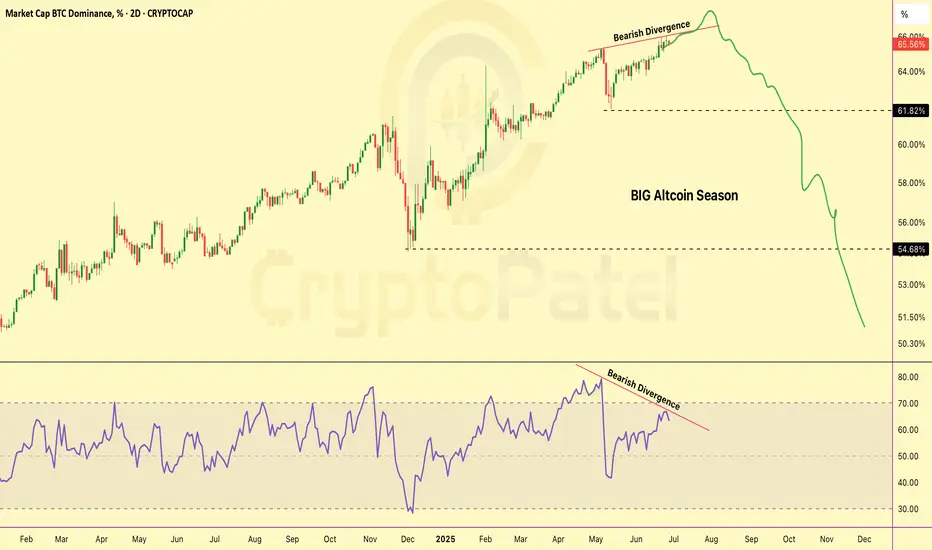
Big Altseason Is Loading... Ready for Big Altseason... but Why?BTC Dominance Showing Bearish Divergence!
Get ready... a massive Altcoin Season could be coming soon!
📉 Chart and RSI both showing weakness
📉 If dominance drops from here, money will likely flow into altcoins
📉 Next target: 50% dominance — same level where ALTs pumped 5x–10x last time!
This could be the biggest altseason of the cycle.
Don’t miss the opportunity!
Comment your top 3 altcoin picks 👇
Stay tuned for updates — we’ll post the best setups!
NFA & DYOR
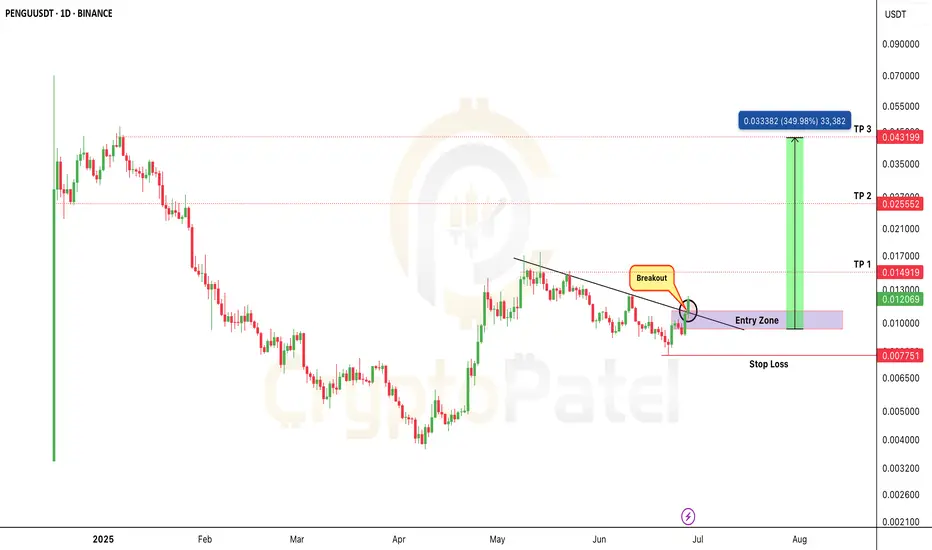
PENGU Breakout Live — Could This Be the Next 5x Runner?PENGU Breakout Live — Could This Be the Next 5x Runner?
PENGU/USDT just broke a major trendline after weeks of consolidation…
If this breakout holds — we’re staring at a potential 3x–5x move in the coming days.
But here’s the twist…
❌ Don't FOMO!
The smart entry is likely $0.010–$0.0090 — a clean retest zone where risk–reward is best.
Chart invalid if price breaks below: $0.0077
Targets if breakout holds: $0.0150 / $0.025 / $0.043 / $0.10
This is a breakout + retest setup with explosive potential — but only if you play it right.
Always use risk management.
This is NOT financial advice — DYOR before you enter any trade.
New traders, read this before chasing the next listing pumpNew traders, read this before chasing the next listing pump:
BSE:SAHARA dropped 50% right after launch — but early investors still sit on 10x+ gains from seed.
Why? They got in at
Seed: $0.005
IDO: $0.06
Binance top buyers? Wrecked.
✅ Always study tokenomics
✅ Know seed + public round prices
✅ Let the hype settle before entries
Smart money waits. FOMO gets dumped on.
What’s your rule before buying a new listing?