BITCOIN CHART ANALYSISBitcoin gave a Biggest Range Breakout but sudden fallback also..,,so is this False Breakout or small retrecemnt and after this, Can we see a Big UP Rally????
KEEP AN EYE ON IT…..!!!!
Bitcoinanalysis

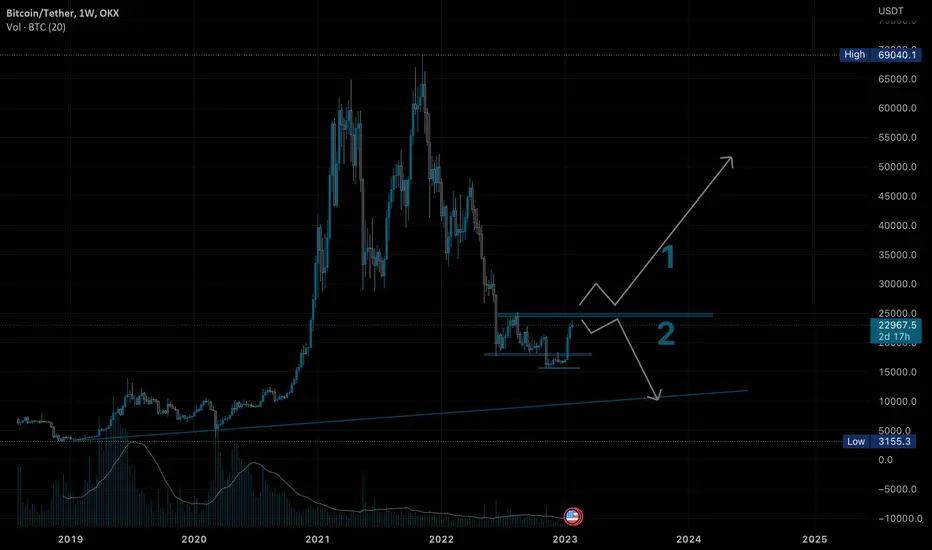
Bitcoin next move update1 or 2 ?
Lets not guess.
Lets react to the market
If guessing is the game i’l go with 1
#fingerscrossed
BITCOIN CHART ANALYSISBitcoin at its Crusial Level
First its going through its parallel channel along with that created Reactangle chart pattern and after Breaking Up Parallel Resistance Or Rectancle Lower Resistance at Same time its Straight forward its Previous Major Resistance of Rectangle Chart Pattern …..
There is more tha 3-4Days Bitcoin Is Cosolidating at Same Levels Breaking Eaither Side will See such Bigg Rally of Bitcoin

morning star in btcmorning star spotted in bitcoin in monthly time frame chart on a major support its a good bullish reversal sign .. so we have a good chances of bull run here

BITCOIN CHART ANALYSISBitcoin Formes a Perfect Ascending Tringle if it Break Upside We Will See Suchh Big Move Soon


btcusdtbtc follwing trendline and lower low in 1day time frame
probably can fall from here.
can be reacted according to the situation

Bitcoin technical analysis bitcoin retesting at a zone 30500usd if it sustain below 31000 for next 5-7days, it may test 20000usd we can see more fall in crypto currency.
if anybody wants to invest please wait and watch (if u want buy, buy @ 20000usd TO 21000usd or buy ABOVE @ 35000usd) #INVESTWISELY
****EDUCATION PURPOSEONLY****


Bitcoin Long position for short term!!Bitcoin about to give a breakout from descending triangle pattern at 17000 levels
Look for long opportunities in short term

Bitcoin Short-forming bear divergencesBitcoin is making bear divergences in uptrend in 15m time frame.Price is making a clear divergence of upcoming bear move as shown in the RSI .If the trendline breaks out,a short intraday trade can be initiated on 15m.Keep an eye.

BTC 1W Timeframe Chart AnalysisBTC 1W Timeframe Chart Analysis
If you want the best buying opportunity, wait a few weeks.
Buy Signal - 12100$ - 12500$

Is Bitcoin Ready for a bull run ! Bitcoin has seen a change in Polarity of a trendline. The volumes are supporting as well.
Lets see if the Run is bull or a Fake out.
Let me know your thoughts in the comments section.

BTC is looking really bullishBTC is looking really bullish as you can see pullback is over and it again on its support zone and cvd is also rising. I think first will come to mitigate the OB then hard pump 20k +

#Bitcoin trend reversal•We have a bullish cypher in play here. Within the harmonic category of patterns, the cypher is a reversal configuration.
•The cypher formation frequently occurs during a market trending period (HTF) and presents as a terminal move.
•Next is a trend reversal.

BTC INTRADAY SETUP - 08 OCT, 2022#BTC INTRADAY UPDATE
VOLATILITY EXPECTED: Medium
EXPECTED SCENARIO:
$BTC is again bearish on Intraday. Expecting it to consolidate today.
BULL CASE:
In case we cross INTRADAY FLIP LINE(19600$), only R1(19750$) else R2(20000$), will be tested.
BEAR CASE:
In case we stay below INTRDAY FLIP LINE, S1(19300$) else S2(19050$) is the support and hold today.
NOTE:
On higher Timeframe, BTC is failing to even go to 21500$ zone. Let's see if 19000$ holds.
On downside, 18K support should not break else a dump to 14K$ may happen..

Bitcoin consolidating in a box pattern.Bitcoin on the weekly time frame has given a bearish moving averages cross over and has been consolidating in the previous weeks range. The market is consolidating in a Box pattern.
The market are in a bearish trend as Dow has broken its 29000 level after taking resistance from its weekly 20 ema and closed below its 200 ema.
Global markets are negative and the crypto markets follow the similar trajectory of the US market.
Coin, on the daily time frame, is taking a serious rejection and is constantly falling after getting rejected form the 20 DMA.
It has been consolidating in a narrow range of 1.5-2% for three days. It has given fake outs on both side but couldn't sustain above/below the levels.
On the hourly time frame, it is trading between 20 and 200 ema.
Support :- 19290, 18870, 18600
Resistance :- 19630, 20000, 20330.
The price range from 19290 to 19630 is a no trading zone.
A swing or intraday trade can be initiated if the price sustain above the levels on the 60 minutes chart.
Wait for the price action near the price levels before entering the markets.

BTC IS BULLISH NOW!!BTC is ranged and just completed its short downtrend in the range of 24248.29 and 18475.74. And now we can see a short uptrend towards 24248. And rsi is also showing bullish divergence. Our main resistance and support levels are 20783.57 and 23195.31.

BTC is still in bearish structure BTC is still in bearish structure on 1H, on daily it is in the range between 20117 to 18125 and showing bullish signals in weekly, so we can expect a lil down movement to below till 18125

BTC LONG TRADE H4market is in the range and btc created a eq low and on that orderblock there is our demand zone on which btc just landed and made a low on their after taking the above liquidity, so there is high chances that now it can go up!

History Repeat ??Price trading near Multi year support and historically 2 times price respect this trendline and made rounding bottom . If history repeat then may be price follow this setup .

BTC Another Bull Run $BTC is on the support level and just made another eq low and it might be forming range because of our previous strong pulse wave for accumulation and distribution... so we can now see another bull run to may be 24500

Let's not be Bullish for BTCDon't Panic
It's just the Recession 2022.
BTC is starting to go bearish from very first week of next month or anytime soon.
Hope you clear all your positions & be patient.
Wait for BTC to make it bottom and make an Entry.
Grab your Golden Opportunity.
