Bitcoin analysis History will repeat itself bitcoin going to crash till 40000$ as bitcoin always drop 80 to 60% of its present value and there is no other momentum is there to bitcoin will hit 1lac $$$$ bit event already ended and halving us elections etf and investments from giants from other hedge funds simple logic is bitcoin hardly go above 92 thousand as need more heavy liquidity to push above 1lac$ as of now in my opinion and analysis and experience with bitcoin from last 8years bitcoin will crash till this 2025 nov and 2 year of cycle will repeats as sideways to take all the liquidity from the market and big crashes in bitcoin. the era on as investment and taking profits 2x 5x in bitcoin is already end here and this asset will be stable for day trading and swing trading for upcoming 2 to 5 years.
Check other coins and make 2 to 10x on low to high risk avoid buying at news now hype already end
Bitcoinanalysis

MACD giving signal for trend reversal, waiting for Golden Cross-The market has been playing the same since the last chart. MA 200 has been a major support, did not let BTC price to cross it. Also sent pushed it up however as discussed in the previous charts " once a support is broken it becomes a resistance ", hence our level 2 which was previously a strond support has now become a strong resistance.
MACD shows a loss in Bulls potential, as the market has been in a bear sentiment for the past few days.
{Always keep in mind, before taking a long jump, the price has to take a correction. This way, new buyers get the chance to get into the market and paper hands are removed.}
Coming back to the chart, because MA 100, and 50 were present below the zone 2, it was hard zone due to multiple resistances and all the bull power exsausted there and because of that, the price was not able to break the upper wall of zone 2 and faced rejection (this is where we are right now).
What to Expenct now?
The 200 MA is continuosly providing support however, everything in this world has a breaking point. With multiple hits, even the strongest MA like 200 can be broken and psychologically setting a bearish trend is far easier than creating a bullish sentiment in the market. Most of the traders are fearful and the red in chart makes them panic and they sell causing more panic. This is dominos effect.
There is a chance of a Golden cross over at the mark X , this will give a bullish push to the price. This will happen when MA 20 will cross over the MA100. This should happen near about the base of zone 2, so that the bullish power helps in breaking the resistance of zone 2 and other MAs.
For the support at this point, we have 0.786 Fib level and MA 200, but they can't handle more pressure as well.
The doji green candles & heavy red candles shows that bulls are finding it hard to keep up with the bears.
Still the cross over in MACD is a good signal (marked).
When ever the blue line in MACD crosses the orange line (signal line) from botton to up, it is a bullish signal.
It should not come under orange, if that happens, we should get ready to see the $65,000 zone.

Bitcoin near on top to short move will massive fall down60000 to 53000 bitcoin downside move possible take trade on probability not certanity.this is for bitcoin direction purpose…

Bitcoin Technical Analysis - Bitcoin is trying to take some support from the zone of 67,000$
- Bitcoin on a Daily TF looks different its trying to consolidate and find a support that can stop its further drawdown
- The market from a technical perspective isn't portraying much bearish/bullish bias
- One catalyst can bring down/up prices more
- If you are looking for entries then I would highly recommend to wait for the weekends when you see prices filling back imbalances
- 63,000-65,000$ WILL BE A VERY GOOD ZONE TO ACCUMULATE ALT/ETH/BTC

BTCUPCOMING MOUMEMT for btc is a best for and best opportunity. Market is very choppy right now so u can see big move in market watch on eyes on trend line and when this trend line give break its give very good relly in market

Bitcoin rocket Booster Firstly you can see Bitcoin is reversing from its down trend, Now it has formed pole and flag on 1D frame.
You can also see it has given fake breakout on 200 Ema downside (Confirmation for upside strong momentum)
It has exactly retest from 0.38 Fibonacci level.
Last resistance has becomes today's support (where it has reversed from 200ema)

Bitcoin analyzing Elliot wave counts, Buy on Dips or on BreakoutHello Friends,
Here we had shared possible Elliott wave counts on 4 hourly chart of BTCUSD BITCOIN, which clearly indicates that we are in some kind of impulse wave, where we can get fresh opportunity to go long very soon, but, how and where, at which level, every thing is explained in this video post, so please go through out this video.
I am not sebi registered analyst.
My studies are for educational purpose only.
Please Consult your financial advisor before trading or investing.
I am not responsible for any kinds of your profits and your losses.
Most investors treat trading as a hobby because they have a full-time job doing something else.
However, If you treat trading like a business, it will pay you like a business.
If you treat like a hobby, hobbies don't pay, they cost you...!
Hope this post is helpful to community
Thanks
RK💕
snap shot of possible Elliott wave counts
Disclaimer and Risk Warning.
The analysis and discussion provided on in.tradingview.com/u/RK_Charts/ is intended for educational purposes only and should not be relied upon for trading decisions. RK_Charts is not an investment adviser and the information provided here should not be taken as professional investment advice. Before buying or selling any investments, securities, or precious metals, it is recommended that you conduct your own due diligence. RK_Charts does not share in your profits and will not take responsibility for any losses you may incur. So Please Consult your financial advisor before trading or investing.

Bitcoin Price Prediction, will BTC’s price hit $42000 ?BTC could hit $45022.18 in 2023
Bitcoin’s price prediction for the most bearish scenario will value BTC at $21516.80 in 2023
Bitcoin’s previous All Time High was on 10th November 2021 where BTC was priced at $69,045
Bitcoin’s price at the same time last week was $26911.81. It has moved by -1.78% in the past week and is currently at $26,896. Infact, in the past 24 hours, BTC has pumped by 0.41%. There is a slight bearish sentiment in the crypto market. The long term sentiment, however, remains bullish and BTC could hit $34590.00 in 2024.
Total circulating supply of Bitcoin as of writing this article was $19,380,912 and the Market Cap of BTC remains at $521,194,157,450.

BTCUSD possible Elliot wave counts of bitcoinHello Friends,
Here we had shared possible Elliott wave counts of BTCUSD-BITCOIN on 4 hourly chart, in which we can see post bottom formation in November 2022, bitcoin had started motive journey towards north direction as a fresh impulse wave.
In which we had completed wave (1) & (2) and now we are unfolding wave (3), in wave (3) we had completed wave 1 & now possibly we are unfolding wave 2, in which we are having subdivisions as wave (a), (b) & (c), here we are possibly in wave (c) right now, post completion of wave (c) we can assume that our wave 2 should be complete and fresh impulse as a wave 3 should start towards north direction. whereas invalidation level is mentioned on chart at 19569 because wave 2 will never retraces more than 100% of wave 1 as a wave principles. My studies are for educational purpose only. Please Consult your financial advisor before trading or investing.
I am not responsible for any kinds of your profits and your losses
Most investors treat trading as a hobby because they have a full-time job doing something else.
However, If you treat trading like a business, it will pay you like a business.
If you treat like a hobby, hobbies don't pay, they cost you...!
Disclaimer.
I am not sebi registered analyst.
My studies are for educational purpose only.
Please Consult your financial advisor before trading or investing.
I am not responsible for any kinds of your profits and your losses.

BTCUSD possible Elliot wave counts (up, then down and again up)Hello friends, here we had shared BTCUSD Bitcoin chart with possible Elliot wave counts on daily, 4 hourly and on hourly chart which seems aligned with each other, so the conviction increases.
Well, on daily time frame it seems that post correction we are unfolding wave 1 of some degree, in which we had already done wave 1-2-3-4 of one lower degree, and now possibly we are unfolding wave 5 of 1, so post completion of wave 1 we can assume that retracement is due as a wave 2 which can unfold as wave ABC hopefully, Overall we are in impulse towards north, one can wait for dips as a wave 2 to grab an opportunities to find best entry to go long, so we should have to ride only in right direction because right direction is always more important and better then speed. I am not sebi registered analyst, My studies are for educational purpose only.
Please Consult your financial advisor before trading or investing. I am not responsible for any kinds of your profits and your losses.
Possible wave counts on daily time frame
Possible wave counts on 4 hourly time frame
Possible wave counts on hourly time frame
Most investors treat trading as a hobby because they have a full-time job doing something else.
However, If you treat trading like a business, it will pay you like a business.
If you treat like a hobby, hobbies don't pay, they cost you...!
Disclaimer.
I am not sebi registered analyst.
My studies are for educational purpose only.
Please Consult your financial advisor before trading or investing.
I am not responsible for any kinds of your profits and your losses.

BITCOIN CHART ANALYSISBitcoin gave a Biggest Range Breakout but sudden fallback also..,,so is this False Breakout or small retrecemnt and after this, Can we see a Big UP Rally????
KEEP AN EYE ON IT…..!!!!

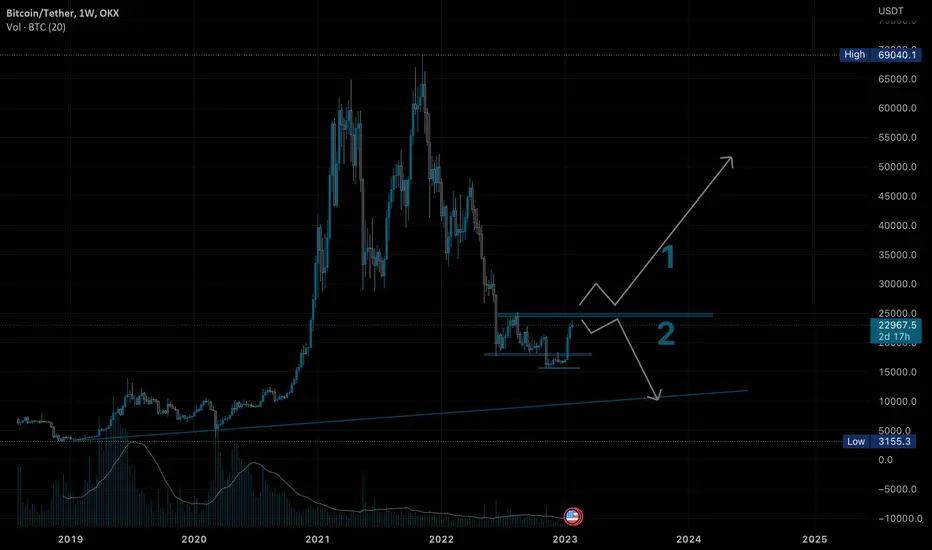
Bitcoin next move update1 or 2 ?
Lets not guess.
Lets react to the market
If guessing is the game i’l go with 1
#fingerscrossed
BITCOIN CHART ANALYSISBitcoin at its Crusial Level
First its going through its parallel channel along with that created Reactangle chart pattern and after Breaking Up Parallel Resistance Or Rectancle Lower Resistance at Same time its Straight forward its Previous Major Resistance of Rectangle Chart Pattern …..
There is more tha 3-4Days Bitcoin Is Cosolidating at Same Levels Breaking Eaither Side will See such Bigg Rally of Bitcoin

morning star in btcmorning star spotted in bitcoin in monthly time frame chart on a major support its a good bullish reversal sign .. so we have a good chances of bull run here

BITCOIN CHART ANALYSISBitcoin Formes a Perfect Ascending Tringle if it Break Upside We Will See Suchh Big Move Soon


btcusdtbtc follwing trendline and lower low in 1day time frame
probably can fall from here.
can be reacted according to the situation

Bitcoin technical analysis bitcoin retesting at a zone 30500usd if it sustain below 31000 for next 5-7days, it may test 20000usd we can see more fall in crypto currency.
if anybody wants to invest please wait and watch (if u want buy, buy @ 20000usd TO 21000usd or buy ABOVE @ 35000usd) #INVESTWISELY
****EDUCATION PURPOSEONLY****


Bitcoin Long position for short term!!Bitcoin about to give a breakout from descending triangle pattern at 17000 levels
Look for long opportunities in short term

Bitcoin Short-forming bear divergencesBitcoin is making bear divergences in uptrend in 15m time frame.Price is making a clear divergence of upcoming bear move as shown in the RSI .If the trendline breaks out,a short intraday trade can be initiated on 15m.Keep an eye.

BTC 1W Timeframe Chart AnalysisBTC 1W Timeframe Chart Analysis
If you want the best buying opportunity, wait a few weeks.
Buy Signal - 12100$ - 12500$

Is Bitcoin Ready for a bull run ! Bitcoin has seen a change in Polarity of a trendline. The volumes are supporting as well.
Lets see if the Run is bull or a Fake out.
Let me know your thoughts in the comments section.
