BCHUSD - The Squeeze is Tightening. Decision Imminent?BCH is providing a textbook example of Price Compression on the 4H timeframe.
When price gets squeezed between a rising trendline and horizontal levels, volatility usually follows. Currently, BCH is testing the validity of the trendline support.
Key Levels to Watch:
Support Defense: The bulls need to hold the $558 level to maintain the uptrend structure.
Invalidation: A breakdown of this trendline changes the market character from accumulation to potential distribution .
Trading Plan: Watch for volume on the reaction. A low-volume bounce might be a trap, while a high-volume rejection of the trendline confirms weakness.
Trade safe and manage your risk!
Bitcoincash

$BCH hasn’t hit a new ATH since 2017: Dead or Utimate Sleeper?SET:BCH hasn’t hit a new ATH since 2017: Dead or the Utimate Sleeper?
SET:BCH ATH: $4,212 (Dec 2017)
CRYPTOCAP:BTC ATHs: $19,800 (Dec 2017), $69,000 (2021), $126,000 (2025)
Observation:
SET:BCH hasn’t touched a new ATH since 2017.
CRYPTOCAP:BTC surged 6x+ after 2017 ATH, but SET:BCH stalled.
Is SET:BCH dead ❓
Key TA Levels:
🔹 Strong accumulation zone: $465 – $375
🔹 Critical support: $375 (holding this is essential)
🔹 Potential upside: $2,000 – $4,000 if momentum returns
Eyes on these levels. SET:BCH could be a sleeper play if it reclaims support.
Pro Tip: Patience + volume confirmation = key before any breakout.
NFA & DYOR

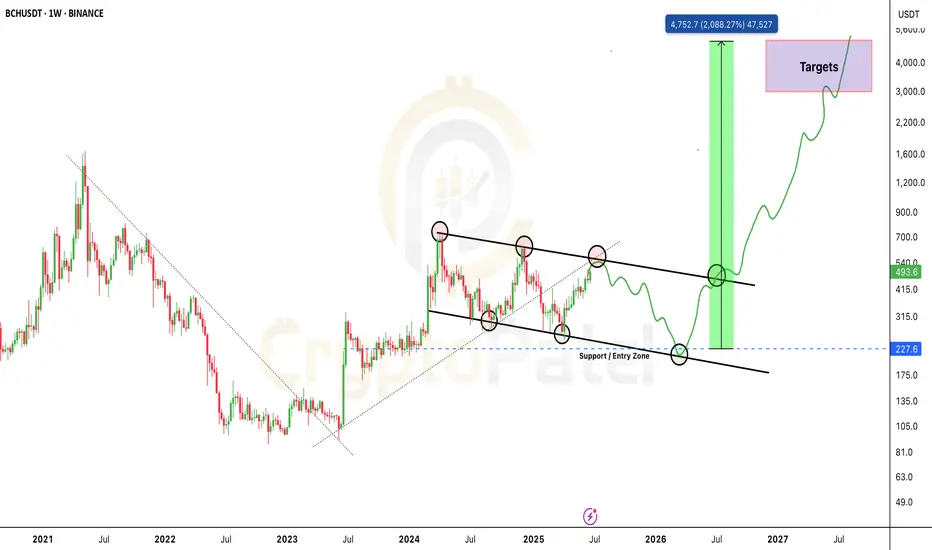
BCH Could 10x in the Next Bull Run — But Not YetBCH Could 10x in the Next Bull Run — But Not Yet
Bitcoin Cash is still trading inside a big falling channel.
Every time price hits the lower zone at Bull Flag, it bounces back up — this is the strong Support / Entry Zone.
Right now, BCH is near the upper Trendline Resistance (~$550-$580).
But IMO, we could see one more retracement before the next big bull run. I’m expecting price to revisit the $250–$210 zone before the next leg up.
However, if BCH breaks and holds above $640, that would confirm a bull flag breakout — turning the structure fully bullish with potential long-term targets between $1,800 – $4,000+ by 2026–2027.
Stay alert. The setup is big — but timing is key.
Note: NFA & DYOR

BCH/USDT — The Final Dip Before a 10x Move?Weekly Chart Analysis | Long-Term Setup
BCH is forming a powerful macro structure that could lead to a massive breakout.
🔹 Descending Channel Structure
The price has been respecting a clean descending channel since 2023.
Each rejection from the upper trendline has led to a higher low — showing clear accumulation.
🔹 Key Entry Zone: $220–$230
This zone has acted as major support multiple times.
If BCH revisits this level and holds again, it could trigger a major trend reversal.
🔹 Breakout Targets: $3,000–$5,000
If the breakout occurs as projected, BCH could rally into this zone in the coming bull cycle.
This would be a potential 10x+ opportunity from the bottom range.
Final Thoughts:
📌 This is not a short-term play.
📌 It’s a macro setup for serious investors and position traders.
📌 The structure mirrors historical accumulation zones seen before massive moves.
💬 What’s your take on BCH long-term?
Comment below and share your chart if you’re tracking it too 👇
BitCoin CASH #BCH READY FOR THE PUMP This one is one of my Fav and has made me a fortune in the past
Looking for the same this time
We will trade the range here and the IDEA that this cup need an HANDLE
And then the CnH will be Ready for the breakout
RANGE (420->786)
220->420 TP1
420->620 TP2
620->786 TP3
786->888 TPX
786->1786
SL 210

BCHUSD under Consolidation - Might turn BearishI feel BCHUSD might turn bearish below 315 because there might be a small distibution phase if the previous resistance is not broken !

BCH Pumped 107% in 10 Days #BitcoinCash Pumped 107% in 10 Days
➡️ Bullish Pennant Breakout
➡️ Breakout + Retest
➡️ Perfect Target as per Chart Pattern
CRYPTOCAP:BCH

BCHUSDT is under symmetrical triangle patternSignifies consolidation and accumulation.
The price sets lower high and higher lows respecting two trendlines to identify markets future direction, one should wait for bearish or Bullish breakout of the triangle pattern

BCH/USDT: A Comprehensive Outlook for Traders and Investors
In this technical analysis, we delve into the BCH/USDT trading pair to identify potential trading opportunities for both aggressive players and long-term investors.
1. Resistance Area - 250-257:
The BCH/USDT pair encounters a robust resistance zone between 250 and 257. Historical data indicates that price movements tend to stall or experience pullbacks around this level. Traders should approach long positions with caution, as the price may struggle to break through this barrier in the short term.
2. Aggressive Shorting Opportunity at 235-240:
For aggressive players, shorting opportunities arise at the current price levels of 235-240. As the price approaches the upper range of the resistance area, bearish sentiment could intensify, leading to potential short-term declines.
3. Expected Correction to 195-200 Levels:
Our analysis suggests an impending corrective phase for BCH/USDT, with the price likely to correct towards the support levels of 195-200.
4. Favorable Buying Area - 140-150 Levels:
A compelling buying opportunity emerges at the 140-150 support range. Long-term investors seeking to build positions in BCH may find this area advantageous for accumulating assets.
Remember to adopt prudent risk management strategies to maximize gains and mitigate potential losses. Stay informed, and happy trading!

BTC at the Resistance, can go below 20kAs u have seem in chart btc has reached at resistance and order block. btc should break these and stay above to get a bull momentum towards 25k . my thought is that btc is goin below 20k or to new lows. DYOR

Bitcoin consolidating in a box pattern.Bitcoin on the weekly time frame has given a bearish moving averages cross over and has been consolidating in the previous weeks range. The market is consolidating in a Box pattern.
The market are in a bearish trend as Dow has broken its 29000 level after taking resistance from its weekly 20 ema and closed below its 200 ema.
Global markets are negative and the crypto markets follow the similar trajectory of the US market.
Coin, on the daily time frame, is taking a serious rejection and is constantly falling after getting rejected form the 20 DMA.
It has been consolidating in a narrow range of 1.5-2% for three days. It has given fake outs on both side but couldn't sustain above/below the levels.
On the hourly time frame, it is trading between 20 and 200 ema.
Support :- 19290, 18870, 18600
Resistance :- 19630, 20000, 20330.
The price range from 19290 to 19630 is a no trading zone.
A swing or intraday trade can be initiated if the price sustain above the levels on the 60 minutes chart.
Wait for the price action near the price levels before entering the markets.

Let's not be Bullish for BTCDon't Panic
It's just the Recession 2022.
BTC is starting to go bearish from very first week of next month or anytime soon.
Hope you clear all your positions & be patient.
Wait for BTC to make it bottom and make an Entry.
Grab your Golden Opportunity.

Bitcoin consolidating in a wedge pattern.Bitcoin on the daily time frame has been consolidating in a range and is taking support around its 20 DMA.
On the weekly analysis, the moving averages are getting close enough but the price is below both 20 and 200 ema.
The coin price is around its hourly 20 ema and its taking a support from it.
The coin is forming a rising wedge pattern on daily time frame.
Once the pattern gives a break out, bitcoin can give nice targets on both side.
Watch for the price action before trading the setup.
Support and resistance levels are mentioned in the chart itself.

bitcoin 12.07.2022: entry & exit is very important
: try to manage money management
: know your stop loss
: find the chart pattern / analysis the chart before you enter

Bitcoin trading in a triangle.Bitcoin trading in a descending triangle formation after fall.
It has been consolidating in a range after failing to hold its 20 ema on weekly chart.
Bitcoin has recently tested its weekly 200 ema has is consolidating just above it.
There is a resistance and a support which has been tested many times and once broken can give nice targets.
Support :- 27100, 28650, 28500
Resistance :- 30500, 31800
The coin is silent for half a month.
Watch for the price action near the triangle breakout.
#bitcoin #btcusd

Bitcoin respecting the trend line.Bitcoin has been respecting a trend line and is taking support from it.
The coin is trading around its 20 ema on 15 mint time frame.
Support will be the trend line. Let the price trade below the trend line or breaks above the level of 38810.
On daily time frame, it’s forming an inside candle.
Support :- 38100, 37700
Resistance:- 38810, 39270
Wait for price action near the levels for entry.

BTCUSD Bitcoin / U.S.D Mid term view Bitcoin level analysis in day chart, please follow levels, for educational purpose only.

BTC channel pattern4 touches at bottom
3 touches at top
Buy with your setup in anticipation to touch top
BINANCE:BTCUSDT

Bitcoin view 14/04/22.Bitcoin is trading around a crucial fib level on a weekly time frame of 41390 (0.50 fib level).
It seems bullish on higher time frames of weekly as it has taken support form 0.382 fib level, for swing trades we can enter is a 4 hour candle closes above 41500.
On daily time frame analysis, it is forming a lower highs and lower lows and has given a cross over of moving averages, thus looks bearish.
If the price drop below 39300 it can test levels of 37500-600.
Support :- 40400,39790, 37600
Resistance :- 41390, 42100, 43010
On 4 hourly time frame, it has crossed its 20 ema with a bullish candle and is trading in a range.
Wait for the level to break convincingly and there can be a trend reversal in a shorter time frame.

Bitcoin forming evening star.Bitcoin on a weekly analysis is forming an evening star chart pattern and is taking support. It is trading below its 20 ema and 0.382 fib levels.
On daily time frame, it has closed below is 20 and 200 ema and seems little bearish for short time fame as 4 hour time fame has given a moving average cross over.
It can retest its 20 ema on 4 hour time fame and fall further.
Support :- 42100,41380. 39790
Resistance :- 43010,44550, 45600
Supports may be breached once the price trade below the levels and sustain.
Bitcoin has streched and can come futher down to test the levels
Wait for the price action near the levels before trading,

Bitcoin near resistance level.Bitcoin has been respecting the resistance level of 44500 and is just below the 200ema.
On daily chart frame,the chart pattern formed near the resistance level will help is confirmation of the movement of the price above or below the resistance levels
The bitcoin is forming a ascending triangle chart pattern on a bigger time frame.
Support levels :- 41980, 37700
Resistance levels :- 44500, 45800
Wait for the candlestick chart pattern to be formed near the zone to find the movement in bitcoin.

BITCOIN IS HEADING FOR CRAAASSSHHH!!!Two back to back Head and shoulders on weekly backed by good volume, THINGS DON'T LOOK GOOD FOR BITCOIN. I would dump and run for cover!!!

#bitcoin #btcusd #cryptoBITSTAMP:BTCUSD
Be ready for big ride, whoever holding from our previous alert can still hold of book partially and now hold for target more than 80k +.
