BTCUSDT Today ForecastBTCUSDT Today Forecast
IMO
Give a Like and Feel free to share your opinions in the comment!
Happy Trading 😊
Bitcoinforecast

BTCUSDT Today ForecastBTCUSDT Today Forecast
IMO
Give a Like and Feel free to share your opinions in the comment!
Happy Trading 😊

BITCOIN BELOW $ 45000 ! WHAT NEXT?BITCOINS JOURNEY SINCE DEC 2020 TO JAN 2021
The major cryptocurrency Bitcoin prices has recently slashed from $69,000 to $40,000 in about less then 2 months. Bitcoin was on its peak at $69,000 on November 10th, 2021 and it made a recent low of $ 39558 on Jan 10th 2022, a decline of 42%. However, in last few days it gave a sharp upside movement towards $45,000 from $ 39558 and trading between $42,000 to $43,000, but the question is that will this short rally will continue or Bitcoin has ended its rewarding era?
TECHNICAL ANALYSIS
LAST ONE YEAR HISTORY
Over the last year, since 20th Dec 2020 Bitcoin started its upward rally and climbed to almost $ 65,000 in very short span of time and made its a fresh lifetime high of $ 64,895 on 14th April 2021. Investors who rode this rollercoster that started from $24,000 on 20th Dec, cherished the rally and a earned whooping return of almost 170% and that too only in 4 months (512% p.a).
BUT, this rally didn't sustain and Bitcoin prices slashed to $28,600 on 22nd June 2021, which means it lost all the return it gave in less then half of the time that it gained in last four months.
Though, Bitcoin never disappoints its investors, it started a fresh start from the mid of 2021. A fresh sharp rally was seen in Bitcoin, when the prices shot up to $69,000 on 10th Nov 2021 from just $29,000 on 20th July 2021, means it rewarded its investors once again with a three digit return. But, soon after making a fresh life time high of $ 69,000 on 10th Nov 2021, it once again moved downward and slashed to a low of $40,000 on 10th Jan 2022.
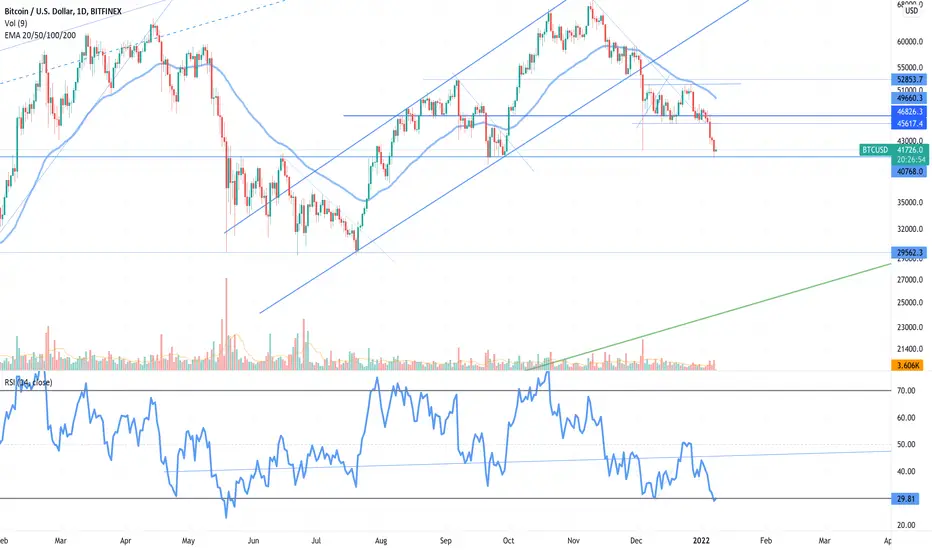
CURRENT SCENERIIO
Over the last year (as explained above) it has created a "M" shape return to the investors, which in technical langauage is called "A Double Top" pattern which is yet to be confirmed. According to this pattern if any script falls below the neckline (marked red in image) then prices may fall equivalent to the height of this pattern which is aproximately around $ 35,000.
CONCLUSION
If the price of Bitcoin falls below its recent low of $ 39,558 which it made on 10th Jan 2022, then we expect a further downtrend in bitcoin in 2022 uptill the mark of $25,000. So if you are a swing trader, you can make position with a stop loss of $ 39,500 (Marked Yellow in the image) for target of $ 45,000 to $50,000, But if you are a Value Investor, then you should only invest 30% of your total amount at current levels around $42000-$43000. Rest of the amount should be kept either for the further corrections or till the upward movment is confirmed by the upcoming trends.


Bitcoin analysis2hr tf bitcoin
Btc seems to be in an indecision mode right now.
What happens next depends mainly on the news.
And the fate of btc's bull run depends if it gives a breakout or a breakdown.
Trade according to the next move.
Not financial advise.

BTCUSDT Today ForecastBTCUSDT Today Forecast
IMO
Give a Like and Feel free to share your opinions in the comment!
Happy Trading 😊


Weekly BTCUSD(11th January)After 4 weeks of continuous sideways trend, BTC plummeted by ~11.50% in the last 7 days alone, thus the largest weekly decline of 2022. It formed a big bearish candle on the Weekly TF and closed below its 50-WEMA, this depicts a decisive breakdown below major support. At the time of writing, BTC is trading slightly above $41,500.
On the Daily TF, BTC is on the verge of giving a Death Cross as its 50-DEMA is crossing below its 200-DEMA which suggests that further downside rally can continue in the coming weeks with minor pullbacks.
On the downside, the nearest support is presented by its 0.786 Fibonacci Retracement level which is placed at $38,500, if this level is broken decisively, the next support is present at $36,000. On the higher side, the immediate resistance is present at $42,800, once BTC closes above this level on the daily basis, the next resistance is present at $44,750 followed by $47,000.

Head & Shoulder - BTC - might see 30k levels.BTC on the verge of breaking H&S neckline at 40k on Daily and Weekly charts. We might see BTC at 30k if it gives closing below 40k.
Keep an eye.

Bitcoin THE KING- BTCUSDBitcoin is already been in a downtrend for the past few days in the lower time frames. It looks like BTC is planning for a major liquidity grab before making the next big move towards the moon. I personally will try to take this as a chance to buy more BTC if it reaches anywhere near 24k to 27k. This is not financial advice. Invest only what u can afford to lose.

Bitcoin 1-Day Time Frame Bullish MoveBroken Trendline. Bullish move. Targets as seen on the chart. Keep trailing profits.
T1: 52137
T2: 54114
T3: 56871
T4: 64107

BTC current scenarioIn previous 2020 starting btc broke the head and shoulder pattern the same way it is doing right now if it broke the pattern downward we might see btc price easily on 37000 or below but as per rsi we might see some good buying in the $40000 zone.

📊 Bitcoing Swing Trade Opportunity 🎯BITSTAMP:BTCUSD
📌 To Trade on This Chart, You Should Have Reversal Trading Knowledge. As Harmonic is One Of The Best Reversal Trading Strategy, But Always Remember That Harmonic Patterns Also Can Fail (there is no holly grail In Stock Market). That's Why One Should Must Have Knowledge Of Reversal Trading To Trade On Harmonic Patterns.
📌 That Dash Line Is Called PRZ, From That Dash Line To that Horizontal Simple Line Area Is Whole PRZ(Price Reversal Zone).
📌 As One can see, Quite Big Stop Loss as per this pattern. So wait for perfect reversal first then only go for long and ones enter in trade then strictly follow stop loss and here as per my own experience one should keep Stop Loss as closing basis.
(PRZ :- Potential Reversal Zone, SL :- Stop Loss, TF :- Time Frame)
PRZ 1 :- 41101.80
SL :- 34983.5 (Closing Basis) (better to enter after reversal candle and keep sl below that candle if you atre trade for swing or short term)
Target 1:- 44369
Target 2:- 46643
Target 3:- 48971 and more Trailing basis
Note:- As Per this harmonic pattern, stop loss is quite big, so Trade on reversal only if you don’t know what is reversal, Kindly note that and ask in live session so next time you could be able to identify reversal by your self. Even ask doubts in comments, below.
******whatever charts or levels sharing here or on any other platforms are just for educational purpose only, Not A Recommendation To Buy Or Sell. Please do your own analysis before taking any trade on them. We are not SEBI registered.

Bitcoin casual price forecastBitcoin casual price forecast based on Trend and Time based Fib extensions.
Future price projection is based on last cycle Top and bottom assuming similar trend may occur again which might not be the case.
It is a casual analysis just to get an idea, not to be considered for actual trading.

Bitcoin-Finally retested the 40k Level.Do you see any pattern similar to the prev crash?
Probably the worst is over.
The fear index is hovering over 10 which is the lowest ever seen in the history of the markets.
Even if we breach the 40k we have an impregnable wall at 30k.
Hope el Salvador and other institutions will come to rescue us if we reach there in an extreme cases.

BTC ANALYSISI have mentioned the range in which btc is moving. This range has to be broken for btc to show any clear movement. Lower range broken we can see 37k-39k and staying above 53k will be good indication for new ATH if the volume is supported.

Weekly BTC-USD(3rd December)After the last weekly gains, BTC again witnessed a bearish movement and closed the week with a 6.90% decline. It continues to consolidate in the range of $45,000 to $51,000 for the 4th straight week, which suggests that the tussle between bears and bulls is still going on and there is no definite trend. At the time of writing, BTC is trading slightly above $47,000.
On the Daily TF, BTC is sustaining below its 200-DEMA but managing to hold its support presented by 0.786 Fibonacci level which is present at $46,200.The trading range has been diminishing for the past 5 days and a breakout to both sides can be expected in the coming weeks.
On the higher side, the immediate resistance is placed at $48,500, if BTC manages to close above this level, the next potential hurdle is present at $50,000 followed by $52,000. On the other hand, the nearest support is present at $45,600 but if it breakdowns below this level, the next major support level is placed at $44,500 followed by 43,500.
As per the Momentum indicators, the weekly MACD has turned bearish and further downside corrections can be expected, whereas, Weekly RSI is trading flat in the range 43-46. According to the current technical charts, we advise traders to wait for the market to depict a definite trend before taking any new positions

Bitcoin Trading Near Do or Die ZoneWhen price break any well defined boundary below 200 Day Moving average and sustain then high chance price continue the trend . Also made a Head & Shoulder Chart Pattern . Pattern activate when price break the neckline .

Bitcoin price Prediction Jan 2022Hello , I have made a meaningful technical analysis for entry and exit points of bitcoin trading.

Weekly BTC-USD(27th December)After consolidating in the range of $46,000 to $50,000 from the last 15-20 days, BTC closed the last week on a positive note with ~8.81% gains. Other crypto assets also witnessed a positive week as the combined crypto market increased from $2.10 Tr to close the week at $2.395 Tr. BTC formed a strong weekly candle which slightly depicts further movement to the higher side that can be expected in the coming days.
As per the Daily TF, BTC is trading between its 200-DEMA and 50-DEMA for the last 4 days but the trading range is getting narrower with every passing day, which suggests that a breakout can be expected in the coming days. On the higher side, the immediate resistance is presented by 50-DEMA which is placed at $52,500, however, a decisive breakout above this level can trigger a fresh new move to the higher side till the first level of $54,000 followed by $55,600.
On the lower side, BTC has sustained above its 200-DEMA from last 4-5 days, which suggests that strong buying pressure is present at this level, but if bears managed to break this level again, downside rally can continue for the first level of $48,500 followed by $46,000.
As per the candlestick patterns, BTC has formed a Bullish Engulfing kind of pattern on the weekly TF which suggests that trend reversal is on the cards, however, momentum indicators are still lagging the strength, therefore, we advise traders to Go long only with tight Stop Loss.

BITCOIN Analysis (W)Long BTC above 52K If Broke with an engulfing Candle.
Stop Loss below Candle Low . . . I think it will make a new high If momentum sustains..
Thanks ! Do follow me for more Analysis.
BINANCE:BTCUSDT
