BITCOIN BACK TO 109K..... Bell is ringing....Through my analysis, weekly shows firm bullish.
Geo political uncertainty all over the world because venezuela president capture.
Join this with weekly bias leads to lot of upward momentum.
Bos happened in daily timeframe with good price momentum.
So the next resistance is 97k and then to 109k.
Mark my words it will reach in one or two weeks .
The ball and bat is in perfect place , SWING is guys.....
No regrets......
Bitcoinlong

Bitcoin - Elliott Wave Analysis - weekly TFHallo crypto traders bitcoin completed Expanding leading diagonal pattern in grand super cycle degree now in correction phase so wait for long fib ret 61.8% level then big move starts (wave 3)

BTCUSD - Wave 5 Decline Still Likely AheadPrevious Analysis:
BTC is approaching a critical reaction zone where the current rise looks more like a corrective push than the start of a new trend. Price is moving toward the highlighted supply region, which aligns with a potential wave 4 completion inside the descending channel. The structure from the recent low shows an internal a–b–c formation, suggesting this bounce could run into exhaustion as it enters the red zone. Unless BTC breaks out of the channel with conviction, the broader momentum still leans bearish. A rejection from this region would likely trigger the final wave 5 leg, driving price toward deeper Fibonacci levels and completing the corrective cycle before any meaningful recovery attempt can begin.
Stay Tuned!
@Money_Dictators

Intraday Long Setup | Oct 26th 2025 | Valid Until Daily ClosePrice might retrace to a strong pivot zone.
Structure remains bullish with potential for continuation after pullback.
Tight risk control.
Watch for price reaction within the red zone. Entry only if confirmation appears
The setup expires at end of the daily candle close.

ETHUSD: Where Price Could Go?4h tf
ETHUSD has bounced back strongly from around $3,826 after completing an A-B-C wave pattern. Right now, the price is testing resistance near $4,756. It could drop a little to around $4,440 before moving higher again. If the uptrend continues, the next target levels are $4,955, $5,300, and $5,500.
Stay tuned!
Thank you,
@Money_Dictators

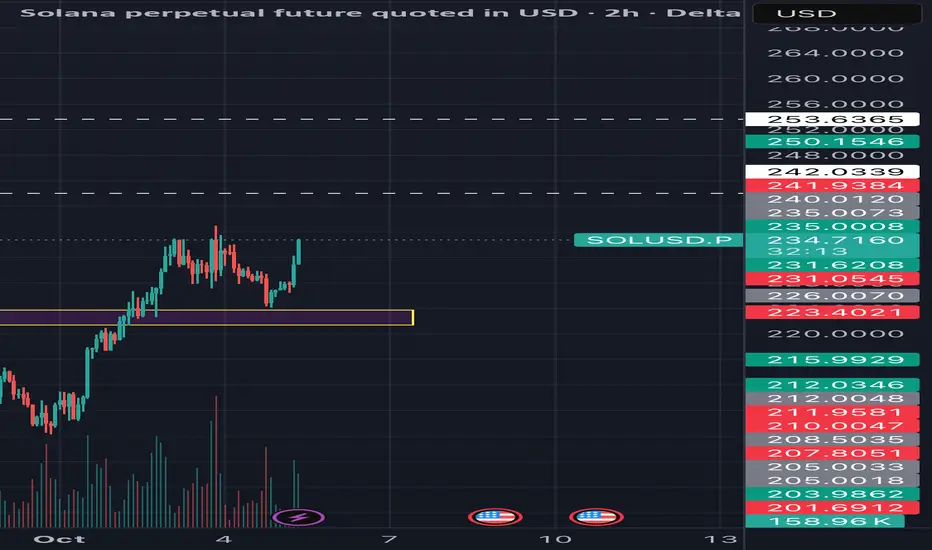
Breakout Play: Demand Zone Reversal with High R:R TargetOverview :
This idea focuses on a breakout trade for Solana (SOLUSD), leveraging recent price action and volume signals at a key demand zone. The setup is designed for a high risk-to-reward ratio based on technical structure and confirmation tools.
Trade Setup & Logic:
• Entry: Price retraced to retest the 225–230 support zone, which previously acted as resistance and now converts to demand. Entry is triggered by a strong bullish candle closing above 231.5 with an uptick in volume, confirming renewed buyer interest.
• Stop Loss: Placed below 225, the lower bound of the highlighted demand area, to minimize risk if support fails immediately.
• Targets:
Target 1: 241 (first major supply zone and prior swing high).
Target 2: 253.70(multi-week trend resistance, aligns with fib extension and liquidity clusters).
• Risk-Reward: A minimum R:R of 1:2 is targeted. Stop loss is tightly managed once price moves in favor, with trailing stop as price approaches Target 1.
Technical Factors:
• Support/Resistance: The purple highlighted zone shows a confluence of prior reversal points and volume spikes, indicating strong institutional activity.
• Structure Confirmation: Entry is only valid upon a clear bullish reversal signal above the support zone and confirmation of above-average volume.
• Market Context: Recent downtrend is breaking, with higher lows and higher highs. Supply absorption observed at the retest supports the bullish thesis.
Trading Plan:
• Wait for price to close above 231.5 with volume confirmation before entering.
• Adjust stop loss to breakeven after Target 1.
• Take partial profits at Target 1, let remainder ride up to Target 2.
Final Notes:
Discipline and patience are essential—trade only on confirmation to avoid false breakouts. Self-research is recommended, and risk should always be managed per personal capital allocation protocols
Disclaimer: This is a technical analysis idea, not financial advice. Please perform your own due diligence before trading.
BTC @ Strong Support - 117K Resistance turned Support areaIf Bitcoin is Bullish then price cant go further below than this area at 117K where price broke the resistance line forming the support. Which is the last and strongest support area for Bitcoin in chart.
I am 100% long in Bitcoin at this level now with all required margin in case of any more false down move. will need to hold this long for new ATH. I do not have any other strategy for now.
All data and impacting factors for Bitcoin suggesting +ve for Bitcoin.

BTC - OTE + SD Entry Model1H - 15m Analysis
1. Optimal Trade Entry (OTE) level tapped
2. Standard Deviation (SD) Projections marked out as Targets
2-2.5 zone as 1st TP
4-4.5 zone as 2nd TP
3. Liquidity pool below is set as StopLoss
Let's HODL!
Share your analysis as well!

#ETH Bullish Idea And Possible MoveAll signs point to Ethereum’s crash risk being behind us for now. Get ready—once the volume picks up, ETH is set to pump hard!
I’m using a unique approach beyond just the usual TA and PA, so don’t overthink it. Just follow the trend and watch those candlesticks light up!
Disclaimer: This isn’t financial advice or a trade call—just sharing my excitement!
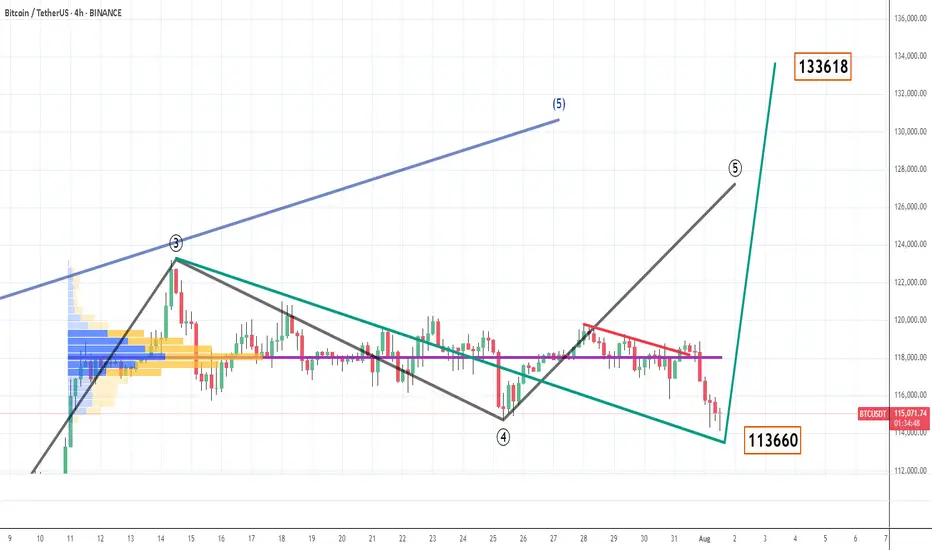
BTC - 1st Aug view - 4th wave revised and new TP - 133KBig players played a false move to shake weak hands when US data, trade deals, crypto policy etc etc favoring continuation of impulsive move. But its big players deliberate move to generate liquidations and get bigger qty of bitcoins.
Now
As per revised 4th wave shown in green line and black was earlier given wave counts.
There is no 100% accurate levels and its based on demand and supply when ever big players and algo wants to move the price either side.
In case price move above 116030 then i wish to consider 4th wave is done and we move towards 133K even if its not going to happen then also mean revision or rejection comes above 118K only and risk to reward Favours buying this dip or hold with money management.
Tariff news is not at all a impacting factor for economy as US customers going to choose the better deals and move on. every day importers and exporters compete with each other. countries compete with each other. why BTC which gets higher price due to fiat money printing get impacted now. its all big player games i think
Trendline Support Retest in BTCUSDBTCUSD is currently retesting a crucial trendline support after a sharp pullback. Price broke above resistance earlier and has now returned to retest the breakout zone — a classic setup where buyers may step back in. ✅
📉 After a strong downtrend, we saw a bullish reversal pattern forming, followed by a clean breakout. This retest can act as a potential entry point for a long setup, provided the support holds.
📌 Key Levels:
Support Zone: ~$115,250 – $115,280
Resistance Zone: ~$116,180 – $118,200
Risk-Reward looks balanced with a well-placed SL below the retest candle.
🛡️ Watch for bullish confirmation (like a strong bullish engulfing or volume spike) before entering!
📅 Timeframe: 15-Minute Chart

BTC ready to move up?An impressive wave 2 structure is about to be completed. We may observe the next wave 3 on the upside.
BTCUSD - Consolidation Breakout & RetestBitcoin has successfully broken out of its consolidation zone on the 15-minute chart. After a strong breakout above the horizontal resistance, we are now seeing a textbook retest of the breakout level, which may act as a fresh support.
✅ Bullish confirmation if price sustains above the breakout zone
📍 Resistance turned support at ~118,700
🎯 Upside momentum likely to continue if this retest holds

YFI Long SetupYFI has shown a strong rebound from a well-respected support zone after multiple rejections from the lower range. The price recently broke out of a descending channel, signaling a potential reversal from the bearish structure. This breakout was accompanied by a decisive bullish candle with strong body and increased volume—hinting at institutional buying. After the breakout, YFI has formed a tight consolidation (bullish flag) just above the breakout zone, suggesting strength and continuation potential. A clean push above the flag resistance or a retest of the breakout zone with bullish confirmation can offer a high-probability long opportunity.

OMG Bitcoin New Break-out After the More than 6 Month Bitcoin Successful breakout the Rang making the strong New High this is show the Clear cut show money move in the Bitcoin, Doller is continue fall. This show that the Doller is weak as compare to bit-coin. I am bullish but that time no up side target of the bit coin.

$BTC Potential Opportunity$105,398.80 is a promising zone for the next potential long entry on $BTC.
If this level fails to hold, the next key area I'd be watching for a possible long opportunity is around $303,000.
This is not financial advice. Always trade at your own risk.

BITCOIN: Wait For The Drop! Fellow Traders,
Hope you are doing great, in our view bitcoin is likely to drop around 90k region. So Expect price to breakthrough the sellers pressure and then drop around 95k first and then 90k which will be a key level for swing buyers.
Thank you

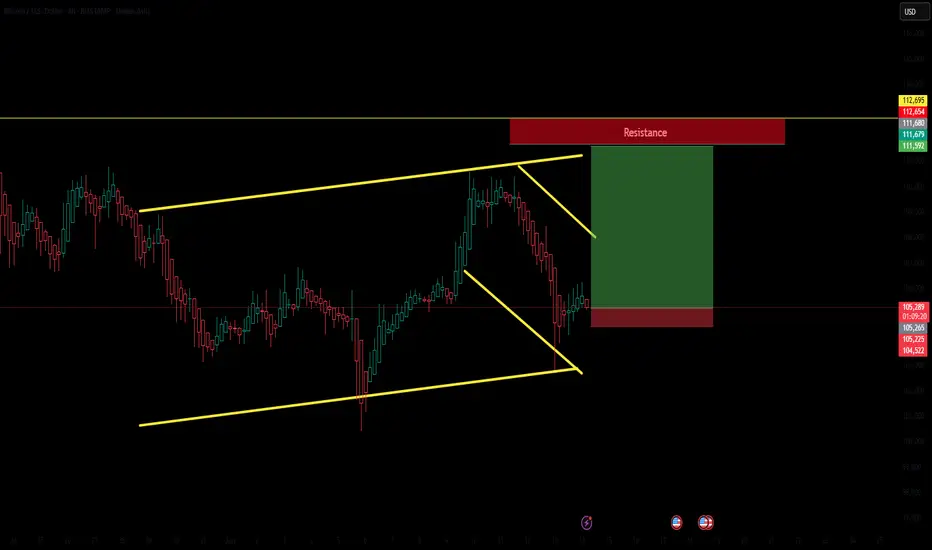
Bullish Falling Wedge Breakout Within Ascending ChannelBitcoin is currently presenting a strong bullish setup on the 4H chart. Price has bounced from the lower boundary of a long-standing ascending channel, forming a falling wedge — a classic bullish continuation pattern.
The breakout from this wedge aligns with a key support level and suggests a potential move toward the upper resistance zone at $111.5K–$112.7K, which also aligns with the upper trendline of the broader ascending structure.
Momentum confirmation above $106K could accelerate the upside move.
Target zone: $111.5K–$112K
Invalid if price breaks below $104.5K
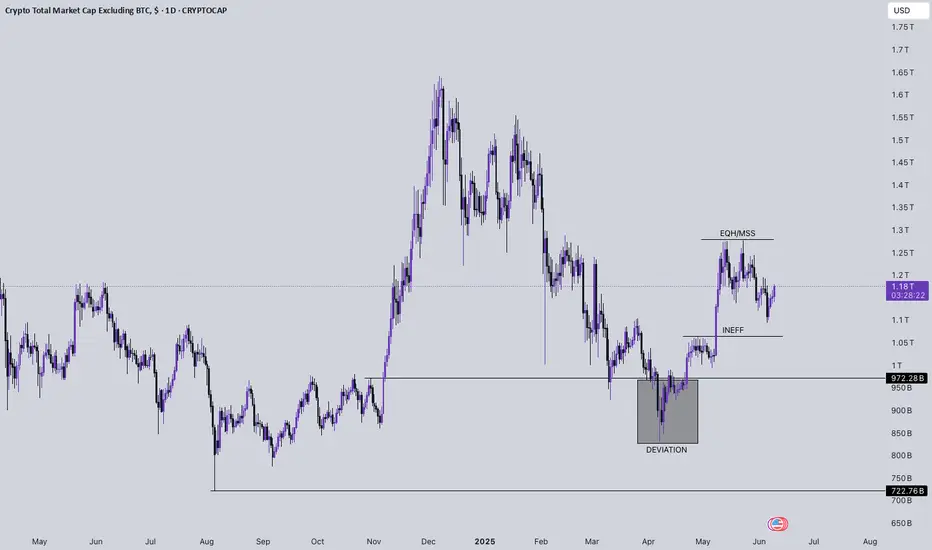
TOTAL 2 Price Action & Commentary - T2 is currently trading at 1.17T$ down from 1.28T$
- T2 is currently trading a discount array but the structure needs more strength and infusion.
- We need to see a structure shift above 1.28T$ and then retrace back after purging that recent swing high
- That retracement is going to be a confirmation entry offering a decent R:R
- However, for a larger R:R we need to enter in Alts setting up strong at this stage after pairing the location of USDT Dom which will help you refine your entry location
- Manage you risk and allocation size accordingly
BTCUSDT | Weekly Analysis June 9-13 2025Hi,
I am sharing my view on BTC further upside movement if sustatined above 107391 then next will be 109501 and 111429.
Disclaimer: This is only for educational purpose.
Thanks

I am back with my BITCOIN prediction!! New all time high.....As per my analysis bitcoin is ready to break the roof top with it's long term rocket booster🚀.
Price takes the higher time frame liquidity and give nice push towards upside.
So the next resistance is consider as new all time high and get on the if you want.
Time is ticking, 3,2,1 suiiiiii🚀.
Just making fun with you guys.
Don't just follow mine blindly.
As you guys know the ongoing clash between musk and Trump.
I am with musk, so dollar will get hit( because of Trump).
They will show dollar is soo good. But America is falling.
You may ask, Trump is supporting the bitcoin, it will affect if he fails?
Yes I agree. It will affect a bit with some noise of market condition. Because
Trump is just a news,( like if you throw a stone into a water it will waves with sudden, overtime water will become to it own shape( fundamental is important) , bitcoin is also like water).
Consider that America is falling, new power is rising IYKYK.
This happens many times in the history ( rising and falling of empires).
I can say bit more , but this is enough to make a decision.
These are all my opinion, not a financial advise.
Comment your thoughts and share some of your knowledge with me.
I am ready to learn.

BITCOIN - SYMMETRICAL TRIANGLE FORMING WITHIN A BULLISH TRENDSymbol - BTCUSDT
Bitcoin is consolidating. A symmetrical triangle pattern is forming within the context of a prevailing bullish trend. Based on the current technical setup, it is reasonable to interpret this consolidation as a preparatory phase for a continuation of the upward movement.
Fundamental nuances have gradually improved over recent weeks, contributing to a moderate revival in the cryptocurrency market. From a technical standpoint, the market structure on the daily chart appears constructive. Following a period of strong upward momentum, the price has entered a consolidation phase rather than showing signs of reversal. The overall market remains bullish. After approximately 2–3 weeks of consolidation, a bullish distribution pattern appears to be developing. This cycle has repeated on two previous occasions. On the daily timeframe, the presence of extended lower wicks during the consolidation phase suggests that large market participants (whales) are actively absorbing downward pressure, thereby preventing the price from entering risk zones. Accordingly, it is likely that the current consolidation could persist for a time, and there remains the possibility of a retest of the triangle’s lower boundary or even a deeper move to test the liquidity zones around 1,01,400 and 1,00,700 before resuming the upward trend.
Resistance levels: 1,03,600, 1,04,400, 1,05,000
Support levels: 1,02,500, 1,01,400, 1,00,600
A downside scenario may be considered if the price breaks through the triangle’s lower boundary and stabilizes around the 1,01,400 level, potentially forming a pre-breakdown consolidation-assuming no immediate rebound follows.
However, at present, intraday trading strategies can be considered within the range of the ongoing consolidation. A breakout to the upside and continuation of the bullish trend would likely be signaled by consolidation within the 1,03,500 to 1,05,000 range, accompanied by price compression toward the upper boundary.

BTCUSD READY TO FLY 4200 POINTS 84830 TO 89000+++BTCUSD strong zone above only 84830
There is no resistance upto 89000
Wait for active mode
Buy above 84830................
Stoploss..........................84400....430 points
Target1..........................87000.....2170 points
Target2..........................89000.....4170+ points
Disclaimer - This level only for education purpose . Do ur own analysis
