Perfect F&P on Bitcoins daily charts (21/01/26)Bitcoin forming good chart pattern on the daily charts.
The charts is a perfect example of a Flag and Pole pattern. If the pattern completes there are chance of seeing bitcoin dipping.
Identifying the last support around 85K. Be watchful if price dips below it.
Bitcoinmarkets

BTC Market Update - Market in Compression PhaseBitcoin is currently in a corrective and consolidation phase after a strong higher-timeframe advance.
The broader structure remains intact, but momentum has slowed as price trades in a key decision zone.
🔍 Multi-Timeframe View:
Weekly: Uptrend intact, correction in progress
Daily: Balance state with overlapping candles
4H: Higher lows forming, resistance capping price → compression
📌 Key Levels:
Major Support: 85.5k – 86k
Mid Zone: 88.5k – 89k
Resistance: 91k – 92k
Major Ceiling: ~94.5k
Price holding above support keeps the broader structure constructive.
Acceptance above resistance would signal momentum returning, while rejection keeps the market range-bound.
📎 This is a waiting phase — clarity comes with expansion.
⚠️ Educational analysis only.
#BTC #Bitcoin #CryptoAnalysis #MarketStructure #PriceAction

BTC - Turned Bearish ?This unexpected longer US shutdown followed by another un expected temporary solution till Jan 2026 is causing panic in US market. These days Trump and his network moving the market as they want. And anything are possible these days by him. BTC has very strong Buyer network including ETFs, Strategy and other non stop accumulators. Its Golden time to buy Bitcoin at every dips since they have non stop flow of funds. But price drop un stoppable since margin issues cause weak hands to get liquidated. when 25X group gets liquidated then its huge sell off and it will take time to buy back the liquidity so SL kills all weak hands. But where is the Bottom. Cant predict because US shutdown has not got solution atleast for a year. Upcoming US data all expected to be slightly negative putting pressure on markets to be on sell side. Its all in the hands of Trump and his network or other banks who planned all these. I never seen a temporary solution for US shutdown in the past. At sending markets to the levels they want first big players will accumulate and then make policy move to move markets to up again.... Its sure bad news for Bitcoin Bulls planning for 130+ levels... It will come in 2026 but need to be loving and money management in SIP into Bitcoin will give rich returns in 2026

ZECUSDT - HOLDING STRONG AMID MARKET WIDE LIQUIDATIONSSymbol - ZECUSDT
CMP - 267.18
ZECUSDT has demonstrated notable resilience amid the broader cryptocurrency market downturn, which triggered over $10 billion in long position liquidations. Even in such an environment, certain assets have managed to withstand the selling pressure.
The cryptocurrency market remains gripped by panic and widespread liquidations, with Bitcoin currently testing the 100K level under intense selling pressure. However, amidst this turmoil, a few altcoins have shown relative strength - ZECUSDT being one of them as it continues to climb and test key resistance zones.
ZEC experienced a sharp decline earlier but found strong demand near the high volume node around 145 - 155. The subsequent aggressive rebound indicates the presence of solid bullish interest at these levels.
Resistance levels: 280.30, 305.65
Support levels: 242.64, 208.76
Focus remains on the 280.20 trigger zone. If the current retest does not result in a deep pullback and price consolidates near resistance, the likelihood of a breakout increases substantially. A decisive close above 280.30 - 280.50 could open the path for a rally toward 305 - 345. That said, it remains a high-risk setup, and traders are advised to exercise caution and maintain tight stoploss.

ETHFIUSDT - BULLS ARE NOT DONE YET?Symbol - ETHFIUSDT
ETHFIUSDT is undergoing a corrective phase after updating its local high at 1.938 The breakout above the 1.677 zone appears to be an attempt to initiate a distribution phase following an extended period of consolidation. The key question now is whether the bulls can sustain control above this area.
Bitcoin is also in correction mode following a false breakout of its resistance level. In this context, the broader cryptocurrency market is experiencing a temporary decline. Nevertheless, the prevailing trend remains bullish, supported by a favorable fundamental outlook. Once the current correction concludes, market growth may resume.
On the daily timeframe, ETHFIUSDT is attempting to transition into a distribution phase after approximately five to six months of consolidation. The overall trend remains upward, and following the breakout of resistance, a corrective movement toward the liquidity zone at 1.677 is developing. A false breakdown, accompanied by a shift in market imbalance and subsequent consolidation above 1.678, could stimulate renewed buyer interest - potentially leading to further price appreciation.
Resistance levels: 1.898, 1.938
Support levels: 1.677, 1.534
The chart highlights two critical support zones - 1.677 and 1.534, Sustained bullish activity above the 1.677 level may result in a rebound and continued upward movement, confirming the ongoing distribution phase. Conversely, failure to maintain this level could prompt a retest of the zone at 1.534, where a liquidity sweep may subsequently trigger a new wave of buying pressure.

BTCUSD – Short Opportunity Building 30m Chart1. Price rejected from the supply zone near 115,700–115,800, showing resistance.
2. Current structure has shifted bearish with lower highs after rejection.
3. Key intraday support stands at 115,100–115,000; a sustained break below could accelerate downside.
4. Next demand levels to watch: 114,280 and 114,116, aligning with liquidity zones.
📉 Plan:
Short entries remain valid below 115,300.
First target: 114,280
Extended target: 114,116
Invalidation above 115,800.
Recommendation: Monitor for clean bearish continuation; keep risk tight due to BTC volatility.

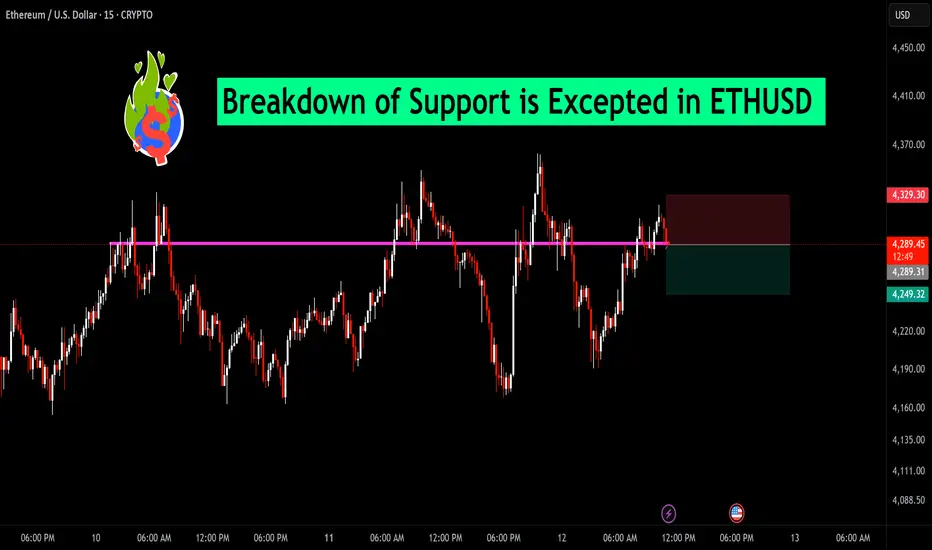
Breakdown of Support is Excepted in ETHUSD Ethereum is currently hovering just above a key horizontal support zone near $4,289. Price has tested this level multiple times, and selling pressure appears to be increasing. A decisive breakdown below this zone could trigger a short-term bearish move toward the next support near $4,249.
Traders should watch for a strong close below this support on the 15-min chart to confirm the breakdown. A tight stop above $4,329 could help manage risk for short positions.
Bias: Bearish below $4,289 | Bullish recovery only above $4,329
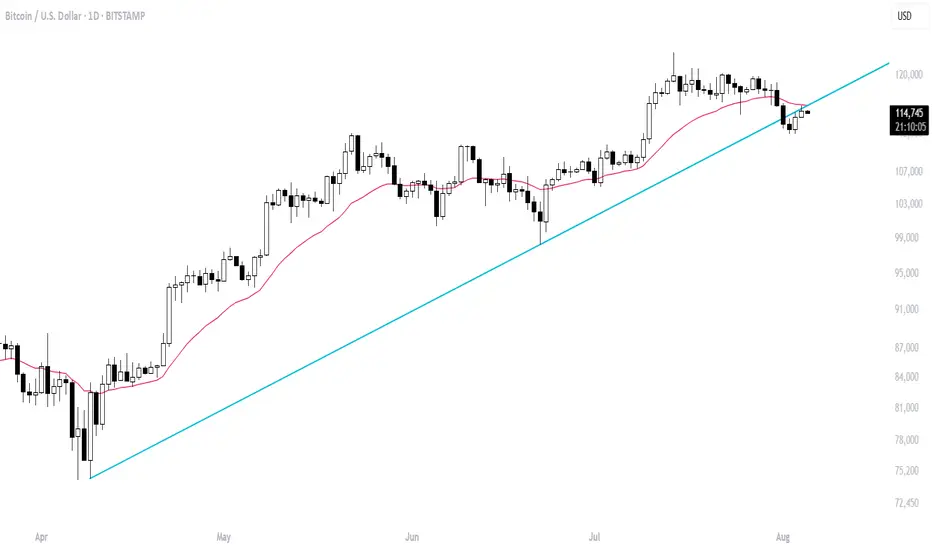
Bitcoin short-term correction over?#Bitcoin getting rejected at upward trendline (blue) as well as at 20DEMA (pink) isn't good news for bulls. For it to end its correction and resume the uptrend, BTC has to close above $115,800 on the daily chart, sooner than later.
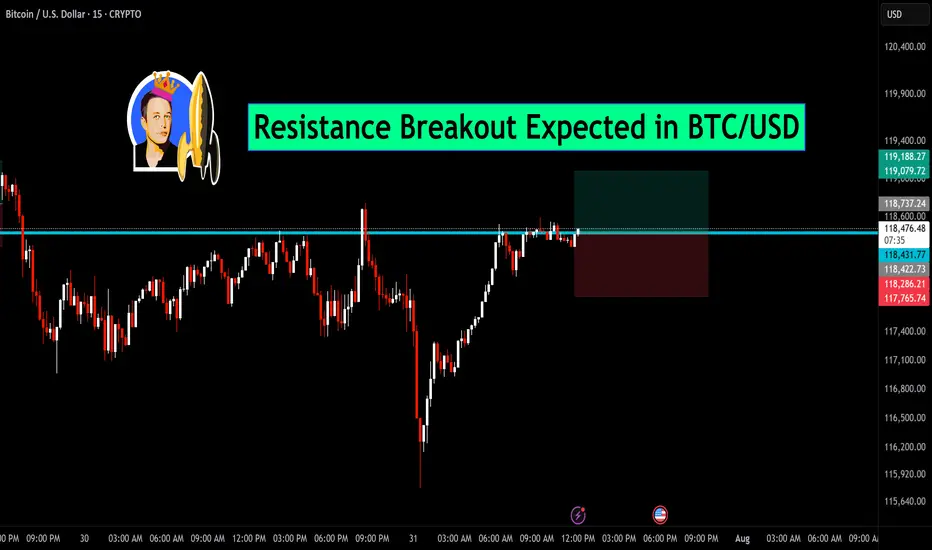
Resistance Breakout Expected in BTC/USDBitcoin is currently testing a key horizontal resistance near the $118,600 zone. After a sharp recovery from recent lows, the price is consolidating just below this level, indicating a potential breakout.
🔍 Chart Insights:
Price action forming higher lows, showing strength.
Breakout above the marked resistance may trigger a strong bullish move.
Tight consolidation near resistance suggests bulls are preparing for a push higher.
📈 Trade Setup:
Entry: Above $118,600 breakout
Target: $119,188 and beyond
Stop-loss: Below $118,200
If price sustains above resistance with volume confirmation, BTC/USD could witness fresh momentum on the upside. Stay alert for the breakout candle.
Bitcoin Price Analysis 21-22 June 2025COINBASE:BTCUSD is in downtrend.
STRATEGY:
1. If the price breaks above the upper level, consider a long position. This is supported by the higher lows formation in a smaller timeframe, suggesting a continuation of the upward trend.
2. Bearish Scenario: If the price breaks below the lower level, consider a short position, targeting potential stop-loss orders or liquidity pools created during the higher lows formation.
AREA TO AVOID
Area between the upper and lower levels due to price consolidation.

VIRTUALUSDT SHOWDOWN - SUPPORT TESTED, BREAKDOWN AHEAD?Symbol - VIRTUALUSDT
CMP - 1.6620
VIRTUALUSDT is currently consolidating within the context of a broader uptrend, forming a defined trading range. However, emerging technical signals within this range suggest the potential for a trend reversal and subsequent decline.
Bitcoin, meanwhile, appears to be entering a corrective phase following its recent rally. This development is generally unfavorable for altcoins, which often struggle to gain momentum in the absence of strength from Bitcoin. VIRTUAL is exhibiting signs of consolidation, yet there is mounting pressure within the current structure, as evidenced by the clustering of resistance levels across the range. A key risk factor is the potential breakdown of market structure through a downward exit from the ascending channel, marked by a breach of trendline support.
A renewed test of the key support level at 1.5810 could serve as a catalyst for a breakdown, potentially leading to a sharper decline. Below this threshold, there is a relatively unimpeded path toward the next significant target around 1.1780
Key Resistance Levels: 1.7200, 1.8290
Key Support Levels: 1.5810, 1.4160, 1.1780
Market participants should closely monitor the current trading range between 1.5810 and 1.8290, Persistent pressure on the support level at 1.5810, particularly in the context of a broken uptrend, constitutes a bearish signal. A decisive breach and subsequent consolidation below this level may prompt liquidation events, accelerating a move toward the fair value gap (FVG) or liquidity zone near 1.1780

NEIRO'S RESISTANCE RUN - IS A REVERSAL AROUND THE CORNER?Symbol - NEIROUSDT
Among the limited number of digital assets currently exhibiting upward momentum, NEIROUSDT stands out. However, its primary drawback lies in its position near the lower boundary of its trading range. This suggests the potential accumulation of liquidity ahead of a further decline.
NEIROUSDT is currently exhibiting signs of short-term strengthening, moving toward the upper resistance boundary of its consolidation range, while Bitcoin continues its corrective movement. A significant resistance and liquidity zone lies ahead at 0.000187, Any short-term gains could be undermined by a potential false breakout, followed by a reversal.
It is important to note that the presence of a coin near its bottom does not preclude the possibility of further downward movement. There is still room for additional decline. Presently, the price remains confined within a consolidation range amidst a broader downtrend, with no convincing signs of recovery. The last upward move was met with considerable selling pressure, leading to a sharp pullback.
Key Resistance Levels: 0.000187, 0.0002045
Key Support Levels: 0.000169, 0.000154
A false breakout above resistance, followed by a reversal toward the lower boundary of the range, is likely. Additionally, an extended consolidation near the resistance zone is not ruled out. During this phase, price may test the 0.00020 liquidity area before resuming its downward trend and potentially forming a new low.

ALCHUSDT'S CLIMB - PUMPING STRONG, RESISTANCE AHEAD!Symbol - ALCHUSDT
Despite the prevailing bearish sentiment across the cryptocurrency market, ALCHUSDT stands out as one of the few assets demonstrating relative strength. However, the sustainability of this momentum remains uncertain, particularly in the face of upcoming resistance levels.
Currently, a consolidation pattern is forming just below the breakdown threshold on the intraday timeframe, indicating a potential readiness for continued upward movement within the current distribution phase.
A confirmed breakout above the 0.1590 resistance level is expected to trigger further bullish momentum, with the next key target situated in the liquidity zone around 0.1770. However, due to the strength and significance of this intermediate resistance, a false breakout and subsequent pullback-potentially towards the 0.1590 level or the 0.5 Fibonacci retracement - should be anticipated.
Key Resistance Levels: 0.1590, 0.1770, 0.2300
Key Support Levels: 0.1516, 0.5 Fib retracement
The current distribution phase has already seen a 53% expansion since breaking above consolidation resistance. By the time price approaches the 0.1770 level, this could extend to approximately 77%. At that point, the market may have exhausted much of its bullish potential, increasing the likelihood of liquidity absorption above 0.1770 and a subsequent reversal or correction.

BITCOIN , BTCUSD
Bitcoin is currently finding support at the trend-line. Let's see whether it moves up from this support or breaks down. We should wait for the candle close this week for a clearer indication.
The stock market is unpredictable and can be influenced by large players. In recent years, we've seen significant struggles, like the COVID-19 pandemic and the Russia-Ukraine war, along with political events like Trump's actions. Although the market tends to recover quickly after crashes, it can also drop suddenly, as Newton's law suggests: what goes up fast can come down fast.
After the pandemic, many people wanted to invest in stocks, which attracted big investors and social media influencers promoting specific stocks that they wanted to sell. Many investors believe it's always good to buy the dip, but how much you invest matters. It's wise not to put all your money into the market; instead, diversify your investments across at least three different areas.
Don’t invest blindly just because the market is down. Additionally, governments often regulate the stock market in ways that benefit large investors while imposing higher taxes on ordinary people. I don’t blame the wealthy or those in power, as they were once normal people too; it's how we change with more money that can lead to different behaviors.

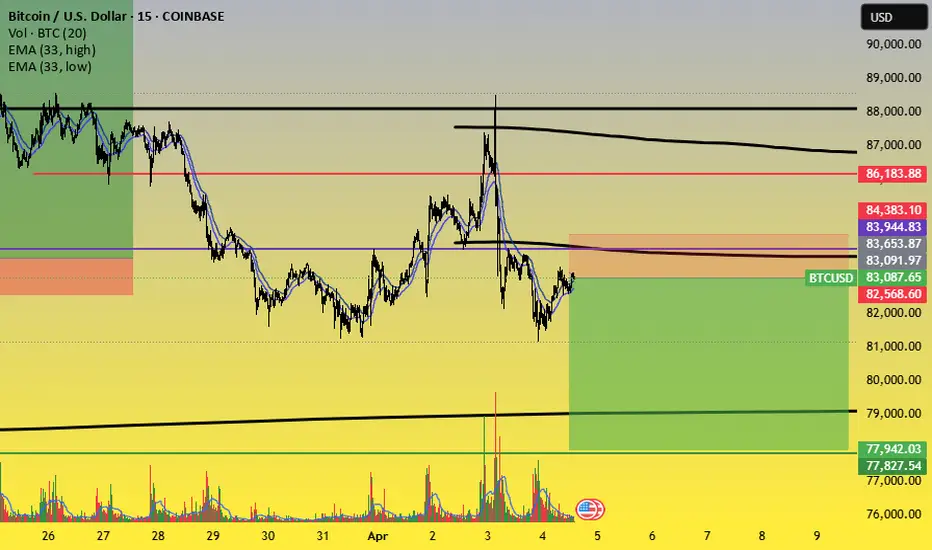
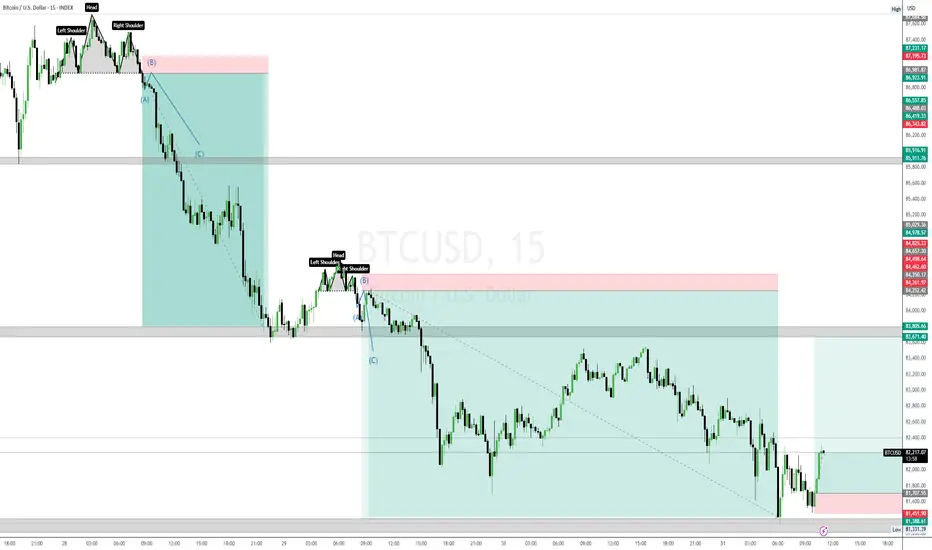
BTC Trading Recommendation (2nd Short Position)BTC Trading Recommendation (2nd Short Position)
📌 Pair: BTC/USD
📌 Timeframe: 15-Minute (M15)
📌 Exchange: (Hidden as requested)
Technical Analysis
Key Resistance Levels:
83,944 - 84,383 USD (Orange Zone)
86,183 USD (Strong Resistance)
Key Support Levels:
82,568 USD
77,827 - 77,942 USD (Strong Support)
EMA Indicators:
Price is currently hovering near EMA 33 and EMA 89, indicating a consolidation phase before the next move.
Trading Volume:
Slight increase but no clear breakout direction yet.
Trading Strategy
🔻 2nd Short BTC Recommendation: Enter a sell position when the price approaches 83,944 - 84,383 USD (minor resistance zone).
🎯 Target Prices (Take Profit - TP):
TP1: 82,568 USD
TP2: 77,827 - 77,942 USD
🚨 Stop Loss (SL):
Place SL above 84,400 USD to avoid stop-hunting.
📊 Risk-Reward Ratio (R:R) is favorable (~3:1) if price follows the plan.
⚠️ Note: Manage risk properly and observe price action at resistance zones before executing the trade.
Btc analysis 31st marchHello
It's a jayesh balar.
If you have a any "Questions"
Ask me in comment
If my analysis is helpful,
press booster bottom.
MEWUSDT - EYEING KEY LEVELS FOR A POTENTIAL DROP AHEADSymbol - MEWUSDT
MEWUSDT pair is currently in the distribution phase, testing a significant resistance and liquidity zone, where it has exhibited a false breakout. In light of the current market conditions, it is crucial to monitor several key levels, including both support and resistance.
A potential retest of the 0.00300 - 0.00312 range is likely, with the possibility of targeting another liquidity zone before MEWUSDT resumes its downward movement in alignment with the prevailing local and global market trends. These trends are characterized by a weakening Bitcoin and an overall sluggish cryptocurrency market.
Key Resistance Levels: 0.002793, 0.00300, 0.00312
Key Support Level: 0.002696
The primary support level at 0.002696 is critical, as it aims to prevent further market decline. Should the price fall below this level, there is a lack of significant support, potentially allowing for a strong move downward. A breakdown and sustained consolidation beneath the 0.002696 level could trigger a substantial impulse toward target zones around 0.00222 and 0.00200

LAYERUSDT - TIME FOR REVERSAL?Symbol - LAYERUSDT
CMP - 1.4200
LAYERUSDT is currently exhibiting a consolidation phase within an ongoing uptrend. The asset is outperforming the broader market; however, the initial reaction to the significant resistance at 1.4200 may result in a false breakout, followed by a retracement towards 1.275 or the 0.5 Fibonacci level.
Since the start of the session, LAYERUSDT has surpassed its daily Average True Range (ATR). However, upon encountering resistance, the coin may lack the momentum required for sustained upward movement. Liquidity in the vicinity of the 1.4200 level could serve to restrict price action, hindering the asset’s ability to break through this barrier on the first attempt.
At present, Bitcoin is testing its trend resistance, which could potentially lead to a reversal or continuation of its current downtrend, influencing altcoin prices accordingly.
Resistance levels: 1.4200, 1.4900
Support levels: 1.2932, 1.2747
The outcome hinges on the price's response at the 1.400 level. A sharp and distributive approach, with a high probability, is expected to result in a false breakout and a correction towards the aforementioned support levels. However, should LAYERUSDT show signs of slowing down and consolidating near 1.4000, there could be an attempt at a breakout, with further price movement dependent on the outcome of that attempt.

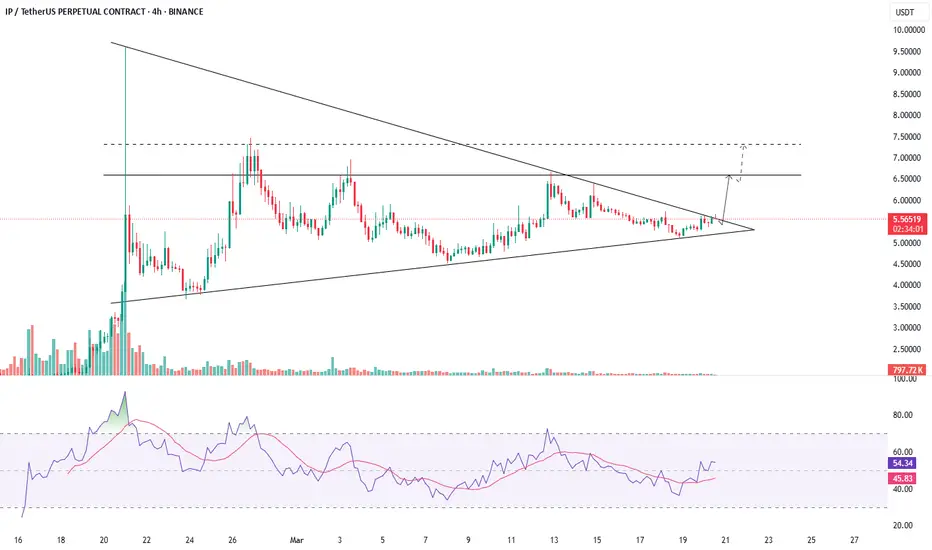
IPUSDT - POISED FOR A BREAKOUTSymbol - IPUSDT
CMP - 5.5500
IPUSDT is currently establishing favorable conditions for potential growth. Bitcoin has provided a modest boost to the market following positive developments regarding the SEC and XRP, a factor that has not gone unnoticed within the crypto community.
The IPUSDT coin has experienced an extended period of consolidation, forming a symmetrical triangle pattern. The upward trend in lows, coupled with the consolidation phase and the subsequent breakout above the triangle's resistance, signals positive indications of a potential distribution phase (the culmination of the consolidation). The key resistance level at 5.6297 remains a crucial barrier, separating the market from a more liberated zone.
Resistance levels: 5.6297, 6.6310
Support levels: 5.1160, 4.7830
Over the past few days, the price has consistently approached the triangle resistance and is building momentum for a potential breakout. Multiple intraday retests of this region demonstrate market interest in surpassing this boundary. A successful breakout above the 5.6297 resistance level, followed by consolidation above the triangle, would serve as a strong signal of readiness for upward movement.
BitCoin: A new Move about to start.BitCoin has been consolidated for the last 6-8 months in a channel shown in the graph.
As per prediction it is about to break that range and will move towards new and higher highs.
As per the chart and pattern structure in this current move it can go up to 100K easily and more above levels will be unlocked after that
SL must be 56k.
Targets 100k - 120k
Time range 8-10 months
it does not constitute and cannot replace investment advice. We therefore recommend that you contact your personal financial advisor before carrying out specific transactions and investments.

BTC#9: BTC is likely to have a correction and here's why
💎 💎 💎 Did you make a profit in the previous post #8? Like and follow the channel to follow the earliest trading plan. 💎 💎 💎
🔥 Let's plan for the next BINANCE:BTCUSDT BINANCE:BTCUSD 🔥
1️⃣ **Fundamental analysis:**
📊US consumer price inflation accelerated late last year, supporting the Fed's decision to pause interest rate cuts
🔴 Trump announces 25% tariffs on Canada and Mexico, "Trade war" begins again
🔴Trump threatens that tariffs will take effect on February 1! Influenced by Trump's tariff policy, the market's risk-off sentiment has increased significantly.
🚀 15 US states are pushing for strategic Bitcoin reserves, with Arizona and Utah temporarily leading
📌 In the past hours, the entire network has liquidated $204 million, mostly buy orders
2️⃣ **Technical analysis:**
🔹 **D Frame**: Although the price structure is still increasing, the reaction of the resistance area shows that we will have a correction.
🔹 **H4 Frame**: So the resistance area has been confirmed. The price continues to SW this area without a breakthrough, we will have an official correction. The price will find the support area below
🔹 **H1 Frame**: As you can see, the current price structure is bearish. Currently, I do not see any signs of price reversal.
3️⃣ **Trading plan:**
⛔In the previous article, you can see that this scenario was predicted. The current price reaction is very weak for the BUY side. We will have to wait at the support zone below.
✅If anyone has a good position at the resistance zone of 104k~105K, there is a basis to wait for a better profit. If anyone does not have a position, they can wait for the price structure if there is a slight recovery to the resistance zone above. Both the fundamental information and the price line support the option that there will be a deeper correction for BTC
💪 **Wish you successful trading!**
📌 For any questions, please contact directly. I am ready to answer you for free

animeusdt will take out its target to 0.0310animeusdt has a great target of 0.0310 as my logic and research. will it possible to target??

BTCUSD updated viewA resistance zone was created on BTCUSD at the 99113 - 99944 level.
Also at the same level from top to bottom one resistance trend line shows strong resistance in that area. while looking at the HNS pattern in RSI on a closing basis and both the resistance zone and trendline we need a strong closing above the zone with the trendline breaking, then we can see the bigger target in BTCUSD.
otherwise, BTCUSD will take the resistance from the trendline and zone and can see the support level again.
I already shared what-if support level breaks.
