#BANKNIFTY📊 BankNifty Wave Analysis – Is the Weekly Bull Run Ending?
BankNifty began its 5-wave impulsive structure on 10th March 2025 (weekly chart). Breaking it down into daily subwaves:
• 🚀 Wave 1: Started on 10th March, completed on 1st July 2025
• 🔄 Wave 2: A complex correction followed, retracing ~38.2%
• 📈 Wave 3: Continued the rally, forming a high on 1st December 2025
• 📉 Wave 4: A flat correction completed around Budget Day, again retracing ~38.2%
• ⚡ Wave 5: Post the US–India trade deal, the market opened gap-up but failed to sustain at the top—signaling possible exhaustion of the bull run
📉 With this setup, we may be witnessing completion of the 5th wave, opening the door for a drawdown towards 55,000 levels in BankNifty.
Bitcoinprediction

Perfect F&P on Bitcoins daily charts (21/01/26)Bitcoin forming good chart pattern on the daily charts.
The charts is a perfect example of a Flag and Pole pattern. If the pattern completes there are chance of seeing bitcoin dipping.
Identifying the last support around 85K. Be watchful if price dips below it.

Shorts active in BTcAs per priceaction it seems market taking stoploss of small sellers now may go for deep dive it's totally priceaction plz don't trade on my analysis as I am only student of charts 🙏

Bear active in BTCIt may be a opportunity to short for btc as per priceaction but everything is guess only and taking risk consider money management
I am only a learner plz don't trade on my analysis do your learn price action go for practice

BITCOIN BACK TO 109K..... Bell is ringing....Through my analysis, weekly shows firm bullish.
Geo political uncertainty all over the world because venezuela president capture.
Join this with weekly bias leads to lot of upward momentum.
Bos happened in daily timeframe with good price momentum.
So the next resistance is 97k and then to 109k.
Mark my words it will reach in one or two weeks .
The ball and bat is in perfect place , SWING is guys.....
No regrets......

BTCUSD: Holding Wave X or Slipping Lower?24 Nov 2025
27 Nov 2025
1 Dec 2025
17 Dec 2025
Bitcoin is still trading inside a falling channel, and the overall structure remains corrective. The recent bounce from lower levels lacks momentum and is overlapping, which signals consolidation rather than a trend reversal. Price continues to respect channel resistance, keeping the broader bias weak.
Wave X is acting as an important support zone around 83,822 , and as long as price holds above this level, further consolidation remains possible. This area is currently absorbing selling pressure and preventing immediate continuation to the downside.
However, a decisive breakdown below Wave X would signal that the correction is not complete. In that scenario, downside momentum is likely to expand, opening the path toward the 79,650 - 75,655 zone.
Stay Tuned
@Money_Dictators
RD :)

Wave 4 Trap Complete as Bitcoin Prepares for Final Flush6 Days Ago
3 Days Ago
1 December 2025 :
BTC moved into the expected corrective zone last week but stayed inside the falling channel, showing that wave 4 was only a temporary bounce. Buyers failed to break any key resistance, and momentum kept fading. This kept the broader outlook bearish and hinted that wave 5 was still pending.
BTC has now broken below the short-term rising structure, confirming that wave 4 topped out near the 0.786 retracement. The rejection from that zone triggered a clean shift back into the main downtrend, with price sliding toward the key 86,280 support. As long as BTC holds below the upper channel boundary, the market remains positioned for further downside, with the 1.618 extension around 79,650 emerging as the next probable target for wave 5 completion.
Note:
The rejection from the 0.786–resistance zone shows buyers failed to take control.
Wave B at 86,280 is the immediate pivot level; staying below it keeps downside pressure intact.
The next major target for wave 5 sits near the 1.618 extension around 79,650.
Stay Tuned :)
@Money_Dictators

Bitcoin - Elliott Wave Analysis - weekly TFHallo crypto traders bitcoin completed Expanding leading diagonal pattern in grand super cycle degree now in correction phase so wait for long fib ret 61.8% level then big move starts (wave 3)

Bitcoin: The 2026 Grind – Rejection Zones vs. The $130k TargetChart Analysis
Bitcoin has successfully completed a SL hunt to the downside, sweeping liquidity and finding local support. With this liquidity grab finished, the immediate bias shifts upward as price begins the "2026 Grind" toward higher structural resistance.
Using a Trend-Based Fib Extension ($55K Low - $106K High - $76.5K Retracement), we are monitoring the reaction at key overhead levels.
1. The Current Move: Testing Resistance
Following the stop hunt, price is grinding upward to test the strength of the recovery. The bulls face two critical hurdles:
Rejection Zone 1 ($95K - $97K): The 0.382 Fib level. This is the first major test for the bounce.
Rejection Zone 2 ($100K - $103K): The 0.5 Fib level. This is the "line in the sand" for the bearish case.
2. The Bearish Scenario (Rejection)
If the rally stalls and gets rejected at either of these zones, it suggests the bounce was merely corrective.
Downside Target: A failure here opens the path to $69K - $70K to fully reset the market structure.
3. The Bullish Breakout
If the momentum from the recent stop hunt is strong enough to pierce through the resistance zones:
Confirmation: A break above the $110K level flips the structure back to bullish.
Target: This opens the door for a run to the 1.0 Fib extension at $127K - $130K .
________________________________________
I built a trading journal that actually respects your privacy.
No sign-ups. No servers. No monthly fees. 100% free.
PublishNotes runs locally in your browser. You own the data, you own the backups. It helps you track your execution, bias, and behavioral mistakes without the friction of cloud apps. Download it, use it, export it. It's that simple.
Try it here: publishnotes.com
hashtag#trading hashtag#tradingjournal hashtag#privacy hashtag#notetaking

BTC Bullish Outlook: Riding the Wave to $170K in 2026CRYPTO:BTCUSD
Asset: BTC/USD
Timeframe: Weekly
Hey traders! 🚀 With Bitcoin kicking off December on a softer note around $85K, the market's digesting some Q4 turbulence, but we're eyeing a major reversal. Drawing from JPMorgan's fresh take, BTC could mirror gold's trajectory and surge to $170K within the next 6-12 months. That's an 84% upside from here—don't sleep on this!
Key Analysis:
Macro Tailwinds: BTC's negative correlation with the USD is flashing green as the dollar weakens. Pair that with its risk-on dance with stocks (watch Nasdaq for cues), and we're primed for a breakout.
Technical Setup: We've got support holding firm at the $80K psychological level—classic round-number magnet for BTC. RSI is oversold on the daily, MACD showing divergence, and options data screams "range-bound now, explosive later." Break above $90K, and it's game on toward the next roundie at $100K.
Risks: Short-term chop if stocks wobble further, but long-dated option builds suggest stability before the boom.
Trade Signal:
Entry: Long BTC/USD at $82,000 (confirmation above $80K support).
Target 1: $100,000 (short-term, ~20% gain).
Target 2: $170,000 (JPM moonshot by mid-2026).
Stop Loss: $75,000 (below key support to protect downside).
Risk/Reward: 1:3+ on the primary target. Position size: 1-2% of portfolio.
Chart snapshot: Imagine a weekly candlestick with a bullish engulfing at $80K, Fibonacci extensions pointing to $170K, and gold overlay for that JPM vibe. (Pro tip: Overlay GLD on your BTC chart for visual confirmation!)
Idea by Signal Squad
Published: December 8, 2025
What do you think, squad? Bullish breakout or more consolidation? Drop your thoughts below—let's discuss! #BTC #CryptoSignals #SignalSquad

BTCUSD - Wave 5 Decline Still Likely AheadPrevious Analysis:
BTC is approaching a critical reaction zone where the current rise looks more like a corrective push than the start of a new trend. Price is moving toward the highlighted supply region, which aligns with a potential wave 4 completion inside the descending channel. The structure from the recent low shows an internal a–b–c formation, suggesting this bounce could run into exhaustion as it enters the red zone. Unless BTC breaks out of the channel with conviction, the broader momentum still leans bearish. A rejection from this region would likely trigger the final wave 5 leg, driving price toward deeper Fibonacci levels and completing the corrective cycle before any meaningful recovery attempt can begin.
Stay Tuned!
@Money_Dictators

BTCUSD SHOWING A GOOD UP MOVE WITH 1:10 RISK REWARD BTCUSD SHOWING A GOOD UP MOVE WITH 1:10 RISK REWARD
DUE TO THESE REASON
A. its following a rectangle pattern that stocked the market
which preventing the market to move any one direction now it trying to break the strong resistant lable
B. after the break of this rectangle it will boost the market potential for break
C. also its resisting from a strong neckline the neckline also got weeker ald the price is ready to break in the outer region
all of these reason are indicating the same thing its ready for breakout BREAKOUT trading are follws good risk reward
please dont use more than one percentage of your capitalfollow risk reward and tradeing rules
that will help you to to become a bettertrader
thank you

If you ignore this than it's your choice INDEX:BTCUSD
I am also shocked
every November closed in green in Year on year based than november near to end then it means v shape bounce is ready to in 6 days
please do your own research before taking any trade.
i am not financial advisor
risk is real stay practical
please feel free to ask any questions

Bitcoin Monthly Support Test — Next Target $58,419 ?Key support sits at $81,933. A clean break and close below this zone could expose Bitcoin to a deeper retracement toward the next major support around $58,419.
However, $81,933 is also a strong monthly support level, so the market’s reaction here is critical.
Keep an eye on whether this level holds or fails — it will likely dictate the next major move.
Share your view in the comments: Do you think BTC will defend this monthly support, or are we heading lower?

BTC out of box and retest done.. going upBitcoin long position is on the way. Btc is now out of critical box expected now to get reward same like range of box. So as marked it can go upto trendline to test it and completes the range on buying side in short term then after trendline hits we need to see for next move.

If This Is Just Beginning Than End Is Danger.CRYPTO:BTCUSD
Weekly Closing Is Importance For Confirmation And If We Get Confirmation Than Follow Through Is Another Confirmation.
Channel breaking started. if we calculate channel target then around $45000 USD 💀
Please Do Your Own Research Before Talking Any Trade.
I am not finical advisor.
If you have any questions, please feel free to ask me.

Bitcoin Turn Bearish In Monthly Time frameWhat’s going on
Bitcoin slipped significantly this week, dropping into the US$90,000–96,000 range, marking roughly a 10% decline for the week.
The decline has pushed BTC to trade around 20-25% below its all-time high of US$126,200.
On-chain data shows that long-term holders (those who typically hold and not sell) have sold ~815,000 BTC in the past 30 days—the highest such volume since Jan 2024. That suggests weakening conviction among “Holders”.
What’s working against Bitcoin
Recently, Bitcoin dropped below ~US$90k marking its lowest levels in months.
The monthly technical structure shows signs of weakness.
Macro risks are elevated: policy uncertainty (e.g., interest rates) could dampen demand for risk assets.
Key Levels & Scenario
Support Level 1: ~$85,250–$80,704 marked on the chart in weekly time frame, there could be a sharper drop. till Support -1 in monthly time frame ~$70,825–$57,750
Close below $85,000 in weekly and monthly time frames opens up more downside risk.
Given the mixed signals, I'm slightly cautious/bearish for next week, expecting consolidation in the weekly time frame and downside rather than a strong rally.
If the macro/risk environment improves, upside is possible, but as of now, the risk of further decline is stronger than upside.
Disclaimer
High Risk Investment
Trading or investing in assets like crypto, equity, or commodities carries high risk and may not suit all investors.
Analysis on this channel uses recent technical data and market sentiment from web sources for informational and educational purposes only, not financial advice. Trading involves high risks, and past performance does not guarantee future results. Always conduct your own research or consult a SEBI-registered advisor before investing or trading.
This channel, Render With Me, is not responsible for any financial loss arising directly or indirectly from using or relying on this information.

BTCUSD If Btc breaks below red line then chances are high it could test below support level white line at 92000 and 88000
Disclaimer:
It's a personal view not a financial advice and I assume no responsibility and liability whatever outcome arises.

BTC - Turned Bearish ?This unexpected longer US shutdown followed by another un expected temporary solution till Jan 2026 is causing panic in US market. These days Trump and his network moving the market as they want. And anything are possible these days by him. BTC has very strong Buyer network including ETFs, Strategy and other non stop accumulators. Its Golden time to buy Bitcoin at every dips since they have non stop flow of funds. But price drop un stoppable since margin issues cause weak hands to get liquidated. when 25X group gets liquidated then its huge sell off and it will take time to buy back the liquidity so SL kills all weak hands. But where is the Bottom. Cant predict because US shutdown has not got solution atleast for a year. Upcoming US data all expected to be slightly negative putting pressure on markets to be on sell side. Its all in the hands of Trump and his network or other banks who planned all these. I never seen a temporary solution for US shutdown in the past. At sending markets to the levels they want first big players will accumulate and then make policy move to move markets to up again.... Its sure bad news for Bitcoin Bulls planning for 130+ levels... It will come in 2026 but need to be loving and money management in SIP into Bitcoin will give rich returns in 2026

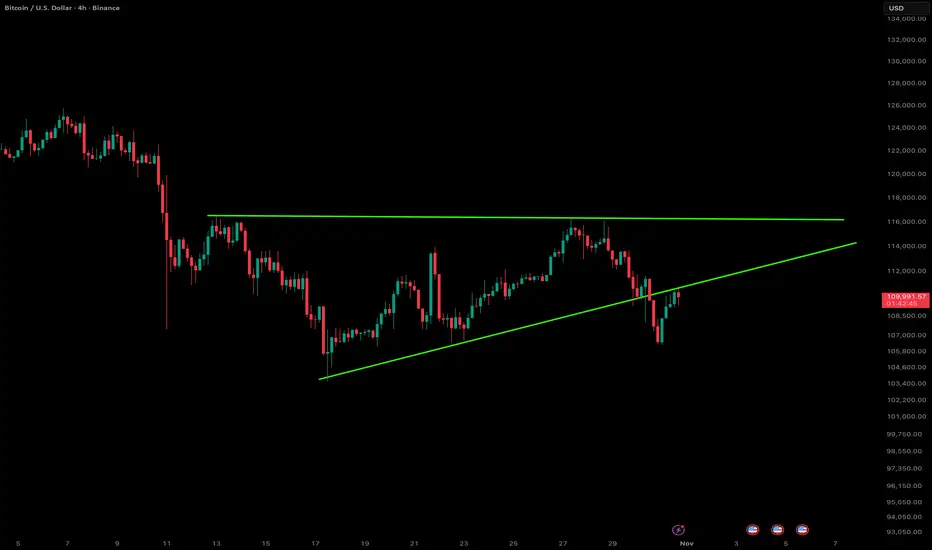
Bitcoin – Breakdown from the Ascending TriangleBitcoin just slipped below the ascending triangle support on the 4-hour chart, signaling a potential shift in short-term momentum. The structure had been forming higher lows toward the $115K resistance zone, but sellers stepped in hard near the top, breaking the trendline that’s been guiding the uptrend since mid-October.
The move comes amid broader weakness across the crypto market — BTC has shed about 3.7% this month, while altcoins like XRP and ETH are also struggling. Despite the pullback, Bitcoin still holds an impressive 18% gain for the year, so the bigger picture remains constructive.
Macro pressure seems to be weighing on sentiment — investor caution around interest rates, inflation, and the Fed’s next move is keeping volatility elevated. If upcoming data tilts toward another rate cut, we could see renewed upside momentum. But for now, price action suggests a possible retest of lower zones before bulls can re-establish control.
Overall, a clean technical breakdown in the near term, but the broader trend isn’t broken yet. Let’s see if bulls can reclaim that triangle support in the next few sessions.
DONT FORGET TO CHECK MY PROFILE BELOW 👇👇👇
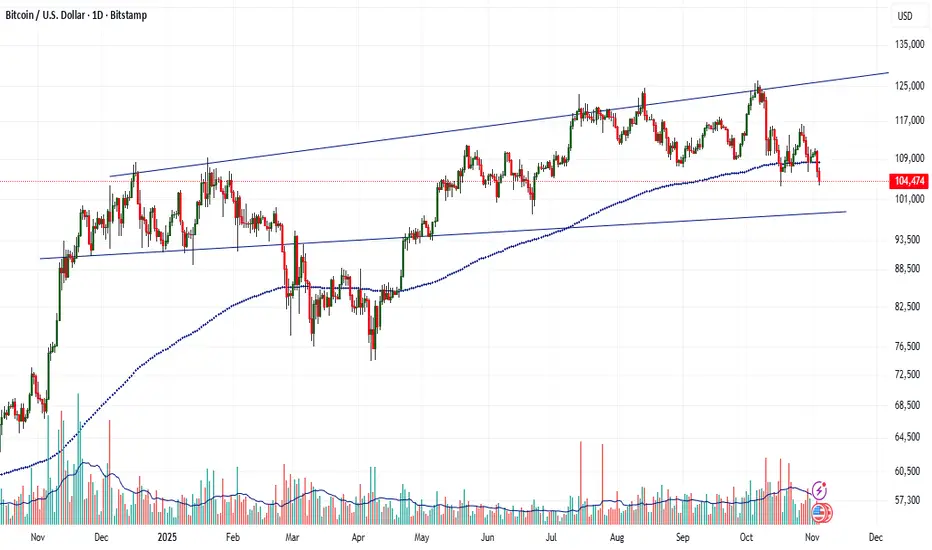
BTCUSD - RESISTANCE RETEST IN PROGRESSSymbol - BTCUSD
Bitcoin continues to consolidate beneath the previously breached ascending trendline, with no distinct signs indicating the end of the corrective phase or the emergence of strong bullish momentum. A retest of the resistance zone is currently forming.
Bitcoin is trading within a defined range between 1,11,650 & 1,06,250 At present, there are no clear bullish reversal signals, and price action suggests a corrective move toward resistance before a potential decline into the liquidity pool near 1,06,250, shaped by prior consolidation and retesting activity.
Two critical resistance zones lie ahead — 1,11,650 and 1,13,600 Resistance at 1,11,650 has been validated. However, failure to sustain rejection here may lead to a test of the upper boundary. A false breakout in that area could trigger a subsequent pullback. Overall, the cryptocurrency market remains relatively subdued, reflecting ongoing uncertainty and caution surrounding broader macro and policy factors.
Resistance levels: 1,11,650 - 1,13,600
Support levels: 1,08,650 - 1,07,375 - 1,06,250
Current price action indicates a developing consolidation phase within a localized downtrend. A confirmed breakout above 1,13,000 and subsequent consolidation above 1,13,500 would strengthen the case for a potential trend reversal. Until such confirmation emerges, a pullback from resistance into the zone of interest remains the primary expectation.

BTCUSD SHOWING A GOOD UP MOVE WITH 1:10 RISK REWARD BTCUSD SHOWING A GOOD
UP MOVE WITH 1:10 RISK REWARD
DUE TO THESE REASON
A. its following a rectangle pattern that stocked the market
which preventing the market to move any one direction now it trying to break the strong resistant lable
B. after the break of this rectangle it will boost the market potential for break
C. also its resisting from a strong neckline the neckline also got weeker ald the price is ready to break in the outer region
all of these reason are indicating the same thing its ready for breakout BREAKOUT trading are follws good risk reward
please dont use more than one percentage of your capitalfollow risk reward and tradeing rules
that will help you to to become a bettertrader
thank you
