GBPUSD IS BULLISH!!As per analysis, market is trending higher.
Two weeks before market is bullish ( gains a lot).
So last week profit booking happens( just my view only).
Now you know what will happen in bullish market after profit booking,
Yes market will go higher.
My first looking area 1.3632
Second one is 1.3747 area.
This is totally my view only , do your own analysis before taking any decision.
Market is simple, but not easy.
One more thing( I am in a long position from 1.3458)
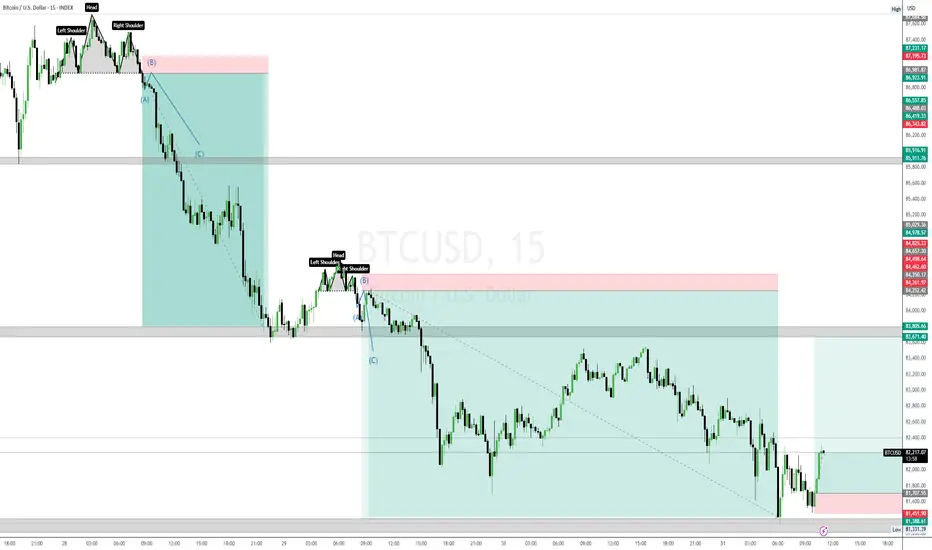
Bitcoinprediction

Bitcoin to 101.500 support ?Bitcoin continues to trade within a well-defined descending channel, respecting both the upper and lower bounds consistently. Price is currently rejecting the midline of the channel, suggesting bearish continuation. A fresh short position has been marked, with a tight stop above local structure and a projected target at the lower boundary near $101,528, offering a favorable risk-reward ratio. Until price breaks convincingly above the channel, the trend remains bearish.

PENDLEUSDT - READY TO POP?Symbol - PENDLEUSDT
PENDLEUSDT appears to be transitioning from a phase of prolonged consolidation into a potential distribution phase. The coin is currently testing a significant resistance level, the breakout of which could initiate a renewed upward movement.
The price is exhibiting strength as it attempts to breach the upper boundary of the recent range. A sustained consolidation above the key level of 4.400 would suggest bullish continuation. Supportive macro conditions particularly the ongoing bullish momentum in Bitcoin are lending strength to the altcoin market. Should this trend persist, altcoins including PENDLEUSDT may follow suit, shifting from consolidation into broader distribution.
Key Resistance Levels: 4.320, 4.400
Key Support Levels: 4.024, 3.622
Should the price confirm a breakout by holding above the critical resistance level, this would likely signal the beginning of a more aggressive upward move. In such a scenario, a potential target lies near the 4.800 level.

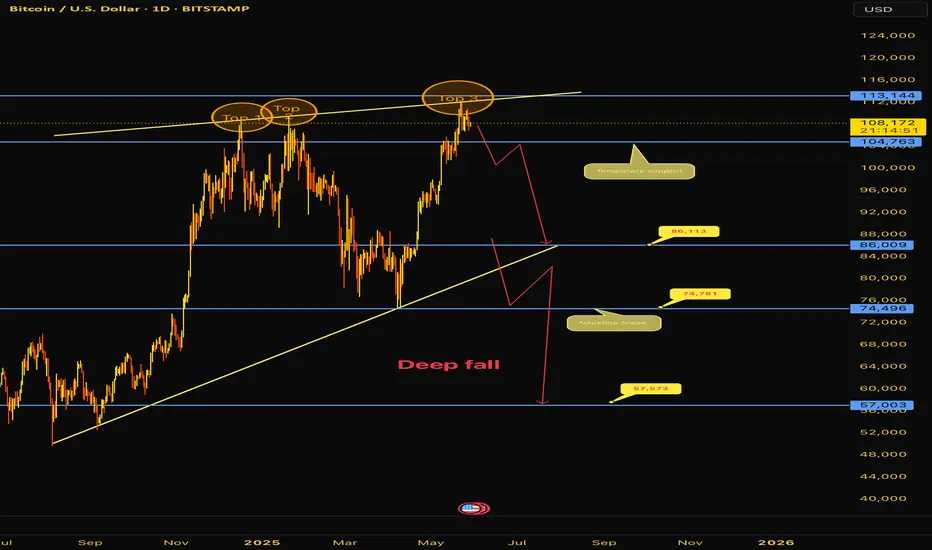
Bitcoin Ready to Collapse? Shift incoming !!Bitcoin is flashing warning signs that the euphoria may be nearing a halt. While bulls have defended every dip for months, this recent structure exposes potential systemic exhaustion and a clear top-heavy formation.
🔶 Triple Top Formation – Major Reversal Pattern
Price has formed three clear rejections near 111k to 113k failing to break this horizontal ceiling despite strong attempts:
• Top 1: Initial euphoric breakout in Q1 2025.
• Top 2: Mid-cycle rejection with lower momentum.
• Top 3: Final spike with a long upper wick, indicating selling pressure.
This isn’t just psychological resistance — this is institutional exit behavior. When a triple top aligns with bearish structure, the probabilities of reversal spike.
⸻
📐 Rising Wedge Breakdown Risk
Zooming into structure, BTC is also caught in a rising wedge, a pattern that typically precedes a sharp trend reversal when the lower trendline fails.
• This wedge began forming since the $57K low in January 2025, and has now reached terminal compression.
• Breakout attempt failed to sustain new highs, now back inside the wedge.
If price breaks down with volume, it confirms distribution at the top.
⸻
🧠 Multi-Layered Breakdown Zones
Here’s the full structure unraveling beneath:
🟡 Immediate Support (Temporary Relief):
• 104,763 is the first demand zone. However, this is weak and already being tested.
🟡 Critical Breakdown Trigger (Trendline + Horizontal Confluence):
• 86,113 aligns with wedge base and horizontal structure. Losing this is not a dip — it’s a structural breach.
🟡 Neckline of the Triple Top:
• 74,496 – this is the last defense. A breakdown here activates the full triple-top bearish target.
⸻
📉 Projected Pathway – Full Breakdown Sequence
If price fails to reclaim 113K, here’s the probable sequence:
1. Failure to hold 104K → Drop to 86K.
2. Weak bounce from 86K followed by breakdown → retest neckline at 74.5K.
3. Neckline breaks → Full triple top target opens towards 57,000–58,000 zone.
🔻 Target: 57,003 – Aligns with historical pivot from Nov 2024 and major liquidity grab.
⸻
💬 Macro Interpretation
While spot price remains above key zones, the underlying structure has flipped bearish:
• Every push higher is met with lower momentum.
• Trendline losing steam, and volume failing to confirm rallies.
• This looks like a top-heavy distribution, not accumulation.
⸻
⚠️ What to Watch Now
• Daily closes below 104K = early sign of pressure.
• Breakdown and daily close below 86K = breakdown from rising wedge.
• Neckline at 74,496 is the trap door. If this gives in, expect acceleration.
⸻
✅ Action Plan
• No fresh longs until BTC closes above 113K with conviction.
• Shorting below 104K with tight stops makes sense for intraday traders.
• Bigger positional shorts can be initiated on breakdown + retest of 86K.
• Full breakdown shorting zone activates below neckline retest.
⸻
📌 Summary:
Triple Top + Rising Wedge + Structural Failures = Recipe for Collapse.
BTC bulls need a miracle above 113K. Otherwise, price is setting up for a high-velocity drop toward 57K zone over the coming weeks.
BTC Bull Run Ending Soon?"September could mark the climax of Bitcoin’s bull rally, triggering a correction phase as smart money begins profit-taking — key levels like $74,457 and $48,888 may become attractive accumulation zones in the upcoming bear market."
Disclaimer : This content is for informational and educational purposes only and should not be considered financial or investment advice. Cryptocurrency trading involves significant risk and may not be suitable for all investors. Always do your own research (DYOR) and consult with a qualified financial advisor before making any trading decisions.

Bitcoin (BTC) Technical Analysis for the Week of May 26 - June 1#Current Price and Market Context (as of May 24, 2025):
Price: Bitcoin is trading around $103,000–$111,000, with recent consolidation near $103,000 after facing resistance at $105,000.
Market Sentiment: Bullish, with the Fear & Greed Index at 78 (Extreme Greed) and 28 technical indicators signaling buy versus 6 bearish signals.
Volatility: Bitcoin has shown increased volatility recently, with a 0.94% daily volatility estimate.
# Forecast for Next Week (May 26 - June 1, 2025)
--Bullish Scenario:
Probability: High (based on 73% bullish market sentiment and technical indicators favouring buy signals).
Price Target: $124,000–$127,000, with a potential push toward if resistance at $105,000 is decisively broken in weekly time frame
Catalysts:
Continued institutional inflows (e.g., $6.9B in U.S. spot Bitcoin ETF inflows over three weeks).
Sustained trading above key EMAs and support levels ($103,000–$106,000).
Bearish Scenario:
Probability: Moderate (due to overbought RSI and recent resistance at $105,000).
Price Target: A pullback to $100,000–$103,000, with a deeper correction possible to $95,000 if support at $103,000 fails.
-- Disclaimer --
This analysis is based on recent technical data and market sentiment from web sources and X posts. It is for informational purposes only and not financial advice. Trading involves high risks, and past performance does not guarantee future results. Always conduct your own research or consult a SEBI-registered advisor before trading.

BITCOIN - SYMMETRICAL TRIANGLE FORMING WITHIN A BULLISH TRENDSymbol - BTCUSDT
Bitcoin is consolidating. A symmetrical triangle pattern is forming within the context of a prevailing bullish trend. Based on the current technical setup, it is reasonable to interpret this consolidation as a preparatory phase for a continuation of the upward movement.
Fundamental nuances have gradually improved over recent weeks, contributing to a moderate revival in the cryptocurrency market. From a technical standpoint, the market structure on the daily chart appears constructive. Following a period of strong upward momentum, the price has entered a consolidation phase rather than showing signs of reversal. The overall market remains bullish. After approximately 2–3 weeks of consolidation, a bullish distribution pattern appears to be developing. This cycle has repeated on two previous occasions. On the daily timeframe, the presence of extended lower wicks during the consolidation phase suggests that large market participants (whales) are actively absorbing downward pressure, thereby preventing the price from entering risk zones. Accordingly, it is likely that the current consolidation could persist for a time, and there remains the possibility of a retest of the triangle’s lower boundary or even a deeper move to test the liquidity zones around 1,01,400 and 1,00,700 before resuming the upward trend.
Resistance levels: 1,03,600, 1,04,400, 1,05,000
Support levels: 1,02,500, 1,01,400, 1,00,600
A downside scenario may be considered if the price breaks through the triangle’s lower boundary and stabilizes around the 1,01,400 level, potentially forming a pre-breakdown consolidation-assuming no immediate rebound follows.
However, at present, intraday trading strategies can be considered within the range of the ongoing consolidation. A breakout to the upside and continuation of the bullish trend would likely be signaled by consolidation within the 1,03,500 to 1,05,000 range, accompanied by price compression toward the upper boundary.

Bitcoin Technical Analysis: May 10, 2025# Current Price and Market Context
Price: Approximately $103,160, based on chart at posting time.
# Market Sentiment: Bullish, with 78% of technical indicators showing bullish trends and Fear & Greed Index at 73 (Greed).
Recent Performance: Bitcoin remains resilient, trading above key moving averages after a spring correction, with a strong bullish monthly trend. It hit an all-time high of $109,114.88 on January 20, 2025, but has since consolidated.
## My view: If weekly close exceeds $105,600, expect new all-time highs of $123,930–$127,482.
# Chart for reference

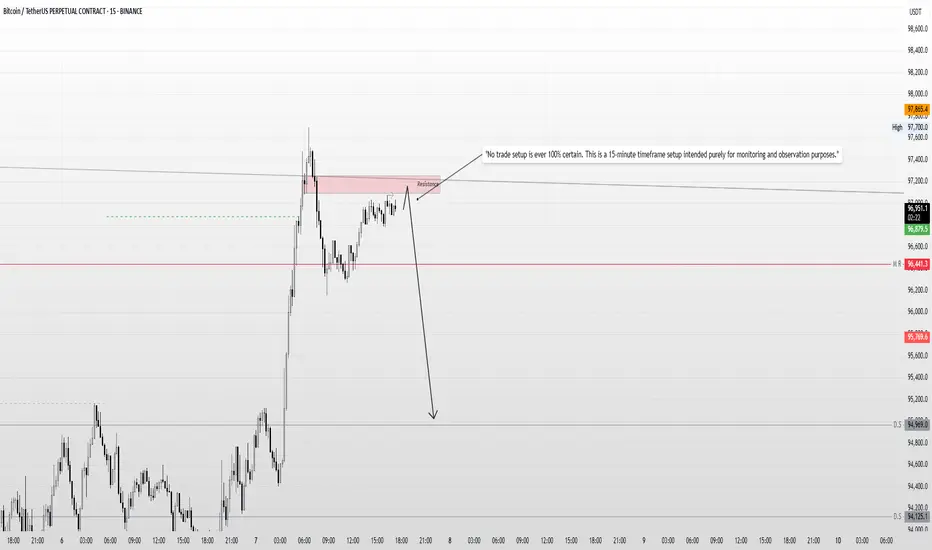
Bitcoin Intraday Bias – Liquidity Sweep & Rejection Setup"Intraday Setup: I anticipate that during the New York open, the market may sweep the liquidity around 97078, reject from the resistance zone, and potentially move lower."
"No trade setup is ever 100% certain. This is a 15-minute timeframe setup intended purely for monitoring and observation purposes."
Disclaimer: This is not financial advice. The analysis shared is for educational and informational purposes only. Please conduct your own research and consult with a licensed financial advisor before making any trading decisions. Trading involves significant risk and may not be suitable for all investors.
BITCOIN ON THE MOVE - BULLS IN CHARGE OR A TRAP AHEAD?Symbol - BTCUSD
CMP - 96000
BTCUSD has reached a new local high of 97900. The overall market structure remains constructive. However, its sustainability continues to be influenced by macroeconomic fundamentals and the performance of the S&P 500 index.
Recent gains have been supported by improvements in the US tariff landscape and the ongoing stabilization of US-China relations. Bitcoin's rally was further reinforced by the concurrent rise in the SPX 500, with which it maintains a relatively strong correlation. During the second half of this week, BTCUSD broke out of a two week consolidation phase, surpassing the resistance level at 95500 and establishing a new local high. A corrective movement is now developing within the confines of the existing upward channel.
The 95000 level represents a key liquidity and risk zone. If bullish momentum sustains above this threshold during a potential retest, the upward trend is likely to persist in the short to medium term. Conversely, a decisive break below 95000 may lead to a deeper decline toward the 92000–88000 range.
Resistance levels: 97425, 99475
Support levels: 95500, 92000
Market attention is focused on the 95500 support level, beneath which a significant liquidity pool has accumulated. Continued growth may result from a retest-induced rebound or a market imbalance favoring buyers. However, caution is warranted as upcoming economic data releases may significantly influence price action.
Important note: A return to the sell zone below 95000–95500, accompanied by an inability to sustain upward momentum, could lead to a broader correction and potential liquidation events.

Bitcoin OutLook for Next Week BTCUSDT.pMarket Outlook (BTC/USD):
I’m currently observing the ₹94,125 level on the daily timeframe. A daily candle close below this level would significantly increase the probability of Bitcoin retracing toward the imbalance zone around ₹90,000.
However, there is a key demand zone near ₹86,000, which could act as a strong support and potentially push the market back upward. This area will be crucial in determining whether the bearish momentum continues or a reversal is triggered.
Let’s see how the market reacts around the ₹94,125 level. I’ll post the next update after Monday’s daily candle closes.
Thank you for your continued support — it's truly appreciated.
BTC 97800, Red Balloon Area, Buy Above this onlySince 24 hours after breakout of 95700 zone BTC is struggling to get more attraction and halted near 97800 for a time being where weekly chart is showing higher high candles but in daily chart last 24 hours red candle is obstructing the further uprally for time being, some shorts has been built near 97800, and fresh longs only once these liquidity is squeezed else will watch this BTC Ping Pong show, downside 95000 is crucial support bed, any breach of either zone will decide the fate for next week.
Happy Trading and Investing
~10x Bulls
Courtesy: 10x Bulls (An educational platform for investors and traders to find the best investment decisions, faculty trained by ex-fund managers, such as JP Morgan Chase and Goldman Sachs)
Classic Forecast:
COINBASE:BTCUSD
$15000 to $100000 in 2021 completed in 2024.

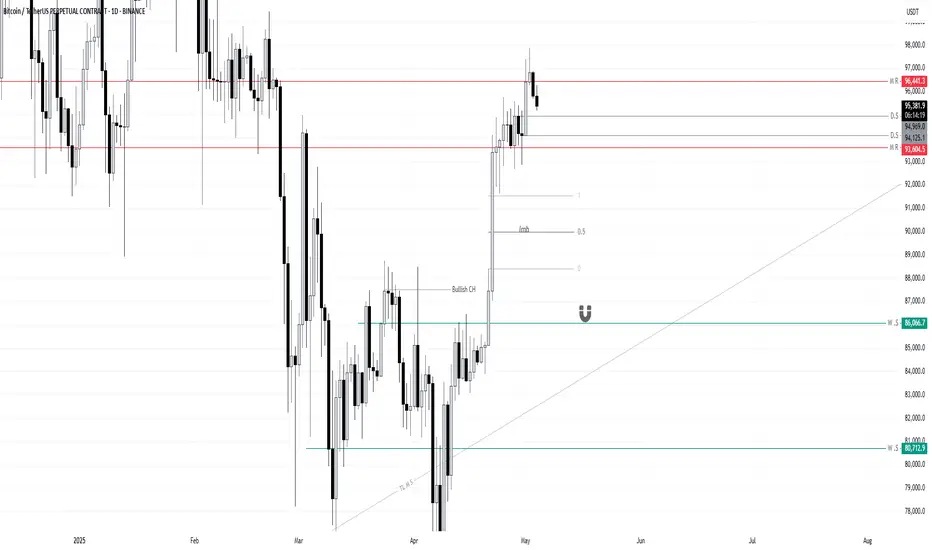
Bitcoin Wyckoff Distribution pattern Disclaimer: This is not financial advice. The following is for educational and informational purposes only.
Based on the current 1-hour timeframe, Bitcoin appears to be forming a potential Wyckoff Distribution pattern. If we see a liquidity sweep towards the upside—particularly around the 95,580 to 95,763 levels—and a subsequent bearish confirmation pattern forms on the same timeframe, we could anticipate a possible move down towards the 93,000 support zone.
Should the price fail to hold at that level, a deeper correction towards the 86,000 area could play out in the coming sessions. However, it is important to note that this scenario is valid only if a clear bearish structure forms post-liquidity sweep on the 1-hour chart.
No strategy guarantees 100% accuracy, and market conditions can change rapidly. This is merely a technical outlook and should not be construed as an investment or trading recommendation.

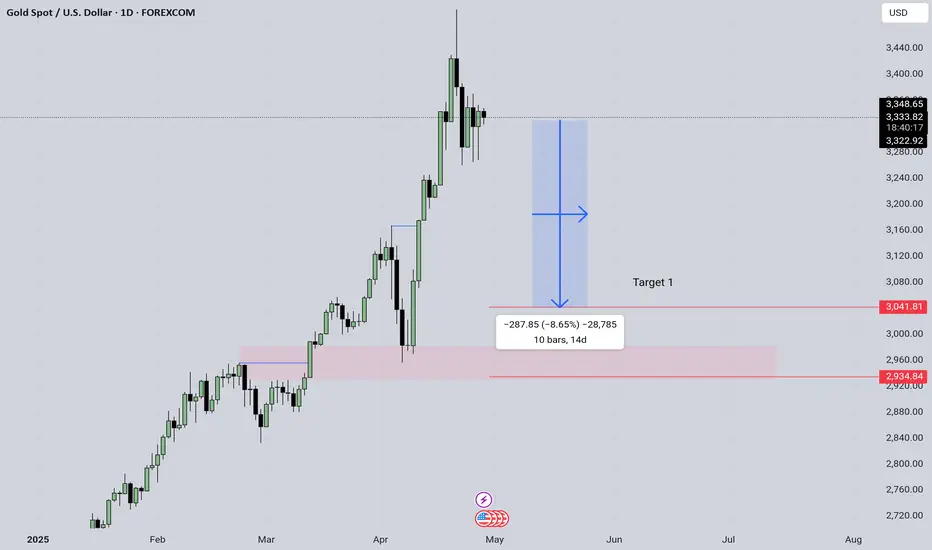
GOLD correction is coming (-8% fall)As per my analysis, gold is consolidating for days.
Even though currency move higher but gold didn't.
Trump tarriffs are cooling down , so gold will fall nearly -8% which is 3050 area.
Maybe it can fall below 3000 dollars per ounce.
Maybe next month dollar index may retrace a bit from the current fall.
So from all this information, I conclude GOLD may fall for couple of weeks.
This is for education purpose only.
Do your own research. Thanks for reading, leave your comment.
BITCOIN , BTCUSD
Bitcoin is currently finding support at the trend-line. Let's see whether it moves up from this support or breaks down. We should wait for the candle close this week for a clearer indication.
The stock market is unpredictable and can be influenced by large players. In recent years, we've seen significant struggles, like the COVID-19 pandemic and the Russia-Ukraine war, along with political events like Trump's actions. Although the market tends to recover quickly after crashes, it can also drop suddenly, as Newton's law suggests: what goes up fast can come down fast.
After the pandemic, many people wanted to invest in stocks, which attracted big investors and social media influencers promoting specific stocks that they wanted to sell. Many investors believe it's always good to buy the dip, but how much you invest matters. It's wise not to put all your money into the market; instead, diversify your investments across at least three different areas.
Don’t invest blindly just because the market is down. Additionally, governments often regulate the stock market in ways that benefit large investors while imposing higher taxes on ordinary people. I don’t blame the wealthy or those in power, as they were once normal people too; it's how we change with more money that can lead to different behaviors.

Market Turning Point? Watch 87,533.05 for a Bullish BreakoutThese 3 candle wicks indicate that the bears are no longer in strong control of the market. However, for the market to turn bullish, it is essential to close above the 87,533.05 level on the daily chart. Only after that can the market become bullish in the short term, with potential targets of 96,000 or even 102,682. But sustaining above the 87,533.05 level on a daily basis is crucial.

BITCOIN - LIKELIHOOD OF A SHORT SQUEEZE BEFORE A DOWNWARD SLIDESymbol - BTCUSD
CMP - 84540
BTCUSD continues to exhibit a bearish trend after breaking the bullish structure on the weekly timeframe. There are no discernible bullish drivers at present, and from a technical standpoint, the price is poised to approach the imbalance zone between 75K and 73K.
Recent events, such as the crypto summit and discussions surrounding crypto asset support, have failed to provide substantial backing for the market. These events have historically been followed by further market declines.
From a technical perspective, the market remains in a downtrend, indicative of a global counter-trend. This suggests that the current price movement is contrary to broader market sentiment, which aligns with typical market behavior. On a general scale, key zones of interest include 75K, 73K, and the order block between 69K and 66K.
On a more specific level, attention should be given to the nearest liquidity zones at the higher levels, which may be tested prior to any further declines. These levels are located at 86,697 and 89,397
Key Resistance levels: 85135, 86678, 89397
Key Support levels: 79987, 78173, 73512
Following the false break of the 78K support level, there has been no significant market reaction. The market appears to be consolidating within the 84-85K range, which suggests a weakening of buying interest. Prior to any further downward movement, there may be a short squeeze within the identified liquidity zones, potentially leading to an additional decline.

BTC - 3rd April 2025 At Support now - Good to buy long qty nowBTC looks good to buy long qty at previous support zone of 82200 to 81300 zone. In 2 days US Govt going to announce how much crypto they have now and what they did last few days after announcing strategic reserve. At least for again 88 or 89 K levels looks possible from there. By next week or this april month all tax fears will fade. And good change for this weekend NFP and other data could take importance for new trend. Use this view for educational purpose and consult ur advisor or take your own decision for taking trades.

Btc analysis 31st marchHello
It's a jayesh balar.
If you have a any "Questions"
Ask me in comment
If my analysis is helpful,
press booster bottom.
Bitcoin - Buy for Target 90 KBitcoin is showing bullish pattern and right now taking support at key technical level from where its expected to move up for next target of 90K. view are shared well in advance or in quick mode before waiting for confirmation which will delay the chart and good move will be missed. Price should hold this current support area of 83600 to 83700 area and failing which this view will be cancelled. use this view for educational purpose or to take your own decision and this is not a financial advice. Market is big and like many i am also trying my best to predict the next price move and to share my view with others. Likes, comments are welcome. Thanks

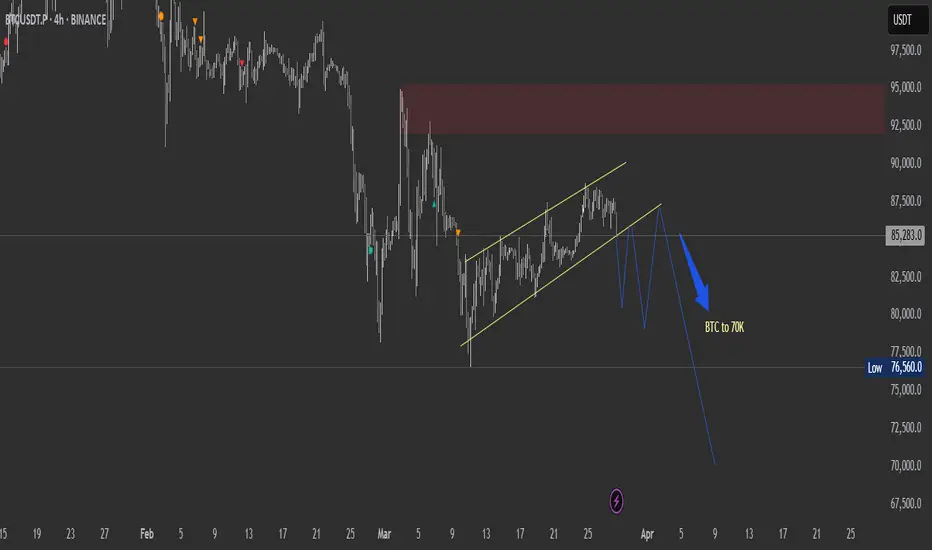
BTC to touch 70K if it breaksdown from this zoneTechnical analysis on the 4-hour chart suggests forming a bearish flag pattern—a continuation pattern that typically indicates a pause before the prevailing downtrend resumes.
If the current bearish flag pattern breaks down, Bitcoin's price could potentially decline to around $70,000. Such projections are based on technical analyses that consider factors like weak support levels and historical price movements.
BTC - 28th march TP - 89200 cup and handle BTC - 28th march TP - 89200 cup and handle pattern. Trend is Bullish.

Bitcoin - BUY for Targets - 90, 92 & 95KIn chart, price has given breakout of immediate resistance line and retested and price moving up. price move clearly indicating bullish and up move. Fib Levels and resistance lines indicating first target at 90K and on breakout possibility of 92 and 95 K as per fib levels. But first move towards 90K is visible in chart. Other Cryptos - ETH and SOL super bullish after good accumulation clearly indicating up move. Hope and wish this move is quicker !!!!
