When to Buy This Bitcoin Dip - My Technical Take on current PAOn BTC ,Yesterday's bounce is worth noting, but I'm approaching it with caution. The recently broken support trendline (now visible as a diagonal resistance) will likely act as resistance in the 89-91K zone, also we have a Horizontal resistance at 83-85K which is previous support now becomes resistance .
For potential entries, I'm watching two key scenarios:
Bullish Case 1: If BTC can reclaim and close above the broken trendline (89-91K), it would suggest the breakdown was a fakeout. This could set up a potential move back toward previous highs.
Bullish Case 2: If price continues lower to the 73K major support zone (marked by the green rectangle), this could provide an excellent buying opportunity with a favorable risk/reward ratio. A strong bounce from this level could signal the end of the correction and the start of a new uptrend.
Bitcoinprediction

BitCoin: A new Move about to start.BitCoin has been consolidated for the last 6-8 months in a channel shown in the graph.
As per prediction it is about to break that range and will move towards new and higher highs.
As per the chart and pattern structure in this current move it can go up to 100K easily and more above levels will be unlocked after that
SL must be 56k.
Targets 100k - 120k
Time range 8-10 months
it does not constitute and cannot replace investment advice. We therefore recommend that you contact your personal financial advisor before carrying out specific transactions and investments.

BTC - Triangle or Wedge - Bullish?2 views are there. Ascending Triangle - Bullish and Rising Wedge - Bearish. Price is making HL and never closed even once below previous HL indicating price is in Bullish trend. Weekend price bounced with huge volume and 85 to be watched today. if its taken with strong green bars then price will fly upside. view changes if previous HL is broken un till then buy the dips is the safe trade. But in 2025 and later its going to see new ATH as we have new buyer US Govt forming strategic reserve and not to sell from govt side. Investors are having Golden opportunity to invest and hold for few weeks to months to see higher levels for Bitcoin

Bitcoin - At Neckline 15th MarchPrice is testing neckline of head and shoulder. Market is divided and not one sided as fear of 77K is still in market. But price at neckline few taking bullish view. Buy only if price move above neckline zone and in my view right now price could be trapping the late bulls. Sell once break out fails as price move drift down from neckline zone. US policy on Stablecoin making all crypto bearish and Bitcoin on top of strategic reserve news price could test lower level again as no one know how much is being bought on daily basis right now by US Govt.

BTC - M2 Bitcoin seems to be lining up with the M2 (Global Money Supply) at a 105 day offset. This could mean another leg higher for Bitcoin and crypto with a potential blast off May 6th. It looks like we can get a bounce over the next few days as well if this plays out!

Nifty 22900 confirm!!!!!!!!!Last week I share I view, you can go and check out.
It's moving towards 22900 which 50% Fibonacci level.
For me today first one hour is pretty bullish so I anticipate that candle low can't be taken out.
So place stoploss at there and target 22900.
This is my trade stoploss and target.
Learn to trade by yourself is better for you.
Leave a comment.if you like.

BitcoinBitcoin rising from $85,189 to $88,000 today implies an anticipated increase of about 3.3%. Given the current market conditions and recent price movements, such a rise is within the realm of possibility, though it would require a reversal of the current downward trend.
It's important to note that Bitcoin's price has experienced significant fluctuations recently. Following President Donald Trump's announcement of a U.S. strategic crypto reserve, Bitcoin's value surged by over 11%, reaching a high of $95,136. However, it remains below its record high of $109,135 achieved in January 2025.

BTC - Support and Resistance as on 7th marchIn cart green and red lines indicating support and resistance. US President clearly said Do not Sell your Bitcoin. Even though he didnt mention how much will be purchased etc but we have a new Govt going to form a strategic reserve with spending tax money so it could be slow to see banana spikes but I think its going to be Bullish for BTC

Bitcoin showing weakness. It may test 76076Bitcoin chart is weak now. weakly RSI below 60 MACD also negative. Double top pattern form and correction showing. As per chart it may test 76076 soon. It can short on any bounce up to 92000.
These is Neckline place near 76076 of Inverse H&S pattern. It would be retest of neckline.

BTC - 5th march - chart pattern target 94400As per the chart pattern we can see short term target as 94400 and in 2 days we have US Crypto summit. I think mostly it will move up rather than fall. By now it must have fallen and its not happening so that's why i think price is willing to move up now
BTC - Buy again for Target of 98-100KThis correction is excellent re test of support of Support and once again expecting bounce for target of 98 or 100K. RSI is over sold at the breakout level indicating a good buy level. having 7th march - Bitcoin summit as double support I only expect price to rise again ....

M2 Money Supply 45 Day adjusted - BTCM2 Money Supply 45 Day adjusted BULLISH!!!!! If you adjust the M2 money supply by 45 days, it can possibly predict the future price action of Bitcoin and crypto.

Now It's Time to Pump the bitcoin.Bitcoin exactly touch the lower trendline and pumping back. It might pump back from this and very soon touch back 1,00,000 dollar milestone.

Bitcoin exactly dumping as I predict earlier.Bitcoin is exactly following the dump path as i predict before. Bitcoin might fall to 70,000 support very soon.

Ratio Chart of Gold/Bitcoin Breaking OutAs the bitcoin drops and gold is hovering around ATH, the ratio chart jumped and broke out. Follow up price action is key.

BTC - Good Buy at 91KBTC is different from all other coins and Its Buy level for BTC at 91K. Short Sellers will close before monthly expiry. BTC is sure Bullish only ... once resistance line is broken it will give banana spike this month or next month as per 4 year cycle...

Bitcoin - Bullish and strong Buy - Target 104KMultiple times in my previous charts i have said price below 97K is seeing buying by big players. Which is very very clear in chart with multi month and week support visible in chart. Any price below 97K is being bought by big players in US and these days outside US as well. Multiple people clearly pointed out the money flow into Bitcoin which is visible in other indicators. only because of long weekend price is sideways to bearish in short term which is cleverly accumulated by big players. I am expecting price above 100K in coming days to test the previous strong resistance above 104K for now.

Bitcoin Technical Analysis - Monthly#Elliottwave analysis for #Bitcoin ( CRYPTOCAP:BTC ) provides a framework to understand potential price movements based on past patterns. However, given the #Crypto market's unique characteristics, it should be used in conjunction with other analytical tools. The current analyses suggests optimism for continued growth, but with caution for potential corrections or consolidations before reaching new highs.
Hear is a Char for your reference

As I told The bitcoin starting Bear rally nowIn previous posts i alert about the upcoming mega dump and here's is the result

BITCOIN - Breakout and Monring star candle near support lineBitcoin price breakout the orange color trendline and it formed morning star like candle structure at 4 hour timeframe.

BTC futures live analysis for 16 jan 2025BTC futures chart creating head and shoulder pattern & break down is expected.
But Overview will be changed if price breaks & sustain above resistance sharp Upmove will b expected

Bitcoin Price Analysis: Key Zones to Watch on the 4-Hour ChartWhat is Happening in the Chart?
1. Resistance and Supply Zone (Order Block): Bitcoin is approaching a significant bearish order block (red zone) near the $100,000 mark. This area represents resistance where sellers may take control, pushing the price downward.
2. Potential Retracement: Before continuing its upward trend, Bitcoin may retrace to fill the fair value gap (FVG) and test the 0.5-0.618 Fibonacci retracement levels. These zones are historically strong areas for buyers to re-enter the market.
3. Support and Demand Zone: The bullish order block (green zone) near $92,000 aligns with the retracement zone. This is where Bitcoin might find strong support before resuming its upward trajectory.
Outlook for BTC/USDT
The chart predicts a potential pullback to $92,000-$95,000, followed by a bullish rally aiming to break through resistance at $100,000. If Bitcoin clears the bearish OB, the price could target new highs, potentially surpassing $105,000.
Key Levels to Watch:
Resistance: $100,000 (Bearish OB)
Support: $92,000-$95,000 (Bullish OB and Fibonacci zone)
---
Disclaimer:
This analysis is for informational purposes only and does not constitute financial advice. Cryptocurrency markets are highly volatile, and trading involves significant risks. Always conduct your own research or consult with a financial advisor before making any trading decisions.

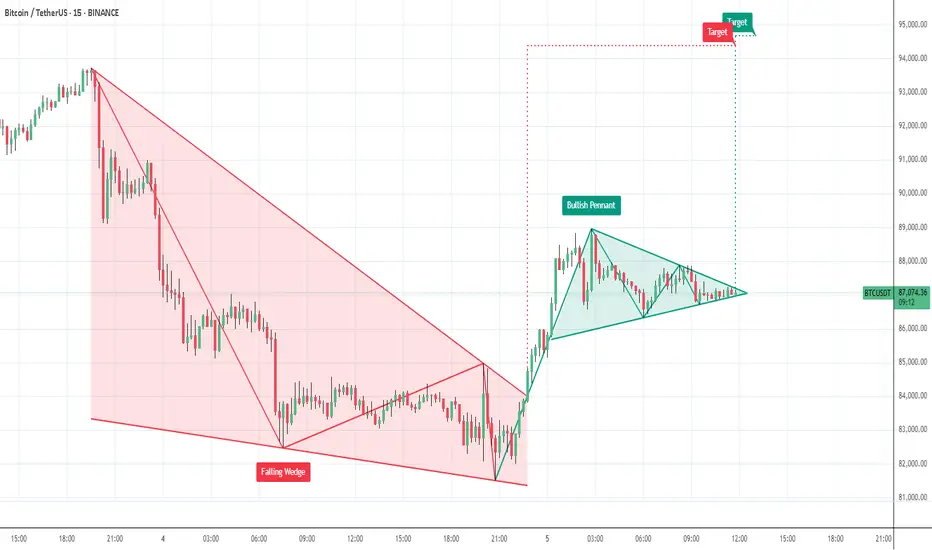
BTC buying opportunity with small SLBTC has recently given a great move towards the up side . Looking at this move, there is a high chance of buying from here. Here the stop loss is small but the target is very big, so it will be fun to plan this trade.
