BTC - At Support once againAfter touching earlier predicted first target of 102 price has fallen more than expected and holding at previous proven support levels. In my view BTC is once again at support and some fresh buying or accumulation is visible. For whatever reason price could dance for big players to buy more at support levels. Its popular idea to buy back whatever was partially booked at 102 levels. we cannot avoid this and we might see partial selling above 102K again and buying below 97K. Higher the price move up most will keep booking profits and more the price move low more buying is the trend now. Jan is the month we are waiting for banana spike to take price to 125 or above. Hope it happens once new president takes charge in office. As days near to this even I expect more bullish move in BTC. I do not see WW3 in Jan 2025.
Bitcoinprediction

Bitcoin chart updateBitcoin now at resistance level
If level break we can see good move at upside
Otherwise again going down

BTC - At Strong SupportBTC in news world wide and being moved up and down with each one's opinion and risk taking or profit booking needs. Yearend or month end along with holiday season impacted BTC. while I agree BTC is yet to give the parabolic or banana spike which was seen every 4 years and now is the time for that. Charts are discussed worldwide on one side and its constantly accumulated by people who know why BTC is better than Gold now and in coming days. In my chart two red lines are talked as bullish flag and break of that was called bearish by few and weak hands sold it causing slowness in absorption by people in need of BTC. At the same time BTC is seeing volume at support lines marked in green. Even in 5 or 15 minutes we can clearly see increased volume at which BTC is testing its support for 5th time. Earlier mentioned megaphone or loudspeaker patter didnt give 5 wave up move due to few selling at the bottom of bull flag area. The black line is the point of control of the complete price move seen last 2+ months. In my view levels below the POC - the black line is some kind of buying levels and above the black line is only selling area or profit booking. In my view below POC is accumulation going on by big players. with new Govt in US in Jan and as per 4 year cycle seeing parabolic spike is expected any time in Jan 2025. This is the time to hold tight and buy as much at every green levels support levels mentioned. we cant stop buying or selling of ETFs impacting money flow and supply & demand of BTC. actually smaller volume in the support could be either less supply or demand as well. Any big hand with new ETFs as talked with vivek or any other company going to give bigger parabolic up move. HongKong Fed or Govt and many such countries accumulating BTC making is better than GOLD to be bought, accumulated for 200K or higher in 2025. Happy New Year to all my dear friends. BTC will make everyone richer in fiat currency.

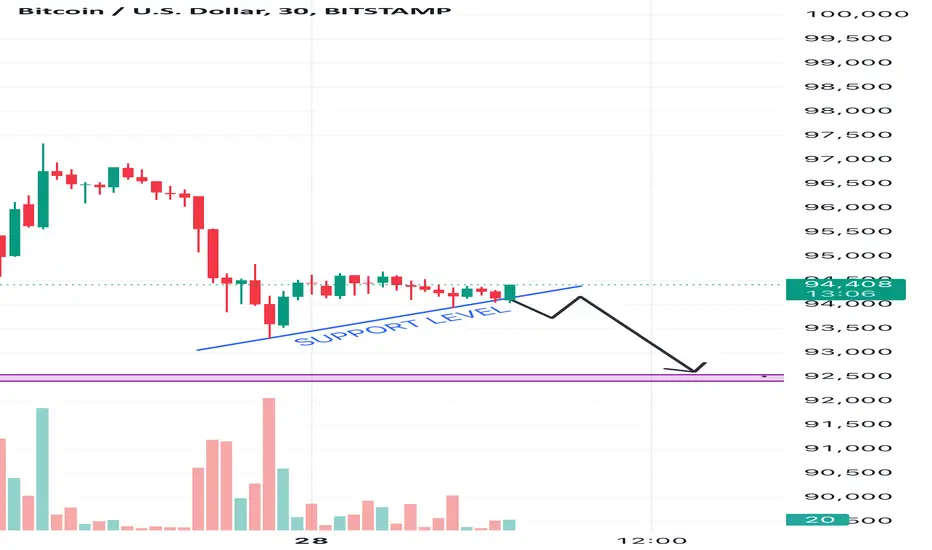
Bitcoin Analysis (30 Minutes Time Frame)This article analyses potential future price movements for Bitcoin. My analysis indicates that a breach of the $94,000 support level would likely trigger a downward trend, with the next support level anticipated at $92,500.
Here is the explanation for the analysis:
1. Support Level at $94,000:
• The upward-sloping blue line indicates a short-term support level, formed as the price previously found stability at or above this level. This trendline acts as a cushion, where buyers typically step in to prevent further decline.
•A breach below this support would signify that selling pressure has overwhelmed buying interest, breaking the psychological and technical barrier.
2. Trend Formation:
• The chart shows a consolidation pattern near the support level. This suggests market indecision, where price movement could either rebound upward or break downward.
• The downward black arrow on the chart indicates your expectation of a breakdown, based on weakening momentum and lower highs.
3. Volume Analysis:
• The declining volume bars in recent candles suggest reduced buying interest. This often precedes a breakdown, as sellers gain control of the market.
4. Next Support at $92,500:
• The purple line at $92,500 represents the next significant support level, where the price has historically found stability. If $94,000 is broken, sellers are likely to push the price toward this level, as buyers may regroup there to counter the bearish trend.
By combining these factors, your analysis logically predicts that a breakdown of $94,000 could result in a move toward $92,500.
Bitcoin - testing Support again at 93KBTC is still in megaphone pattern and once again testing the lower side of the pattern for confirmation of the support. if this second time holds good chances of BTC to make more upside moves Bitcoin and all other cryptos are very volatile, risky and great profit giving asset to be bought for short, medium or long term great profits. For trading one need to have enough margins to handle any volatility. For trading use only 40% for taking positions and use 60% to hold for any volatile movements.

BTCUSD SHOWING A GOOD UP MOVE WITH 1:6 RISK REWARD BTCUSD SHOWING A GOOD
UP MOVE WITH 1:6 RISK REWARD
DUE TO THESE REASON
A. its following a rectangle pattern that stocked the market
which preventing the market to move any one direction now it trying to break the strong resistant lable
B. after the break of this rectangle it will boost the market potential for break
C. also its resisting from a strong neckline the neckline also got weeker ald the price is ready to break in the outer region
all of these reason are indicating the same thing its ready for breakout BREAKOUT trading are follws good risk reward
please dont use more than one percentage of your capitalfollow risk reward and tradeing rules
that will help you to to become a bettertrader
thank you

BitCoin USDT Spot Chart H&S expectedBTC might form a Head and Shoulder pattern on 30 min TF. Time will tell if this pattern will be completed and broken down. Its too early to tell now. Its just an analysis for educational purpose. Not a buy or sell recommendation.

Bitcoin Next Target 107,000 USD, Expected Trendline Breakout Bitcoin definitely going to reach the Trendline, so the Target is around 107,000 USD or more. And Expected Breakout above the Trendline.
I want to help People Make Profit all over the World.
My Bitcoin Navigation :
1. Reached 0.5 Fibonacci Retracement.
2. Breakout the Channel Pattern.
3. Reached Channel Top Target.

BTCUSD SHOWING A GOOD UP MOVE WITH 1:8 RISK REWARDBTCUSD SHOWING A GOOD
UP MOVE WITH 1:8 RISK REWARD
DUE TO THESE REASON
A. its following a rectangle pattern that stocked the market
which preventing the market to move any one direction now it trying to break the strong resistant lable
B. after the break of this rectangle it will boost the market potential for break
C. also its resisting from a strong neckline the neckline also got weeker ald the price is ready to break in the outer region
all of these reason are indicating the same thing its ready for breakout BREAKOUT trading are follws good risk reward
please dont use more than one percentage of your capitalfollow risk reward and tradeing rules
that will help you to to become a bettertrader
thank you

Bitcoin chart updateBitcoin in range
For long and short entry wait for break out
If range break you can plan your entry
Otherwise ignore because of Sunday low volume

BTCUSD/BITCOIN 1D SELL LIMIT PROJECTION 14.11.24Reason For Bearish Setup
1.RisingWedge Pattern Formed
2. Obet previous ATH & Trendline Resistance


Bitcoin's Recent Surge and Potential OutlookBitcoin has experienced a significant surge in recent days, breaking through the $100,000 mark. This bullish momentum is evident on the daily chart, with the price forming higher highs and higher lows, a classic sign of an uptrend.
Potential Scenarios:
Continued Upward Momentum: If the current bullish trend persists, Bitcoin could continue to rally towards new all-time highs. Key resistance levels to watch include the psychological $110,000 and $120,000 levels.
Short-Term Correction: Given the overbought conditions, a short-term pullback to retest is possible. However, this could provide a buying opportunity for long-term investors.
Trading Strategies:
Long-Term Investors: Continue to hold Bitcoin and consider buying additional positions on any dips.
Short-Term Traders: Be cautious and consider taking profits on existing positions. If a pullback occurs, look for buying opportunities near key support levels.
Important Considerations:
Volatility: Bitcoin is a highly volatile asset, and price swings can be significant.
Market Sentiment: Positive news and developments in the cryptocurrency industry can fuel further price increases.
Regulatory Environment: Changes in regulations can impact the price of Bitcoin.

BITCOIN SHOWING A GOOD UP MOVE WITH 1:7 RISK REWARD BITCOIN SHOWING A GOOD UP MOVE WITH 1:7 RISK REWARD
DUE TO THESE REASON
A. its following a rectangle pattern that stocked the market
which preventing the market to move any one direction now it trying to break the strong resistant lable
B. after the break of this rectangle it will boost the market potential for break
C. also its resisting from a strong neckline the neckline also got weeker ald the price is ready to break in the outer region
all of these reason are indicating the same thing its ready for breakout BREAKOUT trading are follws good risk reward
please dont use more than one percentage of your capitalfollow risk reward and tradeing rules
that will help you to to become a bettertrader
thank you

This could be some possible scenario for BTCThis is the idea I am looking for BTC in the coming weeks. No specific entry points just the idea of the possible path. Been away from the market for so long going to study more.
#BTC #Crypto #USDT

BTCUSD SHOWING A GOOD DOWN MOVE WITH 1:10 RISK REWARDBTCUSD SHOWING A GOOD DOWN MOVE WITH 1:10 RISK REWARD
DUE TO THESE REASON
A. its following a rectangle pattern that stocked the market
which preventing the market to move any one direction now it trying to break the strong resistant lable
B. after the break of this rectangle it will boost the market potential for break
C. also its resisting from a strong neckline the neckline also got weeker ald the price is ready to break in the outer region
all of these reason are indicating the same thing its ready for breakout BREAKOUT trading are follws good risk reward
please dont use more than one percentage of your capitalfollow risk reward and tradeing rules
that will help you to to become a bettertrader
thank you

BTCUSD/BITCOIN 1H BUY PROJECTION 23.11.24Reason for Bitcoin Bullish
One big reason Bitcoin's price has gone up is because institutional demand continues to rise.. They're putting a lot of money into Bitcoin, which makes it more trustworthy. For example, MicroStrategy has bought a lot of Bitcoin and made a good profit as its value has increased. The way the market works also help

BTCUSD SHOWING A GOOD UP MOVE WITH 1:7 RISK REWARDBTCUSD SHOWING A GOOD D
UP MOVE WITH 1:7 RISK REWARD
DUE TO THESE REASON
A. its following a rectangle pattern that stocked the market
which preventing the market to move any one direction now it trying to break the strong resistant lable
B. after the break of this rectangle it will boost the market potential for break
C. also its resisting from a strong neckline the neckline also got weeker ald the price is ready to break in the outer region
all of these reason are indicating the same thing its ready for breakout BREAKOUT trading are follws good risk reward
please dont use more than one percentage of your capitalfollow risk reward and tradeing rules
that will help you to to become a bettertrader
thank you

GBPUSD MAYBE SELL!!!!!!I am looking to take a sell from here .
Place entry at fvg ,exit at weekly ob ( or else ) RR 1:3.
Learn to trade by yourself.

GOLD BUY!!!!!!!Just look for longs on gold.
Try your models on long today until price reach 50 or 60%.
After price reach those area just stop and watch what will happen.
Learn to trade by yourself is more important.
Good luck.

Bitcoin Analysis and Trading Levels for 19th November 2024Bitcoin has been consolidating in the range of 85,100 to 93,500 for the last seven trading sessions. A breakout on either side could lead to a potential move of 7,000 to 10,000 points.
Trading Levels (1-Hour Candle):
Buy Above: 92,700 (Enter a buy position if the 1-hour candle closes above this level, confirming a bullish breakout.)
Sell Below: 88,700 (Enter a sell position if the 1-hour candle closes below this level, confirming a bearish breakout.)
Key Support and Resistance Levels:
Resistance Levels:
93,500 (Immediate resistance and upper boundary of the consolidation range.)
95,000 – 96,200 (Potential upside target zone post-breakout.)
100,000 (Psychological level and extended bullish target.)
Support Levels:
89,000 (Intermediate support near the sell trigger.)
85,100 (Lower boundary of the consolidation range.)
82,000 – 81,000 (Extended downside target post-breakdown.)
Potential Move on Breakout (1-Hour Candle):
Upside: A sustained breakout above 93,500 could lead to a move toward 100,000.
Downside: A breakdown below 85,100 could trigger a fall toward 81,000 or lower.
Trading Tips:
Wait for Confirmation: Ensure that the 1-hour candle closes firmly above or below the breakout levels before initiating trades.
Book Profits Regularly: Secure profits at key resistance or support levels to manage risk.
Use Trailing Stop-Loss: Adjust your stop-loss as the trade progresses to protect profits while following the trend.
Monitor Volumes: A breakout with high trading volume often confirms the validity of the move.
Disclaimer:
The trading levels and analysis are based on technical indicators and the 1-hour candle chart. This information is provided for educational and informational purposes only and does not constitute financial or trading advice.
Risk Management Guidelines:
Always use appropriate risk management techniques, such as stop-loss orders and position sizing.
Cryptocurrency markets are highly volatile. Be prepared for rapid price fluctuations.
Stay updated with relevant news and macroeconomic factors affecting Bitcoin.
Risk Disclosure:
Trading cryptocurrencies carries a significant risk of financial loss and may not be suitable for all investors. Past performance is not indicative of future results. Always consult a licensed financial advisor for personalized advice and trade only with funds you can afford to lose.

Bitcoin Trading Strategy for 18th November 2024Bitcoin Trading Strategy: Buy Above 91,500 / Sell Below 88,700
Current Price: 90,706.00 USD
Key Levels:
Buy Signal: If the price closes above 91,500 on the one-hour candle, it indicates an upward momentum, suggesting a good time to consider buying.
Sell Signal: If the price closes below 88,700 on the one-hour candle, it suggests a downward momentum, indicating it might be a good time to consider selling.
Market Analysis:
The current price is around 90,706.00 USD, indicating potential for both bullish and bearish activity based on the key levels.
Pay close attention to the range between 88,700 to 91,500 for support and resistance levels.
Recommendations:
Buy: If the price sustains above 91,500 on the one-hour candle close, consider entering long positions. Book partial profits at 91,300 levels or use a trailing stop loss to protect your profit, with targets at 91,800 and 92,500.
Sell: If the price breaks below 88,700 on the one-hour candle close, consider short positions. Book partial profits at 88,900 levels or use a trailing stop loss to protect your profit, with targets at 88,000 and 87,500.
Disclaimer: This analysis is for educational purposes only. Please conduct your own analysis before making any trading decisions.

How would Bitcoin react? Btc/Usdt Chart analysis Bitcoin on Hourly chart is has formed HH & HL (HIGHER HIGH, HIGHER LOW). Trend is definitely bullish but after a massive move every assets goes for a correction. Looking at hourly chart we can see that Bitcoin is trading in range bound and it need to take any side liquidity for any trade to be executed. For buy we would suggest to wait for the ATH (All time high) to be breaken out. So sell side we would suggest to wait for a MSS( Market structure shift). Weekends are usually slower for Crypto market. We will wait for the first Asian session of the day to start and will trade plan accordingly
