BTCUSDT Technical Analysis (1H Timeframe)BTCUSDT is showing a bearish structure on the 1H timeframe, with price rejecting strongly from the 71,300–71,800 supply zone and forming lower highs. The recent upside move looks corrective, and price is failing to hold above previous demand, signaling weak bullish momentum.
The key area to watch is 68,888. A breakdown below this level confirms continuation to the downside, with liquidity resting below recent lows. The next major demand zone sits between 68,000 and 67,200, aligning with prior reactions and imbalance.
Trade Setup:
Sell below 68,888 | TP1: 68,000 | TP2: 67,222 | SL: 70,222
Bias remains bearish below 70,200; bullish control only above 71,800.
Disclaimer:
This analysis is for educational purposes only and does not constitute financial advice. Cryptocurrency trading involves significant risk, and losses may exceed your investment. Always do your own research and manage risk properly before entering any trade.
Bitcoinprice

BTC/USD : Weekly Head & Shoulders Breakdown Bitcoin has completed a clear Head & Shoulders distribution structure on the weekly timeframe , followed by a decisive breakdown below the neckline. Price is now trading into a key higher-timeframe demand zone , where long-term market intent will be revealed.
This area is critical for understanding whether the move is true bearish continuation or a liquidity-driven reset before expansion .
🔍 What the Weekly Chart Is Showing
➤ Well-defined Left Shoulder, Head, and Right Shoulder structure
➤ Clear rejection from the head region, signaling distribution
➤ Breakdown below neckline confirming structural weakness
➤ Price approaching a major historical demand zone
📊 Price Action & Market Psychology
➤ Head & Shoulders on higher timeframe often signals trend exhaustion
➤ Breakdown candles show strong institutional selling pressure
➤ Current zone may act as a liquidity grab for weak longs
➤ Long wicks and reactions here will be crucial for next cycle bias
🎯 Key Scenarios to Watch
➤ Strong reaction from demand → range formation & accumulation
➤ Liquidity sweep below demand → smart money absorption
➤ Clean reclaim of S/R interchange → bullish structure rebuilding
➤ Failure to hold zone → extended bearish continuation
⚠ Execution & Risk Notes
➤ This is a higher-timeframe zone, not a scalping area
➤ Avoid emotional bias based on single weekly candles
➤ Let structure confirm before committing capital
➤ Patience is the real edge on HTF charts
📌 This analysis is based on weekly market structure, liquidity behavior, and price action.
📚 Higher timeframes define direction — lower timeframes define execution.
Disclaimer:
This analysis is provided for educational and informational purposes only. It does not constitute financial advice or a recommendation to buy or sell any financial instrument. Cryptocurrency markets are highly volatile. Always do your own research and manage risk responsibly. The author is not responsible for any trading losses.

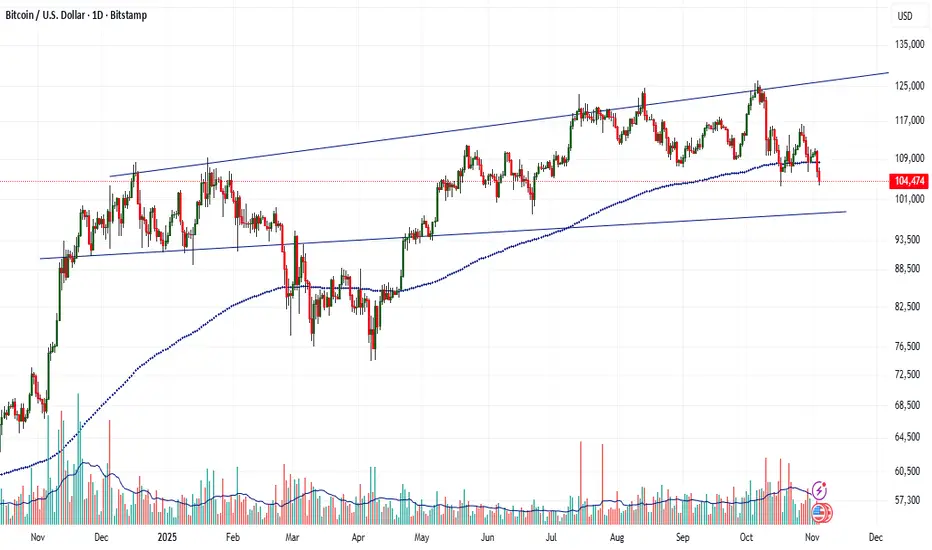
Perfect F&P on Bitcoins daily charts (21/01/26)Bitcoin forming good chart pattern on the daily charts.
The charts is a perfect example of a Flag and Pole pattern. If the pattern completes there are chance of seeing bitcoin dipping.
Identifying the last support around 85K. Be watchful if price dips below it.

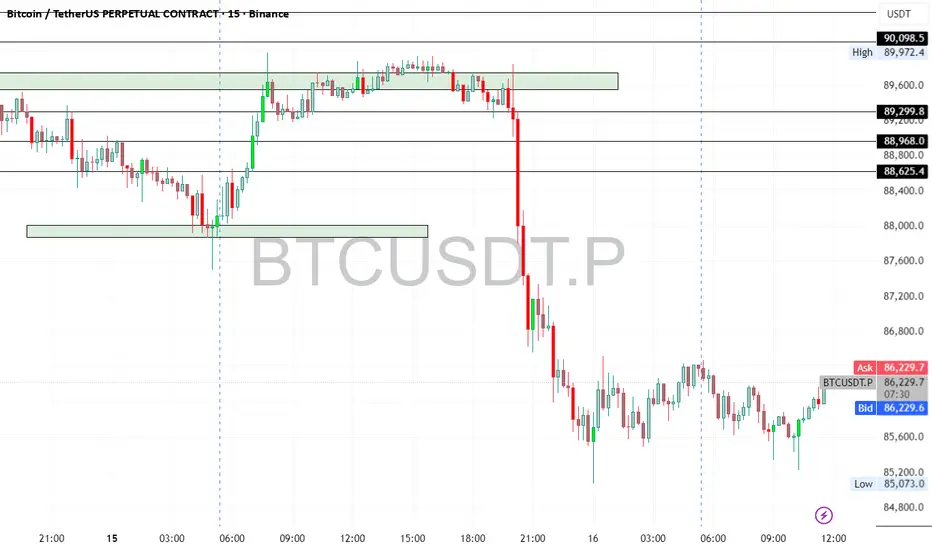
BTCUSDT – London Session Long (Intraday)BTC is holding above a key intraday demand zone after a sharp sell-off, followed by a strong reaction and higher low. Price is consolidating, and the London session often provides expansion from such structures.
Trade Plan
🔺 Entry Zone: 92,500 – 92,650
🛑 Stop Loss: 91,750 (below demand)
🎯 Targets:
• TP1: 93,200
• TP2: 94,000
Entry Confirmation
15m close above 92,600 (preferred)
OR 5m break & retest holding above the entry zone
Invalidation
15m close below 92,300
📌 Trade management: partials at TP1, trail rest toward TP2.
⚠️ Not financial advice. Trade responsibly.

BTC Technical Outlook – Cycle High WatchBitcoin is potentially entering the final push of the current cycle, with price action forming a Head & Shoulders (H&S) structure near the newly formed ATH. While this pattern is not confirmed yet, it does raise caution for a possible local top.
📈 Upside Scenario:
Our immediate focus remains on the $111,000 zone, which aligns with a potential liquidity grab area. A push into this region followed by strong rejection would strengthen the bearish case.
📉 Risk Zone to Monitor:
If rejection occurs near $111K, attention will shift to the neckline area, which will be crucial in confirming the H&S breakdown.
⚠️ Key Takeaway:
Bullish continuation remains valid until rejection is confirmed
$111K = key upside target & decision zone
Neckline break would confirm trend exhaustion
_Wait for confirmation. Trade the reaction, not the prediction._

BTCUSD: Holding Wave X or Slipping Lower?24 Nov 2025
27 Nov 2025
1 Dec 2025
17 Dec 2025
Bitcoin is still trading inside a falling channel, and the overall structure remains corrective. The recent bounce from lower levels lacks momentum and is overlapping, which signals consolidation rather than a trend reversal. Price continues to respect channel resistance, keeping the broader bias weak.
Wave X is acting as an important support zone around 83,822 , and as long as price holds above this level, further consolidation remains possible. This area is currently absorbing selling pressure and preventing immediate continuation to the downside.
However, a decisive breakdown below Wave X would signal that the correction is not complete. In that scenario, downside momentum is likely to expand, opening the path toward the 79,650 - 75,655 zone.
Stay Tuned
@Money_Dictators
RD :)

BTC Market Update – FOMC Range ModeBitcoin is stuck in FOMC limbo — no clean pump, no dump, just tight consolidation as markets wait for Powell’s cue. Volatility is coiling, and a big move is loading.
Key Levels to Watch:
Support Zone: $92K–94K (must hold for bullish continuation)
Bullish Trigger: Break & hold above $94.6K
🎯 Next upside: $100K retest
Bearish Trigger: Break below $87.7K
🎯 Downside risk: Low $80Ks before a rebound attempt
Market View:
This is a classic decision range — expect sharp expansion once direction is chosen. Stay alert around FOMC headlines; volatility can spike fast.
Bias: ⚖️ Neutral → Breakout pending
Disclaimer:
For educational purposes only. This is not financial advice. Trading in Forex, Gold, Crypto, and markets involves high risk. Do your own research and trade at your own risk.

Bitcoin UpdateBTC is down ~2% today but has recovered from the lows and is holding above key support at $86,180 — showing strong respect for the trendline.
Key Levels:
🟢 Support: $86,180 → if this breaks, next major support is $75,000
🔵 Resistance: ~$92,000
🟩 Major Resistance: ~$100,000
Positioning:
I remain long from $86.2K and plan to add near $75K if price drops.
Trend structure remains intact.
Bitcoin: The 2026 Grind – Rejection Zones vs. The $130k TargetChart Analysis
Bitcoin has successfully completed a SL hunt to the downside, sweeping liquidity and finding local support. With this liquidity grab finished, the immediate bias shifts upward as price begins the "2026 Grind" toward higher structural resistance.
Using a Trend-Based Fib Extension ($55K Low - $106K High - $76.5K Retracement), we are monitoring the reaction at key overhead levels.
1. The Current Move: Testing Resistance
Following the stop hunt, price is grinding upward to test the strength of the recovery. The bulls face two critical hurdles:
Rejection Zone 1 ($95K - $97K): The 0.382 Fib level. This is the first major test for the bounce.
Rejection Zone 2 ($100K - $103K): The 0.5 Fib level. This is the "line in the sand" for the bearish case.
2. The Bearish Scenario (Rejection)
If the rally stalls and gets rejected at either of these zones, it suggests the bounce was merely corrective.
Downside Target: A failure here opens the path to $69K - $70K to fully reset the market structure.
3. The Bullish Breakout
If the momentum from the recent stop hunt is strong enough to pierce through the resistance zones:
Confirmation: A break above the $110K level flips the structure back to bullish.
Target: This opens the door for a run to the 1.0 Fib extension at $127K - $130K .
________________________________________
I built a trading journal that actually respects your privacy.
No sign-ups. No servers. No monthly fees. 100% free.
PublishNotes runs locally in your browser. You own the data, you own the backups. It helps you track your execution, bias, and behavioral mistakes without the friction of cloud apps. Download it, use it, export it. It's that simple.
Try it here: publishnotes.com
hashtag#trading hashtag#tradingjournal hashtag#privacy hashtag#notetaking

Attacking the $91k Supply Wall – Breakout SetupBitcoin is currently compressing just below a major area of liquidity. As illustrated on the chart, the $91,100 - $91,300 zone has acted as stubborn resistance, resulting in multiple distinct rejections over the recent period (marked by the red arrows).
Technical Analysis:
The Resistance (Supply): We have seen price action fail to sustain momentum above the red resistance line ($91,140) multiple times. However, the repeated tests of this zone suggest that supply is being absorbed. The more often a level is tested, the weaker it typically becomes.
The Rejection vs. Compression: Despite the sharp rejections shown, BTC is maintaining its structure. The price is currently coiling, looking to challenge this level once more.
The Trigger: A high-volume breakout and candle close above $91,300 would invalidate the bearish order block and likely trigger a move toward the psychological $100k barrier.
If the bulls can finally clear this hurdle, there is very little overhead resistance preventing a run toward the target. Watch for volume confirmation upon the break of the red line.
Trade safe and manage your risk.

BTCUSD - Wave 5 Decline Still Likely AheadPrevious Analysis:
BTC is approaching a critical reaction zone where the current rise looks more like a corrective push than the start of a new trend. Price is moving toward the highlighted supply region, which aligns with a potential wave 4 completion inside the descending channel. The structure from the recent low shows an internal a–b–c formation, suggesting this bounce could run into exhaustion as it enters the red zone. Unless BTC breaks out of the channel with conviction, the broader momentum still leans bearish. A rejection from this region would likely trigger the final wave 5 leg, driving price toward deeper Fibonacci levels and completing the corrective cycle before any meaningful recovery attempt can begin.
Stay Tuned!
@Money_Dictators

If you ignore this than it's your choice INDEX:BTCUSD
I am also shocked
every November closed in green in Year on year based than november near to end then it means v shape bounce is ready to in 6 days
please do your own research before taking any trade.
i am not financial advisor
risk is real stay practical
please feel free to ask any questions

Bitcoin is in a clean daily downtrend right nowBitcoin is in a clean daily downtrend right now – every bounce is just providing fuel for the next leg until the structure says otherwise.
Good evening traders, Brian here with a higher-timeframe look at BTCUSD.
Fundamental analysis
Bitcoin has been under sustained pressure even as some funds continue to accumulate spot positions. A few key points:
Macro uncertainty and tighter dollar liquidity are weighing on high-beta assets. While gold has held up relatively well, the performance gap between BTC and XAU has been widening in recent weeks, highlighting a clear risk-off tone towards crypto.
On-chain and fund flows suggest that a number of crypto investors are actually de-risking and pulling capital out, which reduces market depth and makes downside moves more violent when liquidity is thin.
Narrative is still mixed: long-term holders and some institutions are happy to buy lower, but in the short term the order flow is dominated by forced selling, deleveraging and risk reduction.
Bottom line: the macro backdrop does not yet justify an aggressive “buy the dip” approach on BTC. Trend-following shorts remain safer than trying to call the bottom.
Technical analysis
Daily structure is clearly bearish:
We have a confirmed market structure shift on the left of the chart, with the prior higher-low support broken and a series of decisive lower lows since then.
The main bullish trendline from earlier in the year has given way, and price is now travelling within a steep descending leg.
BTC recently tagged the 1.618 Fibonacci extension of the last major swing, aligning with a prior liquidity pocket. That produced a sharp intraday bounce, but so far it looks like a reaction inside a downtrend, not a full reversal.
Around 75.4k we have an important daily support zone. If this level is broken and accepted below, it opens the door to a deeper flush towards the next large support band lower on the chart.
Overhead, there is a clean imbalance/FVG and prior distribution area around 108k, with an intermediate resistance block around 96–97k and a nearer supply zone around 88k. These are prime locations to look for fresh shorts if price retraces.
For now my bias is simple: look to sell rallies into premium levels; any longs are tactical, short-term trades off key support only.
Key levels
Resistance / short zones:
88,000 – first reaction zone, “pay attention to the reaction”
96,500–97,200 – main short entry area for medium-term positions
108,000 – higher FVG / major daily supply
Support / long-only intraday zones:
75,400 – key support + 1.618 Fib/liquidity zone
74,000–72,000 – deeper support if 75.4k fails
Trade scenarios (for reference, not financial advice)
1. Short the first meaningful pullback – 88k area
Entry: 88,000
Stop: 90,000 (above local structure)
Targets: 82,000 → 78,000 → 75,500
Idea: treat 88k as the first supply zone in a downtrend. If price bounces from current levels and stalls here, I’m looking for rejection (wick rejections, failed break, or a clear shift in intraday structure) to join the trend. Once price moves in favour, I would look to pull the stop to breakeven and let the position run.
2. Core swing short – 96.5k–97.2k zone
Entry: 96,500–97,200
Stop: 99,000
Targets: 88,000 → 82,000 → 75,500
This is my preferred “medium-term” sell area. It aligns with a more significant daily supply block and offers better risk–reward if the larger bearish leg continues. Any squeeze into this region after a series of lower lows is, in my view, a controlled opportunity to reload shorts.
3. Tactical long only at deep support
Entry: 75,400–74,800
Stop: 73,800
Targets: 82,000 → 88,000
Here I would only consider a short-term long if we see a clean liquidity sweep into the 1.618 extension and strong rejection (long lower wicks, aggressive buy-back). The idea is simply to trade the bounce back into resistance, not to fight the higher-timeframe downtrend.
If BTC loses 75.4k and starts closing below it on the daily, I would become much more cautious on any long exposure and focus almost entirely on short setups towards the lower “important support” zone on the chart.
Trade with the trend, respect your risk, and don’t get trapped trying to be a hero at the bottom of a falling market.
If this BTC breakdown adds value to your plan, make sure you follow Brian for more daily BTC and gold analysis, and share your own view in the comments so we can compare scenarios.

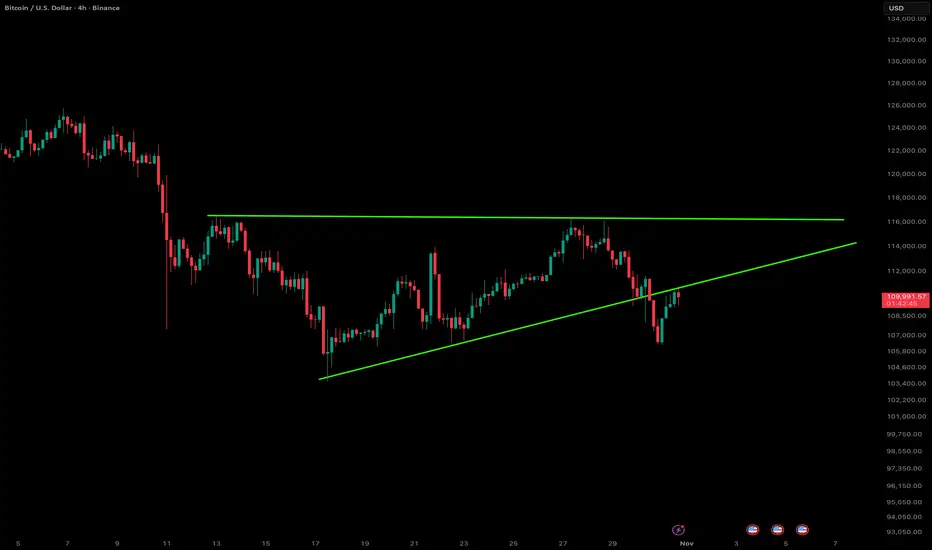
Bitcoin – Breakdown from the Ascending TriangleBitcoin just slipped below the ascending triangle support on the 4-hour chart, signaling a potential shift in short-term momentum. The structure had been forming higher lows toward the $115K resistance zone, but sellers stepped in hard near the top, breaking the trendline that’s been guiding the uptrend since mid-October.
The move comes amid broader weakness across the crypto market — BTC has shed about 3.7% this month, while altcoins like XRP and ETH are also struggling. Despite the pullback, Bitcoin still holds an impressive 18% gain for the year, so the bigger picture remains constructive.
Macro pressure seems to be weighing on sentiment — investor caution around interest rates, inflation, and the Fed’s next move is keeping volatility elevated. If upcoming data tilts toward another rate cut, we could see renewed upside momentum. But for now, price action suggests a possible retest of lower zones before bulls can re-establish control.
Overall, a clean technical breakdown in the near term, but the broader trend isn’t broken yet. Let’s see if bulls can reclaim that triangle support in the next few sessions.
DONT FORGET TO CHECK MY PROFILE BELOW 👇👇👇
BTCUSD SHOWING A GOOD UP MOVE WITH 1:10 RISK REWARD BTCUSD SHOWING A GOOD
UP MOVE WITH 1:10 RISK REWARD
DUE TO THESE REASON
A. its following a rectangle pattern that stocked the market
which preventing the market to move any one direction now it trying to break the strong resistant lable
B. after the break of this rectangle it will boost the market potential for break
C. also its resisting from a strong neckline the neckline also got weeker ald the price is ready to break in the outer region
all of these reason are indicating the same thing its ready for breakout BREAKOUT trading are follws good risk reward
please dont use more than one percentage of your capitalfollow risk reward and tradeing rules
that will help you to to become a bettertrader
thank you

BLOOD BATH IN BITCOIN Bitcoin is going to crash within 1/2 days only if sustains below 106,400 USD. We can plan for sell side after closing below the level. CRYPTO:BTCUSD . Mark the level and simple wait for the confirmation.

My Analysis Perfect 100%Analysis of the Price Action
Based on the image, the market experienced a significant and rapid downward movement, indicated by the long red candle (often called a 'sell-off' or 'wick' depending on how the candle closes) around the area you've highlighted.
• Before the Drop: The price was trading in a relatively high range, hovering around the 120,000 to 122,000 USDT mark, following a strong uptrend from late September to early October.
• The Drop: The price crashed through multiple key support levels (the horizontal white, yellow, and red lines, as well as the green/red zones you have drawn) in a very short period.
• The Volume: This massive price drop was accompanied by a huge spike in selling volume (the very tall red bar in the volume indicator at the bottom), which confirms a strong and sudden selling event.
• The Low: The price wick reached a low around 101,668.1 USDT before bouncing slightly.
Interpreting "My Target is Done"
Since I don't know the specifics of your trading strategy, "My target is done" could mean a few things:
1. Stop-Loss Hit: If you were long (betting on the price going up) and had a stop-loss set somewhere in the zone where the price fell, this sudden move would have triggered your stop-loss, closing your position for a loss (a target for your risk management).
2. Take-Profit Hit (Short Position): If you were shorting (betting on the price going down) and had a take-profit target set in the lower price ranges (perhaps around 110,000 or 105,000 USDT), this drop would have executed your take-profit order for a gain. This is the most common interpretation if you are celebrating a target being done during a crash.
3. Target for Entry: If you were waiting to buy the dip, the price hitting the very low levels (the wick) might have triggered a buy limit order you had placed, meaning your target for a new entry was achieved.
Given the nature of the move, if you were short, congratulations! If you were long, this looks like a painful liquidation or stop-loss event.

BTCUSD and ETHUSD BTCUSD and ETHUSD could not break the hurdle and formed nearly a triple top pattern. Some reversal has been seen. Maybe could fall some more. One should consider co-relating it with the trend of Gold and find entry opportunities in Crypto (just as a hedge in my view).

Bitcoin Under Pressure: Bearish Momentum BuildsBitcoin recently transitioned from a corrective decline into a consolidation phase, where price activity showed reduced volatility and market indecision. The breakout from this range has introduced renewed momentum, highlighted by strong bullish candles and a clear shift in trend dynamics. This move reflects fresh capital entering the market, suggesting growing investor confidence and positioning for potential continuation.
Despite this momentum, the structure also shows signs that rapid acceleration could invite short-term profit-taking, which may create phases of corrective retracement before the broader trend direction is reestablished. The market remains sensitive to global financial sentiment, liquidity cycles, and broader adoption narratives, meaning volatility should be expected even within an upward bias.
Overall, current conditions reflect a shift toward renewed optimism, with momentum favoring buyers while maintaining the likelihood of temporary corrections as part of a healthy market cycle.

BTC Market Update – Bullish Trend RebuildingBTC Market Update – Bullish Trend Rebuilding
The market structure on Bitcoin highlights a sequence of expansion, consolidation, and sharp corrective phases. After reaching a peak around 115,000, the price shifted into a prolonged sideways phase, where liquidity built up before a decisive breakdown. This breakout introduced stronger bearish momentum, driving price toward lower ranges.
Currently, Bitcoin is stabilizing around 109,500 after the decline, with price action suggesting a potential extension into deeper liquidity zones near the lower range before regaining upward momentum. The projected flow reflects a scenario where downside movement acts as a liquidity sweep, providing the conditions for buyers to re-engage.
The broader outlook remains constructive. Even with short-term pressure favoring the downside, the long-term structure still supports recovery potential. A strong reaccumulation phase could lift Bitcoin back toward the 115,000 zone, aligning with the market’s tendency to reclaim imbalance after periods of sharp displacement.

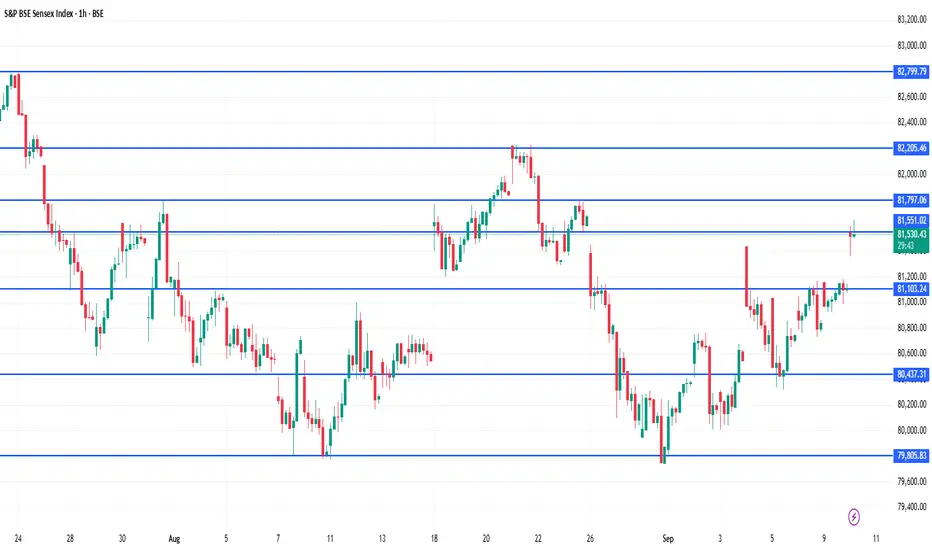
SENSEX 1hour Time frame📍 Sensex – 1H Important Levels (Current)
🔹 Support Zones
74,200 – 74,300 → Immediate intraday support
73,800 – 73,900 → Stronger support zone
73,400 – 73,500 → Major support, breakdown may trigger further downside
🔹 Resistance Zones
74,800 – 74,900 → Immediate 1H resistance
75,200 – 75,300 → Strong resistance; breakout can fuel upside momentum
75,600 – 75,800 → Major resistance; sellers likely to appear here
⚖️ Quick Summary
Bias: Mildly bullish as long as Sensex trades above 74,200.
A breakout above 74,900 may target 75,200 – 75,800.
A breakdown below 73,800 may drag it towards 73,400.
Current range to monitor: 74,200 – 74,900.