Bitcoin Monthly Support Test — Next Target $58,419 ?Key support sits at $81,933. A clean break and close below this zone could expose Bitcoin to a deeper retracement toward the next major support around $58,419.
However, $81,933 is also a strong monthly support level, so the market’s reaction here is critical.
Keep an eye on whether this level holds or fails — it will likely dictate the next major move.
Share your view in the comments: Do you think BTC will defend this monthly support, or are we heading lower?
Bitcoinpriceprediction

BTCUSD If Btc breaks below red line then chances are high it could test below support level white line at 92000 and 88000
Disclaimer:
It's a personal view not a financial advice and I assume no responsibility and liability whatever outcome arises.

BITCOIN - STRUCTURAL SHIFT AMID CORRECTION & LIQUIDITY TESTSymbol - BTCUSD
CMP - 1,05,634
Bitcoin is experiencing a recovery following a liquidity sweep in the 1,00,000 zone. Despite the broader bullish trend, the local technical outlook remains mixed.
Bitcoin is currently undergoing a shift in market structure, with a change in character observed around the 1,06,700 level and a breakdown of the bullish structure at 1,03,000 during a corrective phase. This downward movement is testing liquidity beneath the 1,00,700 support zone. Several factors contribute to the ongoing liquidation: notably, the unexpected market reaction to tensions between Donald Trump and Elon Musk, and the liquidation activities of large holders (whales), which appear to be repeating historical patterns.
While traders are actively buying back Bitcoin, the overall market structure remains technically bearish. Locally, a downtrend is present, and a countertrend move interpreted as a form of 'liquidity hunting' is currently developing.
A key area of interest lies between 1,05,900 and 1,06,700. The initial retest of this zone may result in a false breakout due to insufficient momentum for sustained upward movement following the strong buyback.
Resistance levels: 105900, 106720, 110400
Support levels: 103000, 101400, 100,000
Following a correction from the 1,05,900 level, which may target the 50% retracement of the recent trading range, the market could potentially re-enter a bullish phase, provided buyers manage to maintain price levels and prevent a drop to new local lows. In the short term, a decline from 1,05,900 to 1,03,000 is anticipated. However, if the price subsequently recovers to the 1,05,500–1,05,900 range, there may be an opportunity for further upward movement toward the 1,10,000 level.

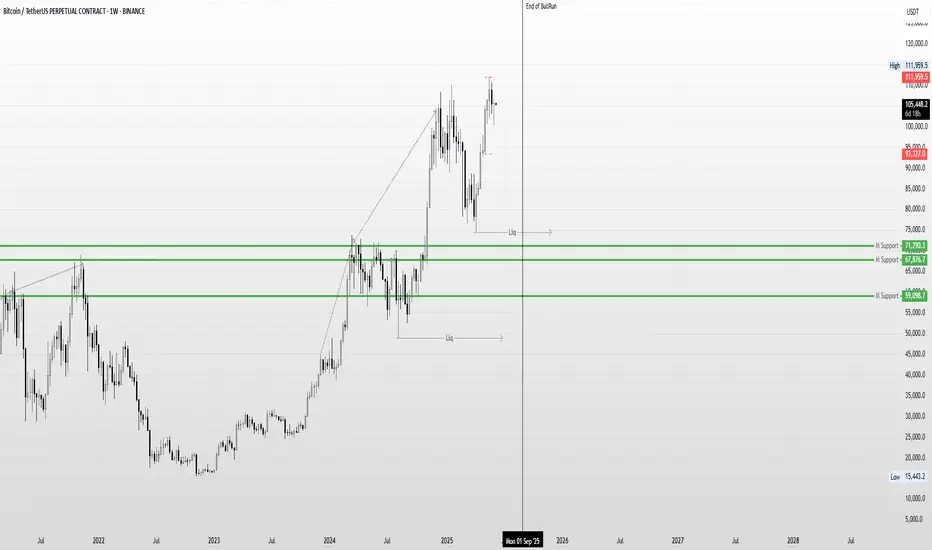
Bitcoin Weekly Analysis: Potential Exhaustion in Price ActionWhile Bitcoin continues to form Higher Highs on the Weekly Time Frame, the overall price action appears to be gradually losing momentum. From my perspective, this could be an early sign of exhaustion, suggesting that the current bullish trend may be nearing its end.
If this weakening momentum continues, there's a possibility that a broader correction or even the beginning of a bear market could unfold post-September. In such a scenario, the market may attempt to hunt significant downside liquidity levels, potentially targeting zones around $74,000 and even as low as $48,000.
Of course, this is purely a personal prediction based on current price structure and market behavior. Only time will reveal how accurate this outlook turns out to be.
Disclaimer :
This content is for informational and educational purposes only and does not constitute financial or investment advice. The views expressed are based on personal analysis and should not be considered as a recommendation to buy, sell, or hold any asset. Cryptocurrency markets are highly volatile, and past performance is not indicative of future results. Always do your own research (DYOR) and consult with a licensed financial advisor before making any investment decisions.
BTC Bull Run Ending Soon?"September could mark the climax of Bitcoin’s bull rally, triggering a correction phase as smart money begins profit-taking — key levels like $74,457 and $48,888 may become attractive accumulation zones in the upcoming bear market."
Disclaimer : This content is for informational and educational purposes only and should not be considered financial or investment advice. Cryptocurrency trading involves significant risk and may not be suitable for all investors. Always do your own research (DYOR) and consult with a qualified financial advisor before making any trading decisions.

BITCOIN ON THE MOVE - BULLS IN CHARGE OR A TRAP AHEAD?Symbol - BTCUSD
CMP - 96000
BTCUSD has reached a new local high of 97900. The overall market structure remains constructive. However, its sustainability continues to be influenced by macroeconomic fundamentals and the performance of the S&P 500 index.
Recent gains have been supported by improvements in the US tariff landscape and the ongoing stabilization of US-China relations. Bitcoin's rally was further reinforced by the concurrent rise in the SPX 500, with which it maintains a relatively strong correlation. During the second half of this week, BTCUSD broke out of a two week consolidation phase, surpassing the resistance level at 95500 and establishing a new local high. A corrective movement is now developing within the confines of the existing upward channel.
The 95000 level represents a key liquidity and risk zone. If bullish momentum sustains above this threshold during a potential retest, the upward trend is likely to persist in the short to medium term. Conversely, a decisive break below 95000 may lead to a deeper decline toward the 92000–88000 range.
Resistance levels: 97425, 99475
Support levels: 95500, 92000
Market attention is focused on the 95500 support level, beneath which a significant liquidity pool has accumulated. Continued growth may result from a retest-induced rebound or a market imbalance favoring buyers. However, caution is warranted as upcoming economic data releases may significantly influence price action.
Important note: A return to the sell zone below 95000–95500, accompanied by an inability to sustain upward momentum, could lead to a broader correction and potential liquidation events.

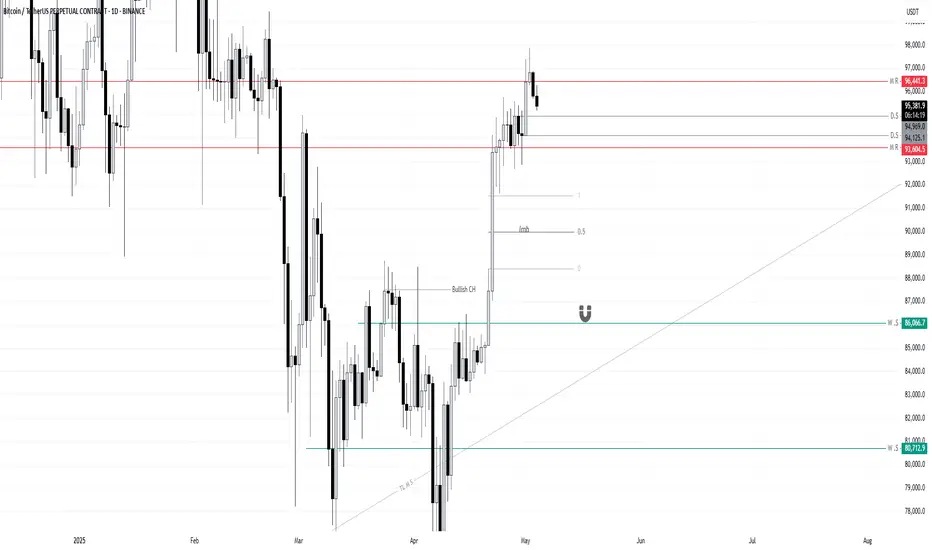
Bitcoin OutLook for Next Week BTCUSDT.pMarket Outlook (BTC/USD):
I’m currently observing the ₹94,125 level on the daily timeframe. A daily candle close below this level would significantly increase the probability of Bitcoin retracing toward the imbalance zone around ₹90,000.
However, there is a key demand zone near ₹86,000, which could act as a strong support and potentially push the market back upward. This area will be crucial in determining whether the bearish momentum continues or a reversal is triggered.
Let’s see how the market reacts around the ₹94,125 level. I’ll post the next update after Monday’s daily candle closes.
Thank you for your continued support — it's truly appreciated.
Bitcoin - BUY for Targets - 90, 92 & 95KIn chart, price has given breakout of immediate resistance line and retested and price moving up. price move clearly indicating bullish and up move. Fib Levels and resistance lines indicating first target at 90K and on breakout possibility of 92 and 95 K as per fib levels. But first move towards 90K is visible in chart. Other Cryptos - ETH and SOL super bullish after good accumulation clearly indicating up move. Hope and wish this move is quicker !!!!

BTC futures live analysis for 16 jan 2025BTC futures chart creating head and shoulder pattern & break down is expected.
But Overview will be changed if price breaks & sustain above resistance sharp Upmove will b expected

Bitcoin - testing Support again at 93KBTC is still in megaphone pattern and once again testing the lower side of the pattern for confirmation of the support. if this second time holds good chances of BTC to make more upside moves Bitcoin and all other cryptos are very volatile, risky and great profit giving asset to be bought for short, medium or long term great profits. For trading one need to have enough margins to handle any volatility. For trading use only 40% for taking positions and use 60% to hold for any volatile movements.

BTCUSD SHOWING A GOOD UP MOVE WITH 1:8 RISK REWARDBTCUSD SHOWING A GOOD
UP MOVE WITH 1:8 RISK REWARD
DUE TO THESE REASON
A. its following a rectangle pattern that stocked the market
which preventing the market to move any one direction now it trying to break the strong resistant lable
B. after the break of this rectangle it will boost the market potential for break
C. also its resisting from a strong neckline the neckline also got weeker ald the price is ready to break in the outer region
all of these reason are indicating the same thing its ready for breakout BREAKOUT trading are follws good risk reward
please dont use more than one percentage of your capitalfollow risk reward and tradeing rules
that will help you to to become a bettertrader
thank you

BITCOIN SHOWING A GOOD UP MOVE WITH 1:7 RISK REWARD BITCOIN SHOWING A GOOD UP MOVE WITH 1:7 RISK REWARD
DUE TO THESE REASON
A. its following a rectangle pattern that stocked the market
which preventing the market to move any one direction now it trying to break the strong resistant lable
B. after the break of this rectangle it will boost the market potential for break
C. also its resisting from a strong neckline the neckline also got weeker ald the price is ready to break in the outer region
all of these reason are indicating the same thing its ready for breakout BREAKOUT trading are follws good risk reward
please dont use more than one percentage of your capitalfollow risk reward and tradeing rules
that will help you to to become a bettertrader
thank you

BTCUSD/BITCOIN 1H BUY PROJECTION 23.11.24Reason for Bitcoin Bullish
One big reason Bitcoin's price has gone up is because institutional demand continues to rise.. They're putting a lot of money into Bitcoin, which makes it more trustworthy. For example, MicroStrategy has bought a lot of Bitcoin and made a good profit as its value has increased. The way the market works also help

BTCUSD/BITCOIN DAY BUY PROJECTION 16.10.24Reason for Bitcoin Bullish
As a result, BTCUSD is the most popular crypto-to-fiat pair, and it serves as the de facto gold standard for the cryptocurrency market; providing the price direction cue for virtually the entire crypto market. In the BTCUSD pair, Bitcoin is the base currency, while the US dollar is the quote currency.

GOLDEN OPPURTINITY FOR BITCON INVESTORS BIG BREAKOUT COMEINGGOLDEN OPPURTINITY FOR BITCON INVESTORS BIG BREAKOUT COMEING
BITCON SHOWING A GOOD UP MOVE WITH BIG BREAKOUT SINARIO
DUE TO THESE REASON
A. its following a ACCENDING triangle pattern that stocked the market
which preventing the market to move any one direction now it trying to break the strong resistant lable
B. after the break of this pattern neckline it will boost the market potential for break
C. also its resisting from a strong neckline the neckline also got weeker ald the price is ready to break in the outer region
all of these reason are indicating the same thing its ready for breakout BREAKOUT trading are follws good risk reward
D. rapid increaseing in volume shows that buyes are showing intrest to buy
so it will be a life changeing oppurtinity for investors
please dont use more than one percentage of your capitalfollow risk reward and tradeing rules
that will help you to to become a bettertrader
thank you

BTCUSD SHOWING A GOOD UP MOVE WITH 1:10 RISK REWARD TRENDY WEEKBTCUSD SHOWING A GOOD
UP MOVE WITH 1:10 RISK REWARD
DUE TO THESE REASON
A. its following a rectangle pattern that stocked the market
which preventing the market to move any one direction now it trying to break the strong resistant lable
B. after the break of this rectangle it will boost the market potential for break
C. also its resisting from a strong neckline the neckline also got weeker ald the price is ready to break in the outer region
all of these reason are indicating the same thing its ready for breakout BREAKOUT trading are follws good risk reward
please dont use more than one percentage of your capitalfollow risk reward and tradeing rules
that will help you to to become a bettertrader
thank you

Bitcoin 4H Swing Update Bitcoin is currently trading at 62,836
- Bitcoin needs to flip and close above 65,213$ to flip bullish and discover new prices
- On the downside, we can soon see 61,300$ getting tested before we move further impulsively
- Bitcoin followed my old path exactly the way I had predicted it to follow
- Majorly Twitter and a lot of social media outlets were bullish when BTC was trading below 58,000 and that's where accumulation was witnessed and shorts got trapped
- Learning: In order to make money in Spot from the crypto market you need to stop doing what the 99% does in order to succeed and then only you will make extravagant money, Q4 & Q1 has always been bullish for crypto according to Seasonality

BTCUSD SHOWING A GOOD DOWN MOVE WITH 1:10 RISK REWARDBTCUSD SHOWING A GOOD DOWN MOVE WITH 1:5 RISK REWARD
DUE TO THESE REASON
A. its following a rectangle pattern that stocked the market
which preventing the market to move any one direction now it trying to break the strong resistant lable
B. after the break of this rectangle it will boost the market potential for break
C. also its resisting from a strong neckline the neckline also got weeker ald the price is ready to break in the outer region
all of these reason are indicating the same thing its ready for breakout BREAKOUT trading are follws good risk reward
please dont use more than one percentage of your capitalfollow risk reward and tradeing rules
that will help you to to become a bettertrader
thank you

BTCUSD SHOWING A GOOD DOWN MOVE WITH 1:10 RISK REWARDBTCUSD SHOWING A GOOD DOWN MOVE WITH 1:10 RISK REWARD
DUE TO THESE REASON
A. its following a rectangle pattern that stocked the market
which preventing the market to move any one direction now it trying to break the strong resistant lable
B. after the break of this rectangle it will boost the market potential for break
C. also its resisting from a strong neckline the neckline also got weeker ald the price is ready to break in the outer region
all of these reason are indicating the same thing its ready for breakout BREAKOUT trading are follws good risk reward
please dont use more than one percentage of your capitalfollow risk reward and tradeing rules
that will help you to to become a bettertrader
thank you

A decending triangle patterns showing on BITCOIN A decending triangle patterns showing on BITCOIN
A short term 15m tradeing setup showing on BITCOIN
Selling setup
With a risk reward ratio of 1:10
The setup giving clarity to selling because in longterm it's a Down TREND
Also in a pick top lable
And forming a DOWN setup
So according to the combine results of
15minit 1hour and daily chat
And the short term setup
All are of them indicating the same SELLING SETUP
Also cryptocurrencies are follows priseaction in a good way
Follow for more please don't use more than one percentage of your capital
Follows risk reward
Tradeing rules
And be deceplened
Try to be a better trader
Love you all❤️

Bitcoin 4H Swing Setup - Bitcoin is now down 15% from its recent swing high
- I have drawn 2 Price Paths for Bitcoin
- The first price path describes how Bitcoin can soon run up clear the Fair Value Gap and then pierce 60k and bounce from 56-58,000$
- The second price path describes how Bitcoin can soon run down grab liquidity from 56-58k and then move up towards 64k
- Bitcoin is currently sitting in a no-trade zone even if you are looking for longs or shorts make sure your leveraged positions are carrying a calculated risk

Looks like BTC is clear to MOVE UPThe chart is showing a lot of positive strength today.
-On a 4 hours chart we can see the price has retested the support multiple time and has accepted it well.
-100 MA is going to cross 200MA to upside which is also a positive sign. Small MA crossing a bigger MA and going up is always a good sign of momentum.
- MACD showing decreasing bear power and should create a divert, meaning the MACD line (Blue) should cross over the Signal line (orange).
- 20 MA is sitting at the bottom of current 4 hour candle -> That is a support.
- 50 Ma is lying between $63,000 & $61,000 creating another zone for support in case the price goes south for any reason.
Over sentiment is positive. The price should test and try to break the resistance at $66,000. And when it happens, another barrier at $68,000 is waiting. If the market receives some good momentum there are chances, the price directly goes to $69,000 before another cooloff.
Just a precaution which we should always have in our minds before taking any decision, watch out for any news with a negative sentiment, which can cause to retest the latest support.

Bitcoin - Ready for 1 LAC ++ Price A breakout in Inverted H&S and a Flag Pattern being created.
Breakout of inveted H&S leads to 75K above tht it breaksout from the flag pattern as well.
making a target of 102K.
