Option Buying vs. Option Selling🔍 What Are Options in Simple Terms?
Options are contracts that give you the right, but not the obligation, to buy or sell a stock (or index) at a specific price (called the strike price) before a certain date (the expiry).
There are two types of options:
Call Option: Gives you the right to buy.
Put Option: Gives you the right to sell.
Now, you can either buy these options or sell/write them. This is where Option Buying and Option Selling come into play.
🎯 Option Buying – The Dreamer’s Game
✅ What is Option Buying?
You pay a premium (small amount) and get the right to benefit from a big move in the market—either up or down—depending on the type of option you buy.
If you expect the market to go up, you buy a Call Option.
If you expect the market to go down, you buy a Put Option.
✅ Why Do People Love Option Buying?
Low Capital Requirement: You can buy an option for ₹100–₹2,000 and control a large value of the index/stock.
Unlimited Profit Potential: Your losses are limited to the premium, but profits can be huge if the market moves in your favor.
Simple to Execute: Easy for new traders to understand and start with.
❌ But Here’s the Harsh Reality...
Time Decay (Theta): Every day, your option loses value if the price doesn’t move. You’re fighting time.
Low Winning Ratio: Most options expire worthless. So unless you catch a big, fast move, you lose.
Emotionally Draining: You’ll be right on direction but still lose money due to premium decay or slippage.
🔄 Real-Life Example
Imagine buying a Bank Nifty 49,000 CE for ₹150. If Bank Nifty goes to 49,200, you might make good returns. But if it stays sideways or only moves near expiry, your ₹150 can become ₹10—even though your view was right.
Option Buyer’s Risk = 100% of Premium
Option Buyer’s Reward = Unlimited (theoretically)
🛡️ Option Selling – The Smart Money’s Edge
✅ What is Option Selling?
You sell/write options and receive the premium upfront. You win if the option loses value—which is what happens most of the time.
If you believe the market will not go above a certain level, you sell a Call Option.
If you believe the market will not fall below a certain level, you sell a Put Option.
Basically, you're betting on nothing extreme happening.
✅ Why Do Institutions Prefer Option Selling?
High Probability of Profit: Around 70–80% of options expire worthless. That’s why sellers profit more often.
Theta Decay Works in Your Favor: Time works for you, not against you.
Regular Income: You can create strategies to earn consistently—especially in rangebound markets.
❌ What Are the Risks?
Unlimited Loss Potential: If the market moves against you sharply, your losses can be massive.
Needs Big Capital: Option selling requires margin, usually ₹1.5 to ₹2 lakhs per lot.
High Discipline Required: One mistake (overleveraging or wrong strike selling) can blow up your account.
🔄 Real-Life Example
Suppose you sell Nifty 23,300 CE for ₹100 and Nifty closes at 23,100 on expiry. That ₹100 premium becomes zero, and you keep it fully. But if Nifty suddenly jumps to 23,500, your ₹100 premium may become ₹400 or ₹800, and you’ll be in deep trouble unless you manage your position.
Option Seller’s Risk = Unlimited (in theory)
Option Seller’s Reward = Limited to Premium
🧠 Which One Is Better?
It depends on your mindset, capital, and risk appetite.
👉 Option Buying is better if:
You are a small retail trader with ₹5K–₹20K capital.
You have a strong directional view (especially on event days).
You can afford to lose small amounts for big returns.
You don’t want to manage complex positions or margins.
👉 Option Selling is better if:
You have ₹1–₹2 lakh+ capital and a focus on consistent profits.
You can manage risk through hedging or spreads.
You prefer high accuracy and stable income over jackpot trades.
You follow rules and don’t panic with market moves.
🧠 Smart Approach: Combine Both
Professional traders don’t pick just one—they combine both.
💡 Examples:
Buy Call, Sell Far OTM Call = Bull Call Spread
Sell Both CE & PE at Key Levels = Strangle/Straddle
Buy Put, Sell Lower Put = Bear Put Spread
These reduce risk and improve probability while keeping reward potential intact.
🧘♂️ Final Advice (From Practical Traders)
Avoid random option buying. Don’t chase cheap options blindly.
Don’t sell naked options without risk control.
Use hedging or spreads to limit both loss and margin requirement.
Focus on discipline, not thrill.
Always respect position sizing, stop loss, and capital management.
Avoid trading during low volume or uncertain news zones.
📌 Conclusion
Option Buying is like buying a lottery ticket with logic. It’s risky, but the reward can be sweet. Option Selling is like being the insurance company—it’s slow, but steady and statistically in your favor.
Bitcointrading
Master Candle Sticks part-2🔥 What Are Candlesticks?
A candlestick is a visual representation of price movement within a specific time period (1 minute, 1 hour, 1 day, etc.). It consists of:
Body – The area between the open and close.
Wick (Shadow) – The high and low prices reached.
Color – Usually green (bullish) or red (bearish).
🧠 Why Learn Master Candlestick Patterns?
Mastering candlestick patterns helps traders:
Identify trend reversals or continuations.
Get early entry or exit signals.
Understand market psychology and price action.
Improve risk-reward ratios in trades.
🧭 Top Master Candlestick Patterns (Explained Simply)
Here are some of the most important candlestick patterns every trader should master:
1. Doji
🔍 Indecision in the market
Shape: Small body, long wicks
Meaning: Buyers and sellers are equal – could indicate a reversal if found after a trend.
Types: Standard Doji, Long-Legged Doji, Dragonfly, Gravestone
2. Hammer 🔨
📈 Bullish reversal pattern
Shape: Small body at top, long lower wick
Appears: After a downtrend
Signal: Buyers are stepping in strongly
3. Inverted Hammer
📈 Also bullish reversal
Shape: Small body at bottom, long upper wick
Appears: After a downtrend
Signal: Buyers testing resistance – may rise soon
4. Shooting Star 🌠
📉 Bearish reversal
Shape: Small body at bottom, long upper wick
Appears: After an uptrend
Signal: Sellers taking control
5. Engulfing Patterns
A. Bullish Engulfing
Two candles: First red (small), second green (larger, fully covers the red)
Appears: At the bottom of a downtrend
Signal: Strong reversal to upside
B. Bearish Engulfing
Two candles: First green (small), second red (large, covers the green)
Appears: At the top of an uptrend
Signal: Reversal to downside
6. Morning Star 🌅
📈 Three-candle bullish reversal
1st: Long red
2nd: Small (any color)
3rd: Strong green
Appears: After downtrend
7. Evening Star 🌇
📉 Three-candle bearish reversal
1st: Long green
2nd: Small (indecision)
3rd: Strong red
Appears: After uptrend
8. Marubozu
💡 Strong trend candle
No wicks (only body)
Green Marubozu: Full bullish power
Red Marubozu: Full bearish power
9. Spinning Top
🔄 Low momentum or indecision
Small body, equal upper and lower wicks
Shows uncertainty – market could reverse or consolidate
📘 Tips to Master Candlestick Reading
Don’t rely on just one candle. Always see the pattern in context of previous trend.
Use volume with candlesticks – A reversal candle with high volume is more powerful.
Combine with other tools – Support/Resistance, Moving Averages, RSI, etc.
Practice on charts daily – Backtest on historical data
✅ Final Thoughts
Master Candlestick Patterns are a foundation for price action trading. They don't work alone but when used wisely with technical indicators and proper risk management, they can give high-probability setups.

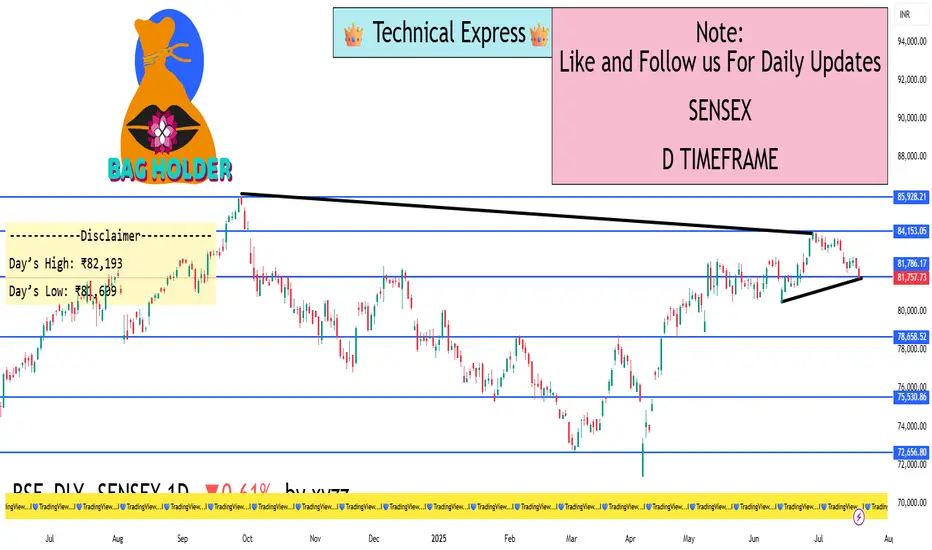
Sensex – 1D Timeframe📅 Sensex Daily Timeframe Analysis (1D) – As of 19 July 2025
📊 1. Market Summary
Closing Price: ₹81,758
Change from Previous Day: –502 points (–0.61%)
Day’s High: ₹82,193
Day’s Low: ₹81,609
52-Week High/Low: ₹85,978 / ₹71,425
➡️ Sensex dropped for the third day in a row and is showing signs of continued weakness.
🕯️ 2. Candlestick Behavior (1-Day Chart)
The candle formed is a bearish candle with a small body and an upper wick.
This means that the price went up intraday but couldn't hold and was sold off by the end of the day.
Sellers are actively pushing price down, especially near ₹82,000.
📉 3. Trend Direction
The market is in a clear downtrend.
This is seen by:
Lower highs (each peak is smaller than the last one)
Lower lows (each dip is deeper)
Sensex is unable to break back above key levels like ₹82,200 – showing strong selling pressure.
🧠 Trend Summary:
Price action is confirming bearish momentum. Buyers are weak, sellers are in control
📘 6. Volume & Market Strength
Volume is average to slightly rising on red (down) candles.
This shows active selling by institutions or large players.
No large green candle with volume = no strong buyer support yet.
💹 7. Simple Trading Strategy Based on 1D Timeframe
✅ If You’re a Swing Trader:
Bearish Bias: Sell on rise near ₹82,200 or ₹82,600
Target 1: ₹81,466
Target 2: ₹81,174
Stop Loss: Above ₹82,600 (or use trailing SL)
⚠️ If You’re Waiting for a Buy Opportunity:
Wait for price to touch ₹80,739 – ₹81,174 zone, then look for bullish reversal signals (big green candle, volume, RSI > 35)
🔚 Final Thoughts:
Sensex is under pressure.
No major recovery sign is seen yet.
A bounce is possible only near major support zones, but for now, bears are winning.
$BTC Potential Longing OpportunityWe’ve successfully opened our previous long position at $105,398.80.
What’s next?
I’m currently eyeing the $106,335.70 – $106,716.90 range as a potential zone for the next long entry. Price may retest this area before continuing its move to the upside.
This is not financial advice. Always trade at your own risk.

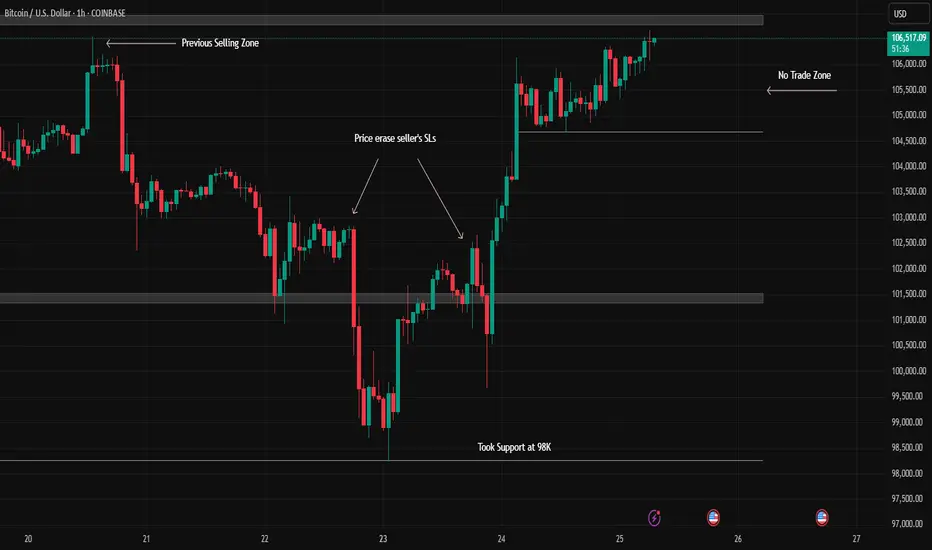
Bitcoin - Interesting Price Action in 1 HTFTRADERS AND INVESTORS,
The Bitcoin chart presents an interesting setup on the 1-hour timeframe (1 HTF). Here's a breakdown of recent price action:
Initial Resistance & Downtrend : Bitcoin's chart indicated potential trend changes, with significant selling pressure at the $106,000 mark establishing a clear resistance level.
Downtrend Confirmation & Support : This was followed by a series of lower highs, confirming a downtrend. Subsequently, Bitcoin found support and bounced from the $98,000 level.
Potential Reversal Signal : The recent upward movement cleared sellers' stop-losses, which could be an early indication of a potential trend reversal.
WHAT MIGHT HAPPEN NEXT?
Currently, Bitcoin is re-testing the crucial $106,000 resistance level.
Bullish Scenario : A confirmed breakout and sustained move above $106,000 could signal the continuation of an uptrend.
Bearish Scenario : Conversely, a strong rejection from this level might lead to a decline, potentially targeting the $101,000 support.
Current Stance : At present, this area appears to be a no-trade zone due to the indecisive price action.
Disclaimer : This analysis is for educational purposes only and should not be considered financial advice. Always conduct your own research before making investment decisions.
Bitcoin Bounce Alert: Holding the $100K Fortress! 📉 Market Context & Technical Levels
Key support at ~$100K: As the chart shows and multiple analysts confirm, this level continues to act as a strong defence zone. Cointelegraph noted bulls have been “defending the $100K key support level strongly,” triggering bounces during dips
Descending channel overhead: Bitcoin has retraced into a downward channel. A clean breakout above ~107K–109K (past recent peaks) is needed to signal a bullish shift .
Liquidity target at ~106K: Plenty of orders await in that region—flipping it to support may pave the way for another push higher .
📊 Indicators & Momentum
RSI dip near 25 during the latest drop indicates oversold conditions—often a precursor to rebounds
.
Volume surge on rebounds suggests absorbing sell pressure and strong accumulation interest at lower levels.
🚩 Key Price Zones to Watch
Level Significance
$100K Crucial support; losing it risks a slide toward $95K–97K or even $92K
.
$105K–106K Liquidity zone; flipping here as support could confirm upward momentum .
$107K–109K Resistance from channel tops and prior highs; a successful break is key to next leg up .
$112K–$112K+ If breakout occurs, upside targets extend toward prior ATH near $112K and beyond .
🎯 Chart Analysis Summary
Your chart shows three distinct bounces from the $100K–100.7K supply zone (highlighted in blue) and the latest one includes a sharp wick and rebound. This aligns with broader market dynamics emphasizing support at $100K and building liquidity at $106K. The arrow projection signals a probable retest of ~106K, with room to challenge ~107–109K after consolidation.
🧭 Trade Outlook
Bullish scenario: Hold above $100K → reclaim $106K → trendline breakout → potential rally to $112K+.
Bearish risk: Fails support at $100K → breakdown toward $95K–92K region.
📌 Bottom Line
Support $100K is alive and well. Bounces have been crisp and volume-backed.
Next test lies at $105–106K. That’s the battleground—flip it, and we may see bitcoin reclaim recent highs.
Watch the channel overhead (~107K–109K). A breakout could open the door to fresh records.
✅ Conclusion: BTC is defending its psychological base firmly. If this zone holds once more, the path to $106K and beyond is in focus. Breaking above demands conviction, but it’s the pivot to watch.

BITCOIN back to 93k! It's happening....Bitcoin breaking the structure in higher timeframe lead to massive fall in a short term.
I mean bitcoin is going to fall around -10%(93k) this week or within next week.
Dollar is getting stronger with geopolitical tensions as you guys know the middle East conflict.
You guys may think , it is not a right time to enter to sell, yes I agree but there is much more to capitalise in the further down.
These are all my view , not a financial advise.

BTCUSD SHOWING A GOOD UP MOVE WITH 1:7 RISK REWARD BTCUSD SHOWING A GOOD
UP MOVE WITH 1:7 RISK REWARD
DUE TO THESE REASON
A. its following a rectangle pattern that stocked the market
which preventing the market to move any one direction now it trying to break the strong resistant lable
B. after the break of this rectangle it will boost the market potential for break
C. also its resisting from a strong neckline the neckline also got weeker ald the price is ready to break in the outer region
all of these reason are indicating the same thing its ready for breakout BREAKOUT trading are follws good risk reward
please dont use more than one percentage of your capitalfollow risk reward and tradeing rules
that will help you to to become a bettertrader
thank you

BTCUSD SHOWING A GOOD DOWN MOVE WITH 1:7 RISK REWARD BTCUSD SHOWING A GOOD DOWN MOVE WITH 1:7 RISK REWARD
DUE TO THESE REASON
A. its following a rectangle pattern that stocked the market
which preventing the market to move any one direction now it trying to break the strong resistant lable
B. after the break of this rectangle it will boost the market potential for break
C. also its resisting from a strong neckline the neckline also got weeker ald the price is ready to break in the outer region
all of these reason are indicating the same thing its ready for breakout BREAKOUT trading are follws good risk reward
please dont use more than one percentage of your capitalfollow risk reward and tradeing rules
that will help you to to become a bettertrader
thank you

I am back with my BITCOIN prediction!! New all time high.....As per my analysis bitcoin is ready to break the roof top with it's long term rocket booster🚀.
Price takes the higher time frame liquidity and give nice push towards upside.
So the next resistance is consider as new all time high and get on the if you want.
Time is ticking, 3,2,1 suiiiiii🚀.
Just making fun with you guys.
Don't just follow mine blindly.
As you guys know the ongoing clash between musk and Trump.
I am with musk, so dollar will get hit( because of Trump).
They will show dollar is soo good. But America is falling.
You may ask, Trump is supporting the bitcoin, it will affect if he fails?
Yes I agree. It will affect a bit with some noise of market condition. Because
Trump is just a news,( like if you throw a stone into a water it will waves with sudden, overtime water will become to it own shape( fundamental is important) , bitcoin is also like water).
Consider that America is falling, new power is rising IYKYK.
This happens many times in the history ( rising and falling of empires).
I can say bit more , but this is enough to make a decision.
These are all my opinion, not a financial advise.
Comment your thoughts and share some of your knowledge with me.
I am ready to learn.

BTC/USD Playing Out Perfect - Long on 4 Hour then shortBTC has played out on the previously published chart taking support at fib levels. The rebound looks strong and should go up ~105700, which can be a good place to short. However in case volumes dip, can go back to retest previous support at ~103900, which if breaks is again a perfect opportunity is short. Should long above 104700 only.

Reliance industries Ltd bullish up +4%....According to weekly analysis it will reach 1500 area within this week.
At the same time nifty is also in bullish view.
I am going to position myself in reliance bullish trend.
1490 to 1500 is going to a major resistance area .

Bitcoin Technical Analysis: May 10, 2025# Current Price and Market Context
Price: Approximately $103,160, based on chart at posting time.
# Market Sentiment: Bullish, with 78% of technical indicators showing bullish trends and Fear & Greed Index at 73 (Greed).
Recent Performance: Bitcoin remains resilient, trading above key moving averages after a spring correction, with a strong bullish monthly trend. It hit an all-time high of $109,114.88 on January 20, 2025, but has since consolidated.
## My view: If weekly close exceeds $105,600, expect new all-time highs of $123,930–$127,482.
# Chart for reference

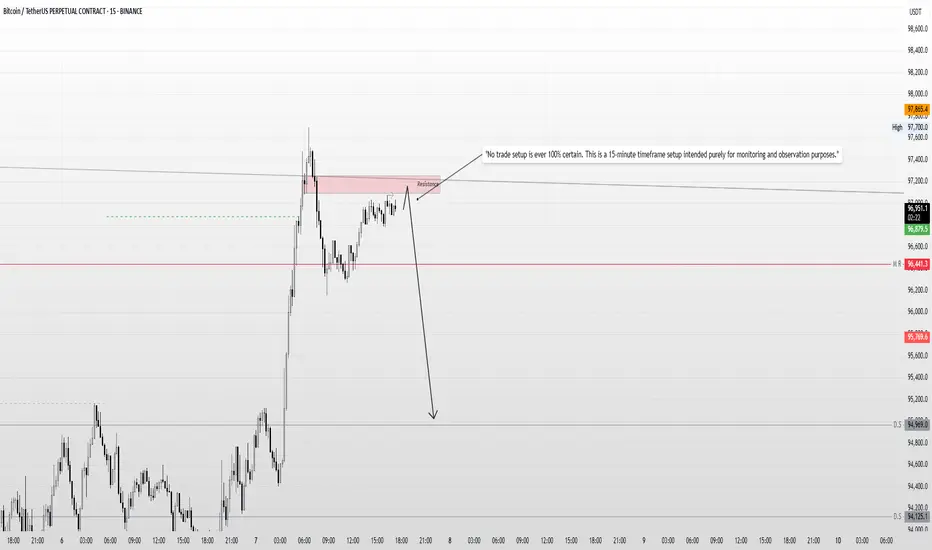
Bitcoin Intraday Bias – Liquidity Sweep & Rejection Setup"Intraday Setup: I anticipate that during the New York open, the market may sweep the liquidity around 97078, reject from the resistance zone, and potentially move lower."
"No trade setup is ever 100% certain. This is a 15-minute timeframe setup intended purely for monitoring and observation purposes."
Disclaimer: This is not financial advice. The analysis shared is for educational and informational purposes only. Please conduct your own research and consult with a licensed financial advisor before making any trading decisions. Trading involves significant risk and may not be suitable for all investors.
BTC#5: Summary of trading plans for BTC💎 💎 💎 In post #4, we made the choice to stay on the sidelines. What do you think about this decision? Leave a comment 💎 💎 💎
Based on yesterday's price reaction. Today, I continue to bring you the BTC trading plan and price prediction in the coming time:
1️⃣ **Fundamental analysis:**
📊 In his speech, Trump did not mention cryptocurrencies or Bitcoin, which caused:
⚫Bitcoin decreased by 3.2%.
⚫Cryptocurrency Market Liquidations Hit $200M+
🚀 Google Cryptocurrency Searches Hit 5-Year High
📌 Acting SEC Chairman Mark Uyeda Announces New Crypto Task Force Led by Commissioner Hester Peirce to Develop a Clear Regulatory Framework for Crypto Assets
2️⃣ **Technical Analysis:**
🔹 **D Frame**: Although the price broke the previous high, the closing candle shows that the Resistance Zone is not completely broken
🔹 **H4 Frame**: We can see the appearance of the 2nd peak which is lower than the 1st peak. The price structure is still bullish.
🔹 **H1 Frame**: You can see the Sideway triangle I drew on the chart. The current price structure is still increasing
3️⃣ **Trading plan:**
⛔ Regarding the trend, everything is still in an increasing price structure. However, the price reaction at the old peak area and the market's upward momentum have "cooled down", so any possibility can happen and is mentioned in the H1 Plan
✅ In my personal opinion. The price line is likely to have an adjustment to gain momentum to overcome the old resistance zone. However, the structure has not been confirmed yet, so we still focus on finding opportunities to place BUY positions in accordance with the main trend of the market.
💪 **Wishing you successful trading!**
📌 For any questions, please contact us directly. I am ready to answer you for free
👉 Follow me to see the results

BTC - Book Profits to re enter at lower priceThe much-awaited action from new president is getting delayed and it has caused bitcoin price to get rejected at previous high or not willing to spike up further. The much-wished banana spike does still not come. when we draw lines and see price is about to see small correction now. Its not safe to take fresh shorts but its good and safe to book profits now for sure. It will help to re enter at lower price below 98 or 92 K if it comes and any small lower levels compared to price at 107 or 106 K now. Take your own decision and any news from president office will move the price swiftly on either side. If you do not wish to take risk of losing your positions may hold on for days and do not mind missing the volatility opportunities.

BTC futures live analysis for 16 jan 2025BTC futures chart creating head and shoulder pattern & break down is expected.
But Overview will be changed if price breaks & sustain above resistance sharp Upmove will b expected

Bitcoin Price Analysis: Key Zones to Watch on the 4-Hour ChartWhat is Happening in the Chart?
1. Resistance and Supply Zone (Order Block): Bitcoin is approaching a significant bearish order block (red zone) near the $100,000 mark. This area represents resistance where sellers may take control, pushing the price downward.
2. Potential Retracement: Before continuing its upward trend, Bitcoin may retrace to fill the fair value gap (FVG) and test the 0.5-0.618 Fibonacci retracement levels. These zones are historically strong areas for buyers to re-enter the market.
3. Support and Demand Zone: The bullish order block (green zone) near $92,000 aligns with the retracement zone. This is where Bitcoin might find strong support before resuming its upward trajectory.
Outlook for BTC/USDT
The chart predicts a potential pullback to $92,000-$95,000, followed by a bullish rally aiming to break through resistance at $100,000. If Bitcoin clears the bearish OB, the price could target new highs, potentially surpassing $105,000.
Key Levels to Watch:
Resistance: $100,000 (Bearish OB)
Support: $92,000-$95,000 (Bullish OB and Fibonacci zone)
---
Disclaimer:
This analysis is for informational purposes only and does not constitute financial advice. Cryptocurrency markets are highly volatile, and trading involves significant risks. Always conduct your own research or consult with a financial advisor before making any trading decisions.

**Scenario for BTC**1️⃣ **Fundamental analysis:**
📊 Nonfarm data last weekend was good for the USD and impacted the interest rate cut policy. It is likely that we will have to wait until June for the next interest rate cut.
📉 Current market sentiment is affected by this information, plus the recent sharp increase in BTC price has made many people doubt the momentum to continue to increase to a higher price range. Therefore, the increase has temporarily slowed down.
2️⃣ **Technical analysis:**
🔹 **Week frame:** Last week closed not very optimistically when the price reacted badly at the resistance zone of 101k~104k.
🔹 **Frame D:** The price structure is also not good when there are 2 peaks with the latter peak lower than the previous peak. The price is approaching the support zone but there is no clear reaction, it is likely to adjust to a lower support zone.
🔹 **H4 frame:** Based on the Zigzag line, we can see the classic head-and-shoulders pattern. At this time, we should not catch the bottom when the price has created a lower peak, showing that the market sentiment is no longer interested in the possibility of BTC's price increase.
3️⃣ **Trading plan:**
✅ If you have a **SELL** order in a good position, congratulations! 🎉 You can absolutely wait for a better profit when BTC is likely to break the current support zone to reach the next support zone of 85~86xxx.
⛔ **Absolutely do not BUY** at the present time, when the price structure shows a short-term downtrend.
💪 **Wish you successful trading!** 🚀

Bitcoin Bearish View Bitcoin Going On Trend HL LH
If Break 92000 Level Its Going Down Somthing 88000

Bitcoin Analysis Yesterday, we didn’t get a clear breakout and the market remains stuck between two level like forming red green pattern.
This chart shows the Bitcoin-to-USD (BTC/USD) price action, likely on the 1-hour timeframe, with indications of a potential bearish movement. Here’s a quick analysis based on the provided image:
Key Observations:
1. Current Price: The price is around $94,921, showing a slight decline (-0.23%).
2. Ascending Channel: The chart indicates a rising channel (black trendlines) that is nearing its upper boundary, suggesting potential exhaustion of the upward momentum.
3. Resistance Zone: A purple rectangle marks a resistance area where the price has struggled to break through.
4. Bearish Rejection and Projection:
• The price appears to be consolidating near the upper trendline but lacks strong bullish momentum.
• An arrow indicates a potential breakdown from the channel, aiming toward lower levels around $93,000.
5. CCI Indicator:
• The Commodity Channel Index (CCI) shows a decline from overbought territory (above 100), indicating bearish momentum could be building.
Potential Scenario:
• Bearish Breakdown: If the price breaks below the ascending channel, it could test the $93,000 level or even lower to the $92,000 support zone.
• Invalidation: If the price breaks above the resistance zone and holds, the bearish outlook would be invalidated, leading to further upward movement.
Trading Suggestion:
(Don’t follow me blindly as I am not a certified trader)
• Consider short positions if the price breaks below the channel and confirms with volume or candlestick patterns.
• Monitor support zones near $93,000 and $92,000 for potential profit-taking or reversal signals.
• Place a stop-loss above the resistance zone to manage risk.

BTCUSD SHOWING A GOOD UP MOVE WITH 1:6 RISK REWARD BTCUSD SHOWING A GOOD
UP MOVE WITH 1:6 RISK REWARD
DUE TO THESE REASON
A. its following a rectangle pattern that stocked the market
which preventing the market to move any one direction now it trying to break the strong resistant lable
B. after the break of this rectangle it will boost the market potential for break
C. also its resisting from a strong neckline the neckline also got weeker ald the price is ready to break in the outer region
all of these reason are indicating the same thing its ready for breakout BREAKOUT trading are follws good risk reward
please dont use more than one percentage of your capitalfollow risk reward and tradeing rules
that will help you to to become a bettertrader
thank you

BTCUSD Friday Analysis Bitcoin chart update
If we gave bitcoin yesterday the level we gave, then we gave a move of 3900 points from there, today that level is broken and the side is coming down.
Below is again a support level
#btcusd #bitcoin
