Intraday Trading vs Swing Trading🕐 1. What is Intraday Trading?
Intraday trading (also called day trading) is all about buying and selling stocks within the same day. That means you enter and exit the trade before the market closes—no matter what.
You're not holding positions overnight. You’re just capturing small price moves during the trading day.
Example:
Let’s say you buy 100 shares of Reliance at ₹2,800 at 10:00 AM and sell them at ₹2,820 by 1:30 PM. That’s an intraday trade—you made a quick profit in a few hours.
🕓 2. What is Swing Trading?
Swing trading means holding a trade for a few days to a few weeks. You’re not looking for quick moves, but for slightly longer trends in the stock price.
Swing traders try to catch a “swing” in price—that could be an upward trend or a downward trend.
Example:
Let’s say you buy HDFC Bank at ₹1,450 on Monday after seeing a bullish chart. Over the next 5 days, it moves up to ₹1,520. You sell it on Friday. That’s swing trading.
⚙️ 4. Tools & Strategies Used
🔸 Intraday Trading Tools:
5-min, 15-min candlestick charts
Indicators: VWAP, RSI, MACD, Supertrend
News-based scalping
Volume spikes
Price action patterns (breakouts, breakdowns)
🔹 Swing Trading Tools:
Daily & 1-hour charts
Indicators: RSI (14), MACD, Bollinger Bands
Chart patterns: Cup & Handle, Flag, Head & Shoulders
Support-resistance levels
Sector rotation or earning-based moves
📈 5. Pros & Cons of Intraday Trading
✅ Pros:
No overnight risk (no worries about global news hitting your stock overnight)
Frequent opportunities to make quick profits
Capital can be reused multiple times a day
Brokers offer high leverage (low capital, high exposure)
❌ Cons:
Very stressful and time-consuming
Needs fast decision-making and discipline
Big losses can happen quickly without proper stop-loss
Overtrading is a common trap
📊 6. Pros & Cons of Swing Trading
✅ Pros:
No need to watch charts all day
Ideal for people with jobs or other commitments
Less emotional pressure
More room for trend to play out
Works well in trending markets
❌ Cons:
Overnight risk from gap-ups or gap-downs
Requires patience—sometimes no trades for days
Wider stop-loss may mean higher losses if wrong
May miss fast intraday opportunities
💡 7. Who Should Choose What?
🧠 Choose Intraday Trading if:
You can dedicate 5–6 hours a day to watching the market
You are fast with decisions and execution
You can handle pressure, speed, and losses
You are ready to follow strict discipline and exit rules
You're okay with small profits (and small losses) daily
💼 Choose Swing Trading if:
You have a job or business and can't watch the market all day
You’re okay with holding stocks overnight
You prefer calm trading and less screen time
You're okay with waiting days or weeks for a trade to work out
You want to combine technical + some fundamental analysis
💸 8. Real-World Example
Imagine two friends, Rahul and Neha.
Rahul is an intraday trader. He sits in front of 3 screens from 9:15 to 3:30. He trades 5–10 times a day. Some days he makes ₹2,000, some days he loses ₹1,500. He needs to be sharp, fast, and emotionally strong.
Neha is a swing trader. She checks charts at night, finds 1–2 good stocks, and places limit orders. She holds her positions for 5–7 days. Her average profit is ₹5,000 per trade, but she takes fewer trades.
Both are traders, but with different lifestyles and psychology.
🧮 9. What About Brokerage and Tax?
Intraday trading has higher brokerage and STT (Securities Transaction Tax) due to frequent trades.
Swing trading involves delivery trades, so less brokerage but includes DP charges and short-term capital gains tax if held under 1 year.
🛠️ 10. Can You Do Both?
Yes! Many experienced traders use both styles:
Intraday for quick income and excitement
Swing for slower, more stable profits
But if you're a beginner, it’s best to pick one style and master it before mixing.
✅ Final Conclusion
There’s no winner between intraday and swing trading — both work when done with planning, discipline, and a solid strategy.
👉 Choose intraday if you enjoy speed, adrenaline, and real-time action.
👉 Choose swing if you prefer peace, patience, and flexibility.
Both require:
Risk management
Emotional control
Strategy and learning from mistakes
Your personality, time availability, and goal will tell you which path is best.
Bitcoinusd
Technical Analysis vs Fundamental AnalysisWhat’s the Difference?
When people analyze stocks or any tradable asset, they usually follow one of two main approaches: Technical Analysis or Fundamental Analysis. Each one is like using a different lens to look at the same object. Both methods try to answer the same question:
“Should I buy, sell, or avoid this stock?”
But how they arrive at that answer is completely different.
1️⃣ What is Technical Analysis?
Technical Analysis is all about reading charts. It’s based on the belief that everything that affects a stock's price is already reflected in the stock price itself.
So instead of reading about a company's earnings or business strategy, technical analysts look at price movements, trading volumes, and patterns on charts to try to guess what might happen next.
How It Works:
Technical traders believe that history repeats itself.
Price moves in trends — up, down, or sideways.
Patterns like flags, triangles, and head-and-shoulders are seen as hints.
Indicators like RSI (Relative Strength Index), MACD (Moving Average Convergence Divergence), and moving averages are used to make decisions.
Key Concepts in Technical Analysis:
Candlestick Patterns: These show how the price moved in a given time — whether buyers or sellers were in control.
Support & Resistance: Support is a price level where a stock tends to stop falling. Resistance is where it often stops rising.
Volume: Helps you understand the strength behind a price movement.
Breakouts & Reversals: Important signals that indicate possible trend changes.
Real-Life Example:
Let’s say Stock A is trading at ₹500. It has bounced from this price three times before. That level becomes a support. If it suddenly jumps above ₹550 with high volume, that could be seen as a breakout, and a trader might enter a short-term position.
Pros of Technical Analysis:
Helpful for short-term trading like intraday or swing trades.
Fast decision-making based on visual cues.
Doesn’t require knowledge of a company’s financials.
Can be used across all asset classes (stocks, forex, commodities, crypto).
Cons of Technical Analysis:
It doesn’t look at what the company actually does.
False signals can mislead.
It works on probability — not certainty.
Can be overwhelming with too many indicators.
2️⃣ What is Fundamental Analysis?
Fundamental Analysis is like doing background research on a company before deciding whether to invest in it. Instead of looking at charts, you look at the company’s financial health, industry conditions, economic trends, and management quality.
The main goal is to find the true value (intrinsic value) of a stock and compare it with the current market price.
How It Works:
If the intrinsic value is more than the market price, the stock is considered undervalued and worth buying.
If the market price is more than the intrinsic value, it’s seen as overvalued, and better to avoid or sell.
Key Tools of Fundamental Analysis:
Financial Reports: Balance Sheet, Income Statement, Cash Flow Statement.
Ratios: PE (Price-to-Earnings), ROE (Return on Equity), Debt-to-Equity, EPS (Earnings Per Share).
Company's Business Model: What the company does, how it earns, and whether it's sustainable.
Management Quality: Experience and vision of the leadership.
Industry & Economy: Is the industry growing? Are economic conditions favorable?
Pros of Fundamental Analysis:
Ideal for long-term investment.
Helps understand the actual business you’re putting money into.
Less affected by short-term volatility.
Encourages rational decision-making.
Cons of Fundamental Analysis:
Takes time and effort to study.
May not tell you when exactly to buy or sell.
Requires understanding of finance, economics, and accounting.
Stock may stay undervalued for a long time despite good fundamentals.
✅ Which One Should You Choose?
It all depends on your personality, goals, and time commitment.
Go for Technical Analysis if:
You’re active and want to trade daily or weekly.
You like working with patterns and visuals.
You want to time your entry and exit precisely.
You are okay with taking risks for quick gains.
Go for Fundamental Analysis if:
You think long-term and want to build wealth.
You want to invest in solid companies.
You have patience and a stable mindset.
You prefer logic and numbers over charts.
⚖️ Can You Combine Both?
Yes, and that’s what many experienced market participants do.
This combined approach is called techno-fundamental analysis.
For example:
You use fundamentals to select a good company.
You use technicals to find the right entry point.
This way, you get the best of both worlds.
🧠 Final Thought
There’s no universal rule that says one method is always better. It’s all about what suits your style and objective.
If you’re building a portfolio for retirement or wealth over 10+ years, fundamental analysis is your friend.
If you want to trade actively and spot market opportunities daily or weekly, technical analysis is the way to go.
Over time, learning both will make you a more flexible and better-informed market participant.
Advance Option Trading💼 Advance Option Trading
Advance Option Trading is the next level of trading options — where strategies go beyond simple buying of calls and puts. It involves using multi-leg strategies, understanding the Greeks, managing volatility, and hedging risk like professionals do.
This level of trading is used by experienced traders, institutions, and fund managers who want to take advantage of market complexity, pricing inefficiencies, and risk-reward opportunities in a calculated way.
🔧 What You Learn in Advanced Option Trading:
⚖️ Multi-leg strategies:
Spreads (Bull/Bear, Debit/Credit)
Iron Condors 🕊️, Butterflies 🦋, Straddles & Strangles 🔄
Calendar spreads 🗓️ and Diagonal spreads ➕
🧠 Options Greeks Mastery:
Delta (directional risk)
Theta (time decay)
Vega (volatility sensitivity)
Gamma & Rho (rate of change and interest rate risk)
📈 Volatility Trading:
Learn to trade Implied Volatility (IV) vs. Historical Volatility (HV)
Use volatility crush during earnings
Find edge in IV skew and term structure
🛡️ Hedging and Portfolio Management:
Use options to protect investments
Manage long-term positions with short-term trades
Build delta-neutral portfolios that profit in any direction
🧩 Why It’s Powerful:
🧮 Offers custom risk-reward setups
🔄 Allows you to profit in all market conditions (up, down, sideways)
🎯 Gives you precision control over market exposure
💰 Generates income through strategies like covered calls and credit spreads
🛡️ Helps hedge large portfolios or speculative positions safely
📌 In simple words:
Advanced Option Trading is like playing chess in the financial markets — it’s strategic, thoughtful, and designed to give you an edge over ordinary traders. You don’t just guess direction; you plan for every move the market can make.

Institutional Trading🏦 Institutional Trading
Institutional Trading refers to the buying and selling of large volumes of financial assets by big organizations such as banks 🏛️, hedge funds 📊, mutual funds 💼, pension funds 💰, and proprietary trading firms. These trades are typically high in value and are executed with sophisticated strategies, tools, and market access that retail traders don’t have.
Institutional traders use:
📈 Advanced algorithms
🧠 Data-driven analysis
💹 Block orders
🔍 Deep market research
🛡️ Strong risk management systems
Because of their size and influence, institutional trades can impact market prices, create liquidity zones, and often set the trend for retail traders to follow.
📌 In simple words:
Institutional Trading is how the "big players" move the markets — strategically, in high volume, and with professional precision.

Option Trading📘 Option Trading
Option Trading is a type of trading where you buy and sell contracts called options, instead of directly buying stocks. These contracts give you the right (but not the obligation) to buy or sell an asset at a set price within a specific time.
There are two main types:
🟢 Call Option – Right to buy the asset
🔴 Put Option – Right to sell the asset
Traders use options to:
📈 Make profits from price movements
🛡️ Hedge their investments
💰 Generate consistent income
⚖️ Manage risk with limited capital
Options are powerful because they offer leverage (small investment, big potential), but they also come with higher risks if not used carefully.
📌 In simple words:
Option Trading lets you bet on whether a stock will go up 📈 or down 📉, without owning it — and helps smart traders manage risk and reward like a pro.

Master Institutional Trading🎯 Master Institutional Trading
Master Institutional Trading means learning to trade like the top financial institutions – with precision, strategy, and data-driven decisions. It’s the highest level of trading where you think and act like banks 🏦, hedge funds 📊, and investment firms 💼.
This mastery involves:
🔍 Understanding how smart money moves
📈 Analyzing volume, liquidity zones, and order flow
💹 Executing large trades without impacting the market
🛡️ Applying risk-controlled option & futures strategies
🧠 Using advanced tools, indicators, and market depth
🔄 Adapting to news, events, and institutional triggers
To master this skill, traders must develop:
📊 Strong technical + fundamental analysis
🧘 Discipline and emotion control
🧾 A solid, backtested trading system
💬 Knowledge of macroeconomic impacts
🧮 Command over greeks, derivatives, and hedging
📌 In simple words:
Mastering Institutional Trading means stepping into the shoes of the pros – learning how the big money operates, and trading with structure, edge, and confidence.

Technical Class📚 Technical Class
A Technical Class in trading is a structured learning program focused on teaching you how to read and analyze price charts 📈, indicators 📊, and market patterns 🔁 to make smart and profitable trading decisions.
In a good technical class, you’ll learn to:
🔍 Read candlestick charts like a pro
🧱 Identify support & resistance levels
📉 Spot breakouts, fakeouts, and trend reversals
🔄 Use moving averages, RSI, MACD, and volume tools
🧠 Understand market psychology through patterns
📌 Time your entry and exit points with precision
⚖️ Combine multiple indicators for confirmation
These classes are perfect for:
🚀 Beginners who want to build a strong foundation
📈 Intermediate traders ready to sharpen their skills
🎯 Anyone looking to trade based on logic, not emotion
📌 In simple words:
A Technical Class teaches you how to "read the market" — using charts, patterns, and indicators — so you can trade with confidence, clarity, and strategy.

Trading Master Class With Experts🎓 Trading Master Class With Experts
The Trading Master Class With Experts is a premium learning experience designed to take your trading skills to the next level by learning directly from market professionals – traders who’ve been in the game, seen the cycles, and built real strategies that work. 💼📈
In this expert-led masterclass, you will:
📊 Learn From Real Market Experts
🧠 Gain insights from institutional traders, analysts, and full-time professionals
🔍 Watch live trading sessions, analysis, and decision-making
🎯 Understand the logic behind high-probability trades
🔄 See how pros adapt to changing markets in real time
🔧 Master Advanced Trading Skills
📉 Deep dive into technical and fundamental analysis
💹 Learn options, futures, and multi-asset strategies
📍 Build a risk-managed trading system from scratch
⚙️ Use institutional tools: order flow, volume profiles, and price action
🛡️ Get Mentorship & Community
👥 Join a private trading community
💬 Get answers in live Q&A sessions
📈 Share progress, refine skills, and grow with a pro network
📌 In simple words:
The Trading Master Class With Experts is where serious traders learn the real rules of the game — directly from those who play it at the highest level.

Meme Stocks & Retail MomentumIn the last few years, the world of stock markets has witnessed something unusual. Stocks of struggling companies suddenly skyrocketed, not because of strong fundamentals or big institutional investments, but because of... memes, social media posts, and retail trader hype.
Welcome to the world of Meme Stocks and Retail Momentum.
This isn’t traditional investing. It’s the new-age, internet-powered way of moving markets — often driven more by emotion and community than by earnings reports or financial analysis.
They are not driven by traditional factors like strong balance sheets, industry leadership, or earnings growth. Instead, they’re driven by community hype and retail investor activity.
Key Features of Meme Stocks:
Sudden, dramatic price surges 🚀
Lots of trading activity by small/retail investors
Heavy buzz on social media & forums
High volatility (prices can jump or crash in hours)
Often targeted by short-sellers
🎯 Real-Life Examples of Meme Stocks
1. GameStop (GME) – USA
In early 2021, GME went from $17 to nearly $483 in weeks. Why?
It was heavily shorted by hedge funds.
Reddit users decided to push back and caused a short squeeze.
Retail investors coordinated buying, sending the price to the moon.
This was a social movement, not just a trade. It became a battle between “small traders” and “Wall Street giants.”
2. AMC Entertainment (AMC)
A struggling cinema chain during COVID saw its stock go up over 1000% in months.
Why?
Meme hype
Reddit army
FOMO (Fear of Missing Out)
3. Bed Bath & Beyond, Blackberry, Nokia
All had their moment as meme stocks even if their business fundamentals were weak.
4. Indian Examples
While India hasn’t seen the exact same meme stock culture, we’ve seen similar retail momentum in:
Zee Entertainment (after merger news & social buzz)
Vodafone Idea (VI) – due to social campaigns and hopes
IRCTC – when people piled in during rapid rallies
👥 What is Retail Momentum?
Now let’s talk about retail momentum — the force behind meme stocks.
Retail Momentum means:
A sudden inflow of buying (or selling) from small, individual investors, usually following trends or hype.
This momentum is usually:
Fast-moving
Emotional
Trend-following
Influenced by influencers, YouTubers, or social forums
Retail traders often follow:
WhatsApp groups
YouTube tips
Trending stocks on Twitter
Telegram pump groups
When thousands (or lakhs) of people chase the same stock, price moves dramatically — even if there's no news or earnings change.
🤖 How Social Media Creates Market Movement
Social media has turned into a financial battleground.
Here’s how a meme stock or retail wave starts:
One user posts a chart, theory, or meme on Reddit, X, or Telegram.
It goes viral. Thousands like or comment.
YouTubers make videos explaining how it can go “5x”.
Traders start piling in.
Price moves rapidly.
News channels pick it up.
Even more retail investors join.
The price spikes even further.
At this point, the stock is not rising on logic. It's rising on human emotion and network effect.
📈 Why Do Meme Stocks Go Up So Fast?
Short Squeezes
Hedge funds or big players short the stock.
Retail investors aggressively buy.
Short sellers are forced to cover — which pushes the price up further.
FOMO (Fear of Missing Out)
When people see others making 100%, 200% in days, they panic and enter at any price.
Retail Buying Power
Today, thanks to apps like Zerodha, Robinhood, Upstox, Groww — it’s easy to buy a stock.
Even a small investor can join in with ₹500.
Community Psychology
People feel like part of a movement.
They hold, buy, and even defend the stock online — often calling it “diamond hands.”
💣 Why Do Meme Stocks Crash?
No Fundamental Support
Eventually, reality hits. The stock isn’t worth the inflated price.
Profit Booking
Early traders book profits → price falls → panic spreads → others sell.
Regulatory Actions
Exchanges might restrict buying (like Robinhood did in GME).
Dilution
Companies issue new shares to cash in on hype → lowers value per share.
🧠 Psychology Behind Meme Stocks
Meme stocks are a human behavior experiment in real-time.
They show:
The power of belief
Herd mentality
Rebellion against institutions
Internet unity
Addiction to risk and gambling thrill
It’s part social movement, part financial play, and part crowd psychology.
🧰 Tips for Trading Retail Momentum Stocks
Enter early or don’t enter at all
Don’t jump in when it's already trending on YouTube.
Use trailing stop-loss
Lock your profits as the stock climbs.
Book profits partially
Don’t wait for the “moon.” Sell in phases.
Avoid margin/leverage
You can be wiped out in one bad move.
Track social buzz
Use tools like Google Trends, Twitter hashtags, Reddit mentions.
Never invest your main capital
Treat it as a speculative side bet, not a long-term investment.
🏁 Final Thoughts: Meme Stocks Are a Mirror of Modern Markets
Meme stocks and retail momentum are not going away. They are part of the new-age investor culture:
Fast-paced
Emotionally charged
Social media influenced
Sometimes logical, often not
They’ve changed how people see the markets. Retail investors now know they can move prices. But with that power comes great risk.
If you want to explore meme stocks, do it with eyes wide open, a small budget, and full acceptance of the risk.

BANKNIFTY 1D Timeframe📉 Bank Nifty – Daily Overview (as of July 25, 2025)
Opening Price: Around 57,170
Day’s High: Around 57,170
Day’s Low: Around 56,439
Closing Price: Approximately 56,520
Net Change: Down by around 545 points (–0.95%)
🕯️ Candlestick Pattern (1D Chart)
The daily candle is bearish with a long upper wick and small lower wick.
This indicates strong selling pressure from the opening level.
The index failed to hold the highs and reversed sharply during the session.
🔍 Key Technical Zones
Level Price Range
Support 56,500 – 56,400
Next Support 56,150 – 56,000
Resistance 57,200 – 57,300
Major Resistance 57,500 – 57,650
If Bank Nifty breaks below 56,400, it may slide further toward 56,000 or even 55,800.
A move above 57,300 may invite bullish momentum.
📊 Trend & Technical Outlook
Short-Term Trend: Bearish
Medium-Term Trend: Neutral to mildly positive (if above 56,000)
Price Structure: Lower highs are forming; a descending pattern is developing.
Volume Analysis: Increasing volume on red candles suggests sellers are active.
Indicators (general behavior):
RSI may be near 50–55 range — neutral zone.
MACD likely showing bearish crossover.
Moving averages are flat to slightly negative.
✅ Strategy Suggestions
For Swing Traders:
Look for a bullish reversal pattern near 56,400–56,150 zone for possible long entries. Avoid long positions until price shows strength above 57,200.
For Breakdown Traders:
Wait for a solid close below 56,400 with high volume. Target levels can be 56,150 and 55,800.
For Intraday Traders:
Expect a volatile range between 56,400 and 57,200. Trade breakouts or reversals near these levels with confirmation.
📌 Summary
Bank Nifty is currently weak, with clear selling from resistance levels.
It is trading near key support (56,500–56,400). If this zone breaks, expect further downside.
Bulls need to reclaim 57,200+ for any reversal signals.
Trend remains bearish in short term, neutral in medium term.

Institutional Intraday option Trading🔶 What is Institutional Intraday Options Trading?
Institutional Intraday Options Trading is how big players (institutions) like hedge funds, proprietary trading firms, mutual funds, foreign institutional investors (FIIs), and domestic institutional investors (DIIs) actively trade in options markets within the same day to generate quick profits, manage large positions, or manipulate price movements in their favor.
Unlike retail intraday trading (which is usually based on tips, indicators, or scalping), institutional intraday options trading is based on:
Advanced option data (like OI, volume, IV)
Market structure and liquidity
Algo-based executions
Risk-adjusted strategies and fast decision making
Institutions don’t trade for fun or luck—they trade with purpose, plan, and size. Their presence in the market creates price movements, and learning to track their footprints gives retail traders a powerful edge.
🔶 Why Institutions Trade Options Intraday?
Institutions prefer intraday option trading because it allows them to:
✅ Manage Risk & Hedge Positions
Institutions often hold large equity/futures positions. Options allow them to hedge intraday volatility without disturbing their long-term positions.
✅ Scalp Based on Volatility and News
Events like RBI policy, Fed data, results, or global news create fast-moving markets. Institutions use intraday options to take advantage of volatility spikes.
✅ Generate Quick Alpha
Institutional traders are expected to generate consistent returns. Intraday option trades provide high leverage and faster capital rotation.
✅ Exploit Liquidity and Traps
Institutions use fake breakouts, premium decays, and short-covering rallies to trap retailers and make profit intraday.
📌 1. Premium Decay Strategy (Theta Game)
Objective: Sell options when implied volatility is high.
Institutions sell both call and put options (straddle or strangle) around key zones (like CPR, VWAP).
They collect premium and profit from time decay as long as the market stays in range.
✅ Works well in sideways markets (common post-gap days or after big moves).
🎯 Focus: Short Straddle / Short Strangle near key levels
📌 2. Directional Option Buying (with Risk Control)
Objective: Ride fast moves using OTM options
Institutions buy deep OTM options when they expect sudden movement due to:
Breakout + OI unwinding
Short covering rally
News trigger or liquidity sweep
But they:
Use tight stop-loss, and
Enter near liquidity zone, not after the breakout
🎯 Focus: Volume + OI Shift + IV Expansion
📌 3. Scalping with Delta-Neutral Strategies
Objective: Profit from small intraday movements without market direction bias.
Example:
Sell ATM Call + Buy slightly OTM Call (Call Ratio Backspread)
Profit when price breaks in either direction and IV increases
🎯 Focus: Neutral strategy + quick reaction to movement
📌 4. Trap and Reverse (Liquidity Play)
Objective: Trap retailers near breakout/fakeout and reverse
Steps:
Identify large open interest buildup at a strike.
Price spikes above that level and then quickly reverses.
Institutions initiate the opposite side—profit from panic exits.
🎯 Focus: Option chain + sudden volume spike + reversal candle
📌 5. Hedged Position for Intraday Spike
Example Setup:
Buy Nifty 22500 CE + Sell 22700 CE
Risk defined, cheap entry, and profits from quick momentum.
Used during:
Event days
News expectations
VIX spikes
🎯 Focus: Defined risk with high reward if breakout happens
🔶 Institutional Footprints in Options
Here’s how to detect institutional presence:
✅ Sudden spike in option volume without news
✅ Aggressive unwinding near key levels
✅ High IV in far OTM options (possible trap)
✅ Large quantity buying/selling in illiquid strikes
✅ Price rejecting exact levels (like round numbers, day high/low)
🔶 Real Example of Institutional Intraday Option Play
Let’s say it’s Thursday (weekly expiry). Nifty is at 22500.
Retailers:
Start buying 22500CE, expecting a breakout.
Institutions:
Let price go up to 22540, triggering all CE entries.
Institutions sell huge lots of 22500CE with rising OI.
Nifty reverses to 22460. CE premium crashes.
Result:
Retailers lose.
Institutions profit via option writing and liquidity sweep.
🔶 How to Learn and Master Institutional Intraday Option Trading?
Step-by-step roadmap:
✅ Learn Option Chain Reading
Focus on OI shifts, strike buildup, and PCR.
✅ Understand Option Greeks
Especially Delta, Gamma, Theta, and Vega.
✅ Master Market Structure
Use price action, VWAP, volume profile, CPR.
✅ Practice Institutional Patterns
Liquidity grabs, stop hunts, traps, and reversals.
✅ Use TradingView or platforms like Sensibull, QuantsApp
For live data, OI heatmap, option analytics.
✅ Backtest with Replay Mode
See how institutions played in past events.
🔶 Bonus Tips for Retailers to Follow Institutional Moves
🧠 Always ask:
Who is trapped right now—buyers or sellers?
Is this a genuine breakout or just a liquidity grab?
What is option chain telling me?
🚫 Avoid:
Blind call/put buying without OI confirmation
Buying high IV options post move
Selling naked options in low capital

Institution Option Trading📌 1. Multi-leg Strategic Trades
Institutions rarely take single-leg naked options. They use advanced setups like:
✅ Vertical Spreads (Bull Call / Bear Put)
✅ Iron Condor / Iron Butterfly
✅ Calendar / Diagonal Spreads
✅ Ratio Spreads
✅ Box Spreads (riskless arbitrage)
These strategies offer:
Defined risk
Better reward-to-risk ratios
Controlled exposure to market direction and volatility
📌 2. Delta Hedging
Institutions holding large stock or futures positions hedge delta using options.
For example:
Holding ₹50 crore worth of Reliance shares
Buy Reliance PUT options to protect against fall
Or, dynamically sell call options as price rises to adjust exposure
This is called Delta Hedging, and it’s done in real-time using algorithms.
📌 3. Open Interest (OI) Tracking
Institutions use option chain OI to:
Spot support/resistance based on strike activity
Identify traps and short-covering zones
Detect institutional presence via unusual OI spikes
For example:
Sudden OI surge at 22,000 PE in Bank Nifty
Might indicate put writers protecting downside, expecting reversal
📌 4. Time Decay (Theta) Exploitation
Institutions are the real beneficiaries of theta decay.
They sell options (straddles, strangles, spreads) around key levels (like VWAP, CPR) and let time decay eat the premium.
Especially on:
Expiry day (Thursday in India)
After big moves
In range-bound markets
They deploy millions of rupees in premium-selling strategies to generate daily/weekly returns.
🔶 Institutional Option Strategies Explained
Let’s break down some common institutional strategies in real terms:
🔷 1. Short Straddle
Sell ATM Call and ATM Put at same strike
Works in sideways markets
Profits from time decay and low movement
✅ Used heavily by institutions on weekly expiry
✅ Risk: Sharp move in either direction
🔷 2. Bull Call Spread
Buy a lower strike Call
Sell a higher strike Call
Lower cost, limited risk & reward
✅ Used when institutions expect moderate bullish move
✅ Controlled exposure + reduced premium
🔷 3. Iron Condor
Sell OTM Call & Put
Buy further OTM Call & Put
Net credit strategy with limited risk
✅ Best in low volatility, non-trending markets
✅ Profitable if market stays between two levels
🔷 4. Calendar Spread
Sell near-term option
Buy far-month option (same strike)
Used when:
Near-term IV is high
Long-term view is neutral or unclear
✅ Profits from IV difference and time decay advantage
🔷 5. Protective Put
Holding equity or futures
Buy Put Option to insure position
Institutions use this to hedge large portfolios during high uncertainty (e.g., elections, war threats, Fed rate decisions)
🔶 Real Example – How an Institution Trades Nifty Options
Let’s say Nifty is at 22,000.
📊 Scenario:
IV is high
No major event ahead
OI buildup seen at 22000 PE and 22100 CE
📈 Institutional Strategy:
Sell 22000 PE and 22100 CE (Short Straddle)
Buy 21900 PE and 22200 CE (hedge legs)
Result:
If Nifty stays in range → theta decay = profit
If it breaks out → hedge legs protect loss
✅ Low-risk, smart premium capture strategy
🔶 Key Tools Institutions Use in Options Trading
Bloomberg Terminal (real-time global data)
Opstra / Sensibull / QuantsApp (for Greek/OI analysis)
Option Vega/IV scanners
Algo trading engines
Python/R-based custom backtesting engines
Retail traders can start by using TradingView + Sensibull/Opstra.
🔶 How to Learn Institutional Options Trading?
Here’s a step-by-step approach:
✅ Understand Options Basics – Calls, Puts, Moneyness
✅ Study Greeks Deeply – Delta, Theta, Vega, Gamma
✅ Learn Option Chain Analysis – OI, IV, Max Pain
✅ Explore Spreads & Multi-leg Setups
✅ Practice Risk Management & Position Sizing
✅ Track Institutional Behavior via OI shifts & volume
✅ Backtest Your Strategy before going live
🔶 Final Takeaways
Institutional Options Trading is not about guessing. It’s about data, structure, and risk.
Retail traders who try to copy institutions without understanding their objectives often get trapped.
But if you:
Study Smart Money behavior
Use strategic entries based on volume + volatility
Respect risk and capital preservation
…you can trade with the institutions, not against them.

Technical Class🧠 Why Learn Technical Analysis?
Because price is king.
All news, fundamentals, and economic data are already reflected in price. Technical analysis teaches you how to read price charts and anticipate movements—giving you the timing advantage.
Institutions, traders, and even algorithms rely heavily on technical levels. So if you want to:
Know when to enter/exit
Understand where big money is active
Manage risk smartly
Improve accuracy
…you need strong technical skills.
🔍 What Will a Good Technical Class Cover?
Let’s break this into 10 structured modules, explained in human-friendly language.
📘 1. Basics of Price Action
What is a chart? (Line, Bar, Candlestick)
Understanding OHLC (Open, High, Low, Close)
Why price is the most important factor
How price creates support, resistance, and trends
👉 Outcome: You’ll read any chart confidently.
📘 2. Candlestick Patterns
Single candlesticks: Doji, Hammer, Engulfing, Marubozu
Dual & triple candle patterns: Morning Star, Evening Star, Three Soldiers
Reversal vs Continuation patterns
👉 Outcome: You’ll know how to identify potential trend reversals or strength.
📘 3. Chart Patterns (Price Structures)
Reversal Patterns: Double Top/Bottom, Head and Shoulders
Continuation Patterns: Triangles, Flags, Pennants, Rectangles
Understanding Breakouts vs Fakeouts
👉 Outcome: You’ll recognize market structures and act before the move begins.
📘 4. Support and Resistance Mastery
How to identify major support/resistance levels
Role of historical price zones
Dynamic support/resistance using moving averages
Price reaction techniques
👉 Outcome: You’ll place entries and exits at the most strategic levels.
📘 5. Trend Analysis
What is a trend? (Uptrend, Downtrend, Sideways)
How to draw trendlines correctly
Role of higher highs & lower lows
Using Multiple Timeframe Analysis
👉 Outcome: You'll align trades with major trends like professionals do.
📘 6. Indicators & Oscillators
Moving Averages (SMA, EMA): Trend confirmation
RSI: Overbought/Oversold signals
MACD: Momentum and divergence detection
Bollinger Bands: Volatility breakout
Volume Profile / VWAP
👉 Outcome: You’ll combine indicators for confluence and higher accuracy.
📘 7. Intraday Technicals
Best indicators for intraday (VWAP, Supertrend)
Time-based chart usage (5m, 15m, 1hr)
Institutional trap zones (fakeouts, liquidity sweeps)
Scalping vs momentum setups
👉 Outcome: You’ll confidently take trades within the day using fast setups.
📘 8. Risk Management and Trade Psychology
Position sizing
Risk-Reward ratio planning
Importance of Stop Loss
Emotional control: Fear, Greed, Impatience
Creating a rule-based system
👉 Outcome: You’ll trade stress-free, without blowing up your capital.
📘 9. Advanced Institutional Concepts
Smart Money Concepts (SMC): Liquidity, Order Blocks, BOS/CHOCH
Institutional Order Flow: Where big money trades
Volume Spread Analysis
Wyckoff Theory (Accumulation/Distribution phases)
👉 Outcome: You’ll learn how institutions move the markets and how to follow them.
📘 10. Strategy Building and Backtesting
Creating rule-based strategies
Journaling trades and analyzing results
Backtesting on historical data
Live market application with confidence
👉 Outcome: You’ll develop your own strategy and remove guesswork.

Institutional Order Flow / Smart Money Concepts🚀 What is Institutional Order Flow?
Institutional Order Flow simply means tracking how big players are placing their buy and sell orders, and using that data to trade alongside them — not against them.
Big players can’t enter or exit in one go. If they do, they’ll move the market too much. So they:
Split their orders
Use liquidity zones
Create traps and fakeouts to fill their orders
Your job as a retail trader is to spot these footprints.
💡 Why is it Important?
Most retail traders:
Follow indicators
Chase breakouts
React late
Institutions:
Create liquidity traps
Use retail mistakes to enter their positions
Push price into zones that force emotional trading
By understanding Institutional Order Flow or Smart Money Concepts, you’ll stop being the one getting trapped—and start trading with the whales.
🔍 Key Concepts of Smart Money / Institutional Order Flow
Let’s now break down the core principles and tools.
1. Liquidity Zones
Institutions need liquidity — meaning many buyers or sellers to fill their orders.
They create fake breakouts, stop hunts, or news spikes to force retail traders to enter or exit — and then they do the opposite.
Example:
Price breaks above resistance — retail buys breakout
Institutions sell into that liquidity
Price reverses sharply = retail gets trapped
Your job: Identify where liquidity is sitting (above highs, below lows).
2. Breaker Blocks
A breaker block is an OB that failed, but now acts as the opposite side’s zone.
Example:
Price breaks bullish OB and comes back → now it acts as support.
Same with bearish OB → becomes resistance.
These show who is now in control — buyers or sellers.
3. Market Structure Shifts (MSS)
Smart money tracks structure, not indicators.
A Market Structure Shift happens when:
The trend breaks (HH → LL or LL → HH)
A new direction is confirmed
Institutions often wait for MSS before executing large orders.
Your job: Don’t jump in early. Wait for structure change to confirm smart money is switching sides.
4. Fair Value Gap (FVG)
An FVG is a price imbalance between candles — where price moved too fast, leaving a “gap” in liquidity.
FVG means:
A zone where institutions might revisit
Often gets “filled” later
Use for entries, targets, or rejections
How to spot: In a strong move, look between the first candle’s high and the third candle’s low (or vice versa) – this is your FVG.
5. Internal vs External Liquidity
Institutions use both:
External Liquidity = above highs / below lows (stop-loss areas of retail traders)
Internal Liquidity = inside the range (consolidation, breaker retests)
They:
Grab external liquidity
Fill internal orders
Then move price in their actual direction
This explains why breakouts fail — they were designed to!
🔁 Typical Smart Money Price Flow (Simple)
Accumulate (Sideways range)
Manipulate (Fake breakout or stop hunt)
Distribute (Strong move in real direction)
If you know this sequence, you can start trading the traps, not falling for them.
🛠 How to Trade Smart Money Concepts – Step by Step
Let’s bring it all together in a logical workflow:
✅ Step 1: Analyze Market Structure
On higher timeframes (1H, 4H, Daily), check:
Trend (bullish/bearish)
Breaks in structure (HH/LL change)
Are we in consolidation?
✅ Step 2: Identify Key Zones
Mark:
Order blocks (the last opposite candle before big move)
FVGs (imbalances)
Equal highs/lows (liquidity)
Swing points (for stop hunts)
✅ Step 3: Wait for Liquidity Grab
Watch for:
Wicks above highs or below lows
Aggressive moves into zones
Quick rejections
These are signs smart money is active.
✅ Step 4: Confirmation
MSS: Wait for structure to shift
Candle Confirmation: Engulfing, Break of structure candle
FVG Fill or OB tap
Only enter when confluence builds — not just one clue.
✅ Step 5: Risk-Managed Entry
Entry: After confirmation near OB or FVG
SL: Just outside OB/FVG
TP: Next liquidity zone or opposite OB
Always maintain minimum 1:2 RR.
😱 Common Mistakes Retail Traders Make
Trading breakouts blindly
Entering before confirmation (no MSS or candle clue)
Ignoring structure for indicators
Thinking OB is one candle – it's a zone
No patience – chasing price instead of letting price come to you
🎯 Why Institutions Need You to Lose
Yes — if you lose, they win.
Your stop-loss is their entry liquidity
Your breakout buy is their exit plan
Your emotional trading funds their smart entries
That's why they manipulate, trap, and fake moves to create liquidity.
But with knowledge of Institutional Order Flow — you flip the script.
💬 Final Thoughts
Institutional Order Flow / Smart Money Concepts aren’t a secret strategy — they’re simply a deeper understanding of how the market actually works.
Instead of being manipulated, you become the one who reads the manipulation.
It’s not about predicting the market — it’s about reacting to what smart money is doing, with patience, precision, and process.
Advanced Option StrategiesWhat are Options?
Before we dive into advanced stuff, here’s a quick refresher.
An Option is a contract that gives you the right (but not the obligation) to buy or sell a stock/index at a certain price, on or before a certain date.
There are 2 types:
Call Option – Right to BUY
Put Option – Right to SELL
Buyers pay a premium. Sellers receive a premium and take on the obligation.
💼 Why Use Advanced Strategies?
If you only buy calls or puts, you might:
Lose 100% of your capital quickly
Get the direction right, but still lose due to time decay
Suffer from high premiums or volatility crush (IV crush)
Advanced strategies help you:
✅ Reduce risk
✅ Lock-in profits
✅ Earn from sideways markets
✅ Trade during high volatility events
✅ Create income strategies
🧠 1. Bull Call Spread – Directional but Risk-Defined
Used when: You’re moderately bullish, but don’t want to spend too much on a call.
How it works:
Buy 1 ATM Call
Sell 1 higher strike OTM Call
Example:
Nifty at 22000
Buy 22000 CE @ ₹100
Sell 22200 CE @ ₹40
Net Cost = ₹60
Max Profit: ₹200 (22200–22000) – ₹60 = ₹140
Max Loss: ₹60 (net premium paid)
👉 This strategy caps your risk and reward but is cost-efficient and smart in range-bound bull moves.
🧠 2. Bear Put Spread – Controlled Downside Betting
Used when: You’re mildly bearish and want to control losses.
How it works:
Buy 1 ATM Put
Sell 1 lower strike Put
Example:
BankNifty at 48500
Buy 48500 PE @ ₹120
Sell 48000 PE @ ₹60
Net Cost = ₹60
Max Profit: ₹500 – ₹60 = ₹440
Max Loss: ₹60
👉 Ideal for limited downside moves — cheaper than naked Put.
🧠 3. Iron Condor – The Sideways Market King
Used when: Market is flat or expected to stay in a range.
How it works:
Sell 1 OTM Call + Buy 1 higher OTM Call
Sell 1 OTM Put + Buy 1 lower OTM Put
You make money if market stays between the 2 sell strikes.
Example:
Nifty is at 22500
Sell 22800 CE, Buy 23000 CE
Sell 22200 PE, Buy 22000 PE
👉 You collect premiums from both sides.
Max Profit = Net Premium
Max Loss = Difference between strikes – Net Premium
👉 Works great in expiry week or low-volatility phases.
🧠 4. Straddle – Big Move Expected, Direction Unknown
Used when: A major move is expected (news, event, earnings), but unsure about direction.
How it works:
Buy ATM Call and ATM Put of the same strike & expiry.
Example:
Stock at ₹500
Buy 500 CE @ ₹20
Buy 500 PE @ ₹25
Total Cost = ₹45
If stock moves big — say ₹60 or more either way — you profit.
👉 High risk due to premium decay if market stays flat.
Need volatility to spike.
🧠 5. Strangle – Cheaper than Straddle, Wider Range
Used when: You expect a big move but want lower cost than a straddle.
How it works:
Buy OTM Call and OTM Put (strikes wider apart than ATM).
Example:
Nifty at 22500
Buy 22800 CE @ ₹12
Buy 22200 PE @ ₹10
Total Cost = ₹22
You profit if the move crosses either strike + premium.
👉 Needs bigger move than straddle but less premium at risk.
🧠 6. Calendar Spread – Play with Time
Used when: You expect price to stay near a level short term, but may move later.
How it works:
Sell near-term option
Buy far-term option (same strike)
Example:
Sell 22500 CE (weekly) @ ₹50
Buy 22500 CE (monthly) @ ₹70
Net Cost = ₹20
👉 You make money if price stays near 22500 by expiry of short leg.
Profits from time decay of the short leg.
🧠 7. Ratio Spreads – Advanced Directional with a Twist
Used when: You expect a move in one direction, but want to reduce cost.
Bull Call Ratio Spread
Buy 1 lower Call
Sell 2 higher Calls
Example:
Buy 22000 CE @ ₹100
Sell 2× 22200 CE @ ₹60 each
Net Credit = ₹20
If market moves moderately up — you profit.
But if it rises too fast — risk increases.
👉 Suitable for experienced traders only — manage risk carefully.
🧠 8. Covered Call – Income Strategy for Investors
Used when: You hold stocks and want to earn extra income.
How it works:
Hold 100 shares of a stock
Sell 1 OTM Call
Example:
You own 100 shares of Reliance @ ₹2500
Sell 2600 CE @ ₹20
If Reliance stays below ₹2600, you keep the premium.
If it rises above ₹2600, your shares get sold, but you still profit.
👉 Perfect for long-term investors.
🧠 9. Protective Put – Insurance for Your Stock
Used when: You own shares but want downside protection.
How it works:
Hold stock
Buy 1 ATM/OTM Put
Example:
Own Infosys @ ₹1500
Buy 1480 PE @ ₹20
If stock falls below ₹1480, your loss is capped.
👉 It’s like buying insurance for your portfolio.
🧠 10. Butterfly Spread – Range-Bound Precision Strategy
Used when: You expect minimal movement and want low-risk, high-RR trade.
How it works (Call Butterfly):
Buy 1 lower strike Call
Sell 2 middle strike Calls
Buy 1 higher strike Call
Example:
Buy 22000 CE
Sell 2× 22200 CE
Buy 22400 CE
You earn if market expires at the middle strike.
Max loss = Net debit
Max profit = At middle strike
👉 Best for expiry day premium decay strategies.
Common Mistakes to Avoid
Not understanding strategy risk
Using high-margin strategies without protection
Overtrading in expiry week
Not adjusting trades as market moves
Ignoring volatility impact (IV crush)
🛠 Tools to Use
Option Chain (for strike selection)
IV (Implied Volatility) data
Open Interest (OI)
Strategy Builder platforms (e.g. Sensibull, Opstra, or TradingView)
🎯 Final Thoughts
Advanced options trading isn’t gambling — it’s about smart risk management.
These strategies:
Give you control
Limit losses
Provide flexibility across different market types
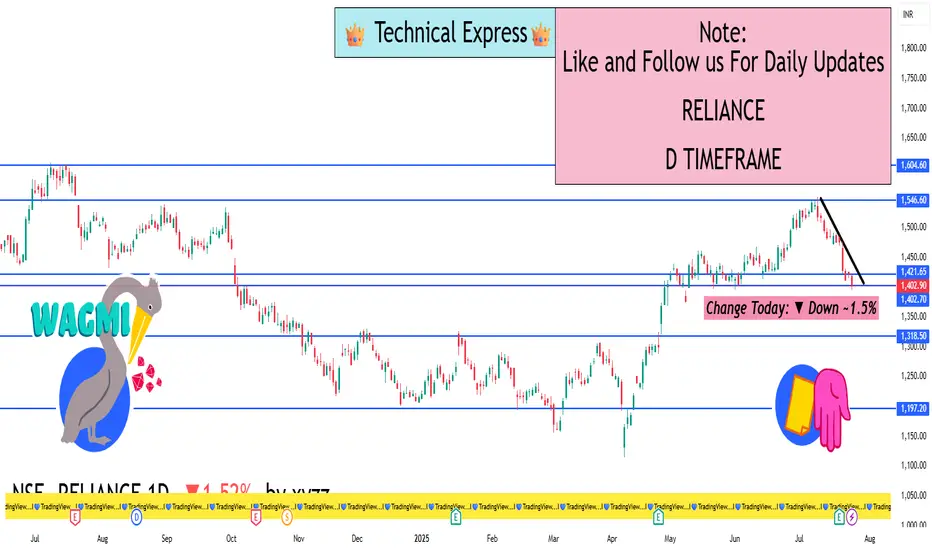
RELIANCE 1D TimeframeStock Data (1D Time Frame)
Current Market Price: ₹1,403 – ₹1,405 (Approx.)
Change Today: ▼ Down ~1.5%
Previous Close: ₹1,425
Day’s High: ₹1,427
Day’s Low: ₹1,398
52-Week High: ₹1,551
52-Week Low: ₹1,115
🧾 Intraday Performance Summary
Reliance opened mildly negative and continued a downward trend due to broader market weakness.
The stock touched an intraday low near ₹1,398 as profit-booking continued post its recent rally.
Despite reporting record profits in Q1, investor sentiment remains cautious due to underperformance in its Oil-to-Chemicals (O2C) and Retail segments.
🧠 Technical View (1-Day Time Frame)
Indicator Status
Trend Short-term Weak/Bearish
RSI (Relative Strength Index) Near 45 – slightly weak
Support Level ₹1,390 – ₹1,350 zone
Resistance Level ₹1,430 – ₹1,470
Volume Above average during dips
Stock is trading below key moving averages (20 and 50 DMA).
Break below ₹1,390 may lead to further correction toward ₹1,350.
Upside momentum may resume only if it breaks and sustains above ₹1,430–₹1,440 levels.
🧮 Fundamental Insights
💼 Q1 FY26 Highlights:
Net Profit: Around ₹30,783 crore, helped by a one-time gain from stake sales.
Core Business Growth: Adjusted profit growth (excluding exceptional items) is about 25% year-over-year.
Retail & O2C: Both divisions saw margin pressure despite revenue growth.
Jio Platforms: Continued to show strong performance through ARPU improvement and subscriber growth.
New Energy Segment: Investment in green energy, solar, and hydrogen tech continues to build momentum.
📈 Key Growth Drivers Ahead
Jio Expansion – Increased monetization from 5G and digital platforms.
Retail Scaling – Aggressive expansion through online + offline strategies.
Green Energy Push – Investments in solar panels, hydrogen energy, and battery storage to become significant in 2025–26.
Potential IPOs – Jio and Retail business listing possibilities can unlock value.
🛑 Risks to Watch
Pressure on global refining margins may continue to affect the O2C segment.
Delay in clean energy execution can lead to valuation stress.
Macro market correction or FII selling could drag heavyweights like Reliance.
🔮 Outlook
Short Term: Cautious-to-bearish unless ₹1,430 is reclaimed. ₹1,350 is a critical support.
Medium to Long Term: Remains fundamentally strong. New growth drivers (Jio, Retail, Energy) support a positive outlook beyond 3–6 months.
BTCUSD 1D Timeframe✅ Current Market Data
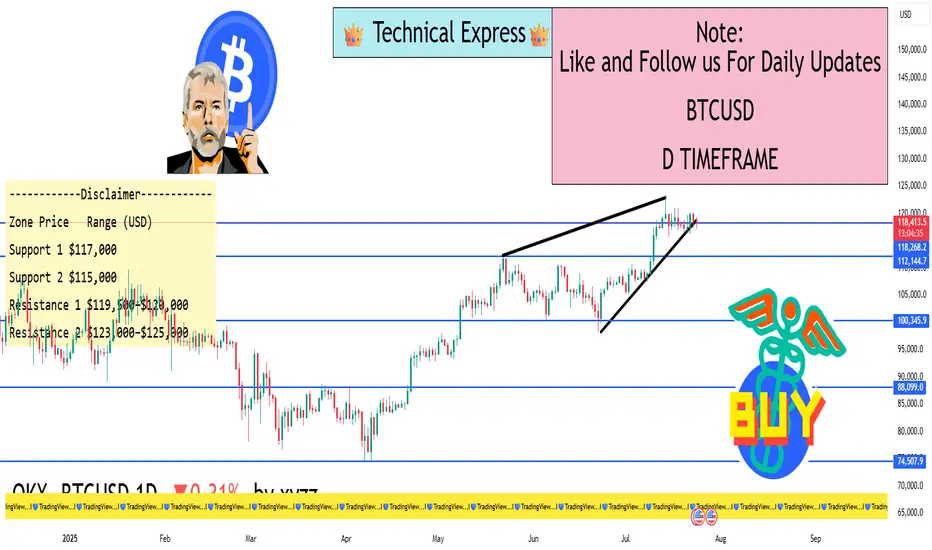
Current Price: ~$118,420 USD
Day’s High: ~$119,210
Day’s Low: ~$117,428
Previous Close: ~$118,004
Change Today: +$416 (around +0.35%)
📈 Price Behavior Today
Bitcoin is showing range-bound movement between $117K and $119K after a strong rally in the past few days.
The current price action suggests market indecision, with neither bulls nor bears taking clear control.
Momentum indicators are neutral, with RSI hovering around 52–55, indicating sideways consolidation.
🧠 Key Drivers Behind Price Action
Profit Booking: After recent rallies above $120K, traders are taking profits, keeping the price in check.
Strong Institutional Demand: ETFs and institutional buying continue to offer long-term support to Bitcoin.
Favorable Crypto Regulations: Recent developments in U.S. crypto policies are boosting confidence in Bitcoin as a store of value.
On-Chain Strength: Network health (hash rate, wallet activity, HODL behavior) remains strong, signaling long-term bullishness.
🔍 Technical Levels to Watch
Zone Price Range (USD)
Support 1 $117,000
Support 2 $115,000
Resistance 1 $119,500–$120,000
Resistance 2 $123,000–$125,000
A close above $120K could initiate a bullish breakout targeting $125K–$130K.
A fall below $117K may invite a deeper pullback toward $115K or even $111K in the short term.
🔄 Market Sentiment
Neutral-to-Bullish in the short term.
Strong Bullish in the long-term due to adoption, policy support, and demand.
Investors are cautiously optimistic, awaiting stronger volume and breakout confirmation.
🎯 Outlook Ahead
Short-Term View: Consolidation between $117K–$120K likely to continue unless a strong volume breakout occurs.
Medium-Term View: A confirmed move above $120K may push BTC toward new highs of $130K–$138K.
Risk Zone: If Bitcoin fails to hold $115K, it could enter a corrective phase down to $111K.
✅ Summary
Bitcoin is currently in a sideways consolidation phase, with strong support around $117K and resistance just below $120K. The broader outlook remains positive, but the market is waiting for a fresh trigger—either a breakout above $120K or a breakdown below $115K—for the next decisive move.
BANKNIFTY 1D Timeframe Key Data (as of early afternoon):
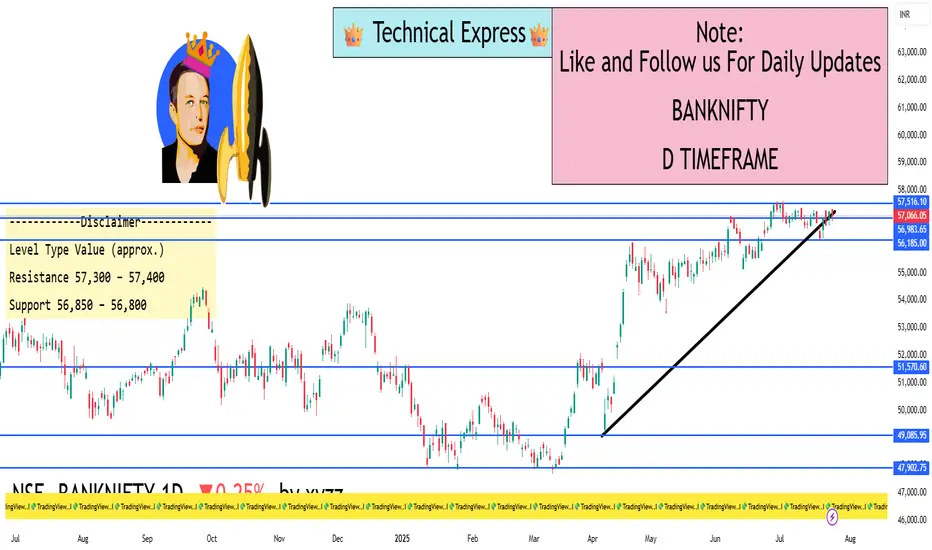
Current Price: ~57,080
Opening Price: 57,316
Day’s High: 57,316
Day’s Low: 56,851
Previous Close: 57,210
Net Change: –128 points (around –0.22%)
Intraday Price Action Summary
Bearish Start: Opened near the high and immediately faced selling pressure, especially in major private banks.
Dip to Support: Price dropped to 56,851, testing key intraday support.
Mild Recovery Attempt: Found some buying interest near the support but still trading below the day’s open.
📊 Technical Levels – 1D View
Level Type Value (Approximate)
Resistance 1 57,300
Resistance 2 57,600
Support 1 56,850
Support 2 56,500
Trend Bias Neutral to Bearish
RSI Level (Est.) 48–50 (sideways zone)
A break above 57,300 could resume bullish momentum.
A fall below 56,800 may extend the decline toward 56,500.
Why Bank Nifty Is Weak Today
Profit Booking: After recent gains, traders are squaring off long positions.
IT Sector Drag: Broader market weakness (led by IT) has spilled over into banking.
Global Cues: No strong global signals to support risk-on sentiment.
Mixed Bank Performance: While PSU banks like Canara Bank and PNB are showing strength, private banks such as Axis, ICICI, and Kotak are under pressure.
Intraday Trading Strategy
If you’re Bullish:
Look for a breakout above 57,300 for confirmation.
Targets could be 57,600 and 58,000 with a stop below 56,850.
If you’re Bearish:
Wait for a break below 56,800.
Downside targets may be 56,500 and 56,300.
Sideways Play: If the index continues to hold between 56,850–57,300, focus on range-bound scalping or wait for a breakout.
Conclusion
Bank Nifty is trading in a consolidation-to-weak zone today. The index is at a technical crossroads—holding above 56,850 keeps hopes for a bounce alive, while a fall below it could invite fresh selling. Eyes should be on private sector banks and broader market sentiment for the next directional cue.
SENSEX 1D Timeframe✅ Key Index Data:
Current Level: ~82,200 (as of early afternoon)
Opening: Around 82,780
Day’s High: 82,784
Day’s Low: 82,047
Previous Close: 82,726
Intraday Change: Down ~520 points (–0.63%)
🔍 Market Behavior (1-Day Time Frame)
Opening Session: The Sensex opened flat but slightly negative, quickly slipping below 82,600 as traders booked profits from recent highs.
Mid-Morning Session: The index continued to slide, breaching key support levels near 82,200–82,100.
Support Zone Tested: Sensex touched a low of around 82,047 before bouncing slightly.
Volatility: The index remained volatile due to global weakness and profit-booking in large-cap stocks.
🧠 Technical Insight (1-Day Chart Perspective)
Level Type Range (approx.)
Resistance 82,700 – 82,800
Support 82,000 – 82,050
Trend Bias Weak / Bearish
RSI (1D est.) Around 45–50 (neutral-to-weak zone)
Market Mood Cautious to bearish
📉 What’s Causing the Decline Today?
Weak IT and Banking Stocks: Both sectors are under pressure due to poor Q1 guidance and weak global cues.
Profit Booking: Investors are trimming positions after recent highs, leading to broad-based selling.
Global Uncertainty: Mixed international signals and concerns over trade policies are affecting sentiment.
Lack of Strong Domestic Triggers: No major positive domestic news to support buying.
🎯 What to Watch Next
Short-Term Trend: Watch if Sensex can hold above 82,000. If broken, more downside toward 81,800–81,500 is possible.
Upside Resistance: If recovery comes, resistance will be strong near 82,700–82,800.
Sector Focus: Banks, IT, and auto are likely to drive further movement.

Institutional Intraday option Trading🧠 What is Institutional Intraday Options Trading?
Institutional intraday options trading refers to short-term options strategies executed by large institutions with the intent to profit from price movements, volatility, and order flow within a single trading session.
Unlike positional or swing trading, intraday strategies demand high accuracy, precision, and speed, which institutions handle using advanced systems and huge capital.
🏢 Who Are the Institutions?
Institutions that dominate intraday options trading include:
Hedge Funds
Proprietary Trading Desks (Prop Desks)
Foreign Institutional Investors (FIIs)
Domestic Institutional Investors (DIIs)
Investment Banks
Market Makers
These players have access to deep capital, faster execution platforms, and exclusive market data.
🔄 Institutional Objectives in Intraday Options
Capture Short-Term Volatility
Using strategies like Straddles, Strangles, Iron Condors.
Targeting events like news, economic data releases, or earnings.
Liquidity Management
Institutions provide liquidity through market-making and benefit from spreads.
Risk Hedging
Intraday options are also used to hedge large cash or futures positions.
Arbitrage Opportunities
Spot-Future arbitrage
Volatility arbitrage
Calendar spread arbitrage
📈 Common Institutional Intraday Option Strategies
1. Delta Neutral Scalping
Strategy: Sell ATM straddle and keep delta hedged.
Objective: Earn from theta decay and re-hedging.
2. Gamma Scalping
Based on buying options and adjusting delta frequently as prices move.
Profitable during high intraday volatility.
3. Option Writing with IV Crush
Institutions short options during events like RBI policy, Budget, or results.
Profits from rapid drop in Implied Volatility after the event.
4. Directional Betting with Flow Analysis
Tracking aggressive option buying/selling in OTM/ATM strikes.
Directional trades using high-volume & OI shifts.
5. Statistical Arbitrage
Using quant models to exploit temporary mispricings.
🧩 Institutional Footprints on Option Charts
Retail traders can spot institutional footprints by:
Large ATM Straddle positions
IV divergence in option chain
Open Interest buildup without price movement (Smart money quietly entering)
Options being written at key support/resistance zones
Example:
If Bank Nifty is consolidating near a resistance and suddenly 2 lakh OI is built up in 50 point OTM Calls with low IV – this may be Call writing by institutions expecting price rejection.
⚠️ Risks and Control Measures Used by Institutions
Real-time Risk Monitoring Tools
Delta/Gamma/Vega Exposure Management
Limit on maximum intraday drawdown
AI-driven decision engines to avoid emotional trades
✅ How Can Retail Traders Learn from Institutions?
Follow Open Interest + Volume Patterns
Observe institutional behavior on expiry days
Study option flow at key market levels
Backtest Straddles/Strangles on high IV days
Use Option Greeks for proper understanding
Always trade with risk-defined strategies (no naked selling without hedge)
📌 Final Thoughts
Institutional Intraday Options Trading is not about gambling or just clicking buy/sell — it’s an advanced, mathematically balanced, and data-backed approach to generate consistent intraday alpha from the market. Institutions often move ahead of retail due to technology, access, discipline, and experience.
Retail traders can’t copy the scale but can adapt the logic:
Focus on analyzing institutional footprints
Learn to read the option chain like a map
Use data, not emotions

Trading Master Class With Experts🎯 Objective of the Master Class
To turn intermediate or beginner traders into independent, high-probability traders.
To teach institutional strategies, advanced technical analysis, and options trading mechanics in a structured manner.
To prepare you to read price action, understand market psychology, and act with professional-level discipline.
🧑🏫 Who Are the Experts?
The instructors in a true master class are:
Institutional Traders
Full-time Professional Derivatives Traders
Algo Strategists
Portfolio Managers
Ex-Prop Desk Heads or FIIs Participants
These experts bring real P&L experience, not just theoretical certifications. They share their actual setups, mental models, risk frameworks, and do’s and don’ts from years of screen time.
📦 What You Will Learn – Detailed Modules
Module 1: Market Structure Mastery
Institutional order flow
Supply-demand vs. retail S/R
Liquidity traps and smart money movement
Module 2: Price Action + Volume Profiling
Multi-timeframe analysis
Candle psychology + Volume interpretation
How institutions "hide" their entries
Module 3: Advanced Options Trading
Intraday & positional strategies
Greeks mastery: Delta, Vega, Theta, Gamma
Hedging tactics used by professionals
Nifty & Bank Nifty strategy building
Module 4: Institutional Strategy Replication
Intraday straddle/strangle writing
IV crush exploitation during events
Option chain decoding for retail edge
Module 5: Trade Management & Psychology
Risk per trade, max drawdown, win/loss ratio
Building discipline like a hedge fund
Overcoming emotional sabotage in trading
Module 6: Live Market Sessions
Daily planning with expert insights
Live trades with explanation
Review of success/failure transparently
⚙️ Tools & Platforms You’ll Use
Option Chain Analyzers (like Sensibull, Opstra, or Greek tools)
TradingView & charting setup with expert templates
Journaling tools (Edgewonk, Notion)
Algo tools (optional module)
🧩 Who Should Join?
✅ Aspiring Traders (with some basic knowledge)
✅ Traders struggling with consistency
✅ Intraday or options traders wanting a structured framework
✅ Professionals looking to shift to full-time trading
✅ Students of finance or markets seeking practical skills
🏆 Key Benefits
Real strategies shared by real traders
Mentorship: Learn not just from books, but from mistakes and success of mentors
Live sessions to build confidence under pressure
Lifetime recording access in most premium programs
Community access for continuous growth & trade sharing
💼 Career & Income Impact
After attending this masterclass, traders often:
Gain clarity on their trading edge
Improve win-rate and risk-adjusted returns
Start coaching others or creating communities
Join or create proprietary trading setups
📅 Duration & Format
Duration: 1 Week to 6 Weeks (varies by provider)
Format: Live Zoom + Recorded + Assignments
Support: Telegram/Slack group, weekly Q&A, live trading calls
🔚 Final Thoughts
The “Trading Master Class with Experts” is not just another online program. It's a live, applied, market-tested mentorship where real experts guide you step-by-step in mastering trading psychology, strategy, and discipline.
If you're serious about scaling your trading journey, this is the fastest shortcut to reach professional-level execution and understanding.

Institution Option Trading🏢 Who Are These Institutions?
Institutions involved in option trading include:
🏦 Hedge Funds
🏢 Proprietary (Prop) Trading Firms
💼 Investment Banks
🌍 FIIs/DIIs
🧠 Pension Funds & Insurance Companies
They trade options across equities, indices (like Nifty/Bank Nifty), commodities, and currencies, often managing portfolios worth hundreds of crores.
🔍 Institutional Option Trading Strategies
1. Delta Neutral Strategy (Market-Neutral)
Example: Sell ATM straddle and hedge with futures.
Objective: Profit from time decay (theta) while keeping position neutral to price movement.
2. Volatility Arbitrage
Institutions bet on difference between implied and actual volatility.
Buy options when IV is low, sell when IV is high.
3. Calendar Spreads
Sell near expiry option, buy longer expiry of the same strike.
Used when institutions expect IV to rise but minimal short-term price movement.
4. Iron Condors and Butterflies
Multi-leg strategies for range-bound markets.
Used with large capital to generate steady income with limited risk.
5. Protective Puts / Covered Calls
Portfolio hedging: buy puts to protect against downturns, sell calls to earn extra income.
Very common among mutual funds and long-term portfolios.
📈 Option Chain Reading – Institutional Footprint
When institutions enter or adjust option positions, they leave footprints in the option chain. You can spot them by watching:
Sudden spike in OI (Open Interest) at specific strikes
Sharp rise in IV without much price movement
Heavy Put or Call writing near resistance/support zones
Unusual option activity (UOA) before key events
⚠️ How Retail Traders Can Learn From Institutional Option Trading
Track Option Chain + OI Changes Daily
Learn to Read Greeks Before Taking a Trade
Watch How IV Shifts Before & After Events
Backtest Simple Institutional Strategies (e.g. ATM Straddles)
Focus on Consistency and Capital Protection
🛑 Common Retail Mistakes in Options (Avoided by Institutions)
Buying deep OTM options blindly
Overtrading in low-volume strikes
Selling naked options without hedge
Ignoring IV or theta decay
Trading without stop-loss or adjustment plans
🧘 Conclusion: Why Mastering Institutional Option Trading Matters
Understanding how institutions trade options allows you to:
✅ Avoid emotional traps
✅ Trade with the flow of smart money
✅ Use real risk management
✅ Build income and protection strategies
✅ Improve win-rate and longevity in trading

Advance Option Trading💡 Why Advance Option Trading?
While beginner traders focus on price movement, advanced traders focus on:
Time decay (theta)
Volatility (vega)
Delta hedging
Neutral or range-bound markets
Income generation through spreads and option writing
This style of trading provides better capital efficiency, defined risk, and consistent performance across all market conditions (bullish, bearish, or sideways).
2. Implied Volatility (IV)
Higher IV = Expensive options
Lower IV = Cheap options
Key for strategies like IV Crush, Calendar Spreads, or Vega-neutral plays
3. Volatility Smile/Skew
Institutions track which strikes have higher IV. Advanced traders position accordingly.
🔧 Common Advanced Strategies
✅ 1. Straddle & Strangle (Neutral Volatility Strategy)
Straddle: Buy/Sell ATM Call + Put
Strangle: Buy/Sell OTM Call + Put
Use when expecting big movement or no movement (based on IV)
✅ 2. Iron Condor (Range-Bound Strategy)
Sell OTM Call and Put, Buy further OTM Call and Put (as hedge)
Best for sideways markets
Generates consistent income with limited risk
✅ 3. Calendar Spread (IV-Based Strategy)
Sell near-expiry option and buy same strike of a later expiry
Profits from increase in IV and time spread
✅ 4. Butterfly Spread (Limited Risk Strategy)
Example: Buy 1 OTM Call, Sell 2 ATM Calls, Buy 1 ITM Call
Small risk and good reward if price stays within expected range
✅ 5. Ratio Spread
Sell more options than you buy (e.g., sell 2 OTM Calls, buy 1 ITM Call)
Advanced version of directional bet with built-in hedge
✅ 6. Delta Neutral / Gamma Scalping
Balancing option position so that price movement doesn’t affect value
Common in institutions for high-frequency trading
📈 How to Select Right Strategy
✅ Identify Market Trend: Bullish, Bearish, Sideways
✅ Measure IV: Is it high or low?
✅ Track OI (Open Interest): Where are institutions positioning?
✅ Calculate Risk-to-Reward: Does your strategy offer good payoff?
✅ Time to Expiry: Shorter expiry = faster theta decay
⚠️ Risk Management in Advanced Option Trading
Professional traders always:
Set max loss per trade (usually <2% of capital)
Use hedged strategies (never naked short)
Adjust positions if the market breaks range
Keep an eye on Greeks changing with time
Track IV movement before entering trades
📊 Tools Used by Advanced Option Traders
Tool Purpose
Option Chain + OI Analysis Track smart money activity
Greeks Calculator (Sensibull, Opstra) Real-time risk data
IV Charts & Skew Analysis Measure volatility pricing
Backtesting Engines Validate strategies over past data
Algo Execution Tools Automate multi-leg strategies
🧠 Institutional Tactics in Advanced Option Trading
Institutions and prop firms often:
Build delta-neutral portfolios
Sell options with high IV and buy protection
Trade around key levels (VWAP, ATR ranges)
Use gamma scalping for directional bias
Exploit retail option traps near expiry
🔁 Adjustment Techniques (When Trade Goes Wrong)
Rolling the Position – Move strikes up/down or to next expiry
Convert into Ratio Spreads or Butterfly
Hedge with Futures
Close partially and rebalance
Switch to opposite bias if directional conviction is lost
💼 Who Should Learn Advanced Option Trading?
Traders already familiar with basic Calls & Puts
Intraday or swing traders wanting consistency
People managing 6- or 7-figure capital
Option sellers who want defined risk strategies
Anyone seeking market-neutral strategies for steady income
🔚 Final Thoughts
Advanced Option Trading is not about taking more trades — it's about trading smarter, with risk-managed, probability-based setups. When you learn how to use Greeks, volatility, and structure trades, you gain a huge edge over emotional retail trading.
