SAIL - Buy - Technical Analysis# Steel Authority of India Limited (SAIL) - Technical Analysis Report
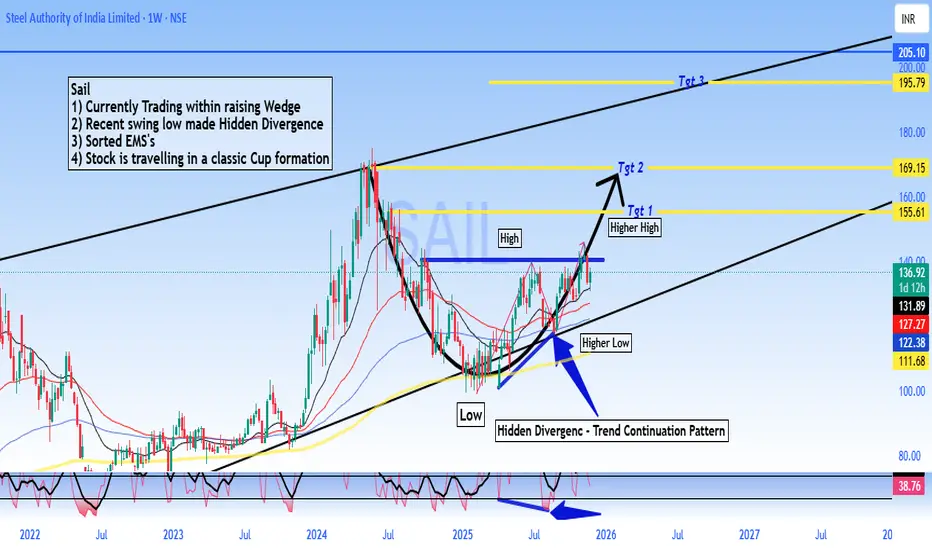
Current Price: 136.92
Timeframe: Weekly Chart Analysis
Technical Setup Overview
SAIL is presenting a compelling technical picture with multiple bullish indicators aligning for a potential significant upward move. The stock is currently trading within a well-defined rising wedge pattern and has recently formed a **Hidden Divergence** on the weekly chart - a classic trend continuation signal.
Key Technical Observations
Rising Wedge Pattern:
The stock is trading within a rising wedge formation, which typically indicates consolidation before a breakout. The current price action suggests the stock is in the later stages of this pattern.
Hidden Divergence - Bullish Continuation Signal:
A **Hidden Divergence** has formed on the weekly timeframe.
- This pattern typically signals trend continuation and suggests the uptrend is likely to resume with strength
Sorted EMA Structure:
The Exponential Moving Averages are properly aligned, indicating a healthy bullish trend structure with multiple moving averages providing dynamic support.
Cup Formation in Progress:
The stock appears to be carving out a **classic Cup pattern**, which is a well-known bullish continuation formation. This pattern suggests accumulation and potential for a significant breakout move.
Price Targets & Projections
Based on the technical structure, here are the potential price targets:
Target 1: 155.61 (Higher High breakout level)
Target 2: 169.15
Target 3: 195.79
These targets are derived from the pattern structure and represent key resistance zones where profit-taking may occur.
Trading Strategy Considerations
For Swing Traders:
- Current levels offer a potential entry opportunity for medium to long-term positions
- A move above ₹140 could confirm the continuation pattern
- Stop loss can be placed below the recent higher low at 122 for risk management
Risk Factors to Monitor
- Failure to hold above ₹122 would invalidate the bullish hidden divergence
- Breakdown below the rising wedge support would change the outlook
- Sector performance and broader market conditions should be monitored
- Steel industry fundamentals and commodity price trends
🔔 Conclusion
SAIL is exhibiting strong technical characteristics with the Hidden Divergence pattern, sorted EMA structure, and cup formation all pointing toward potential upside. The current price action within the rising wedge presents an interesting risk-reward setup for traders and investors with appropriate risk management.
DISCLAIMER
This analysis is for educational and informational purposes only and should NOT be considered as investment advice or a recommendation to buy, sell, or hold any securities. - I am not a SEBI registered analyst or investment advisor - This is purely a technical analysis based on chart patterns and indicators - Past performance and technical patterns do not guarantee future results - Trading and investing in stocks involves substantial risk of loss - Always conduct your own research and due diligence before making any investment decisions - Consult with a qualified financial advisor before taking any investment positions - The author holds no responsibility for any profits or losses incurred based on this analysis - Risk management and position sizing are crucial - never invest more than you can afford to lose
**Trade/Invest at your own risk. Do your own analysis.**
#SAIL #SteelAuthorityOfIndia #StockMarket #TechnicalAnalysis #NSE #IndianStocks #ChartAnalysis #TradingView #StockTrading #HiddenDivergence #CupPattern #PriceAction #SwingTrading #Investing #MarketAnalysis #SteelSector #Commodities #TradingStrategy #ChartPatterns #TechnicalIndicators
BLUECHIP
IOCL - Investment Doubler - MultiTimeframe Analysis
**📊 Indian Oil Corporation (IOC) - Technical Analysis**
#Multiple timeframe analysis showing IOC at a critical juncture around ₹136-163 levels.
Key Observations:
- On an Yearly Chart, Prev Yearly candle attempt failed to do Breakout.
- On Half-yearly chart breakout confirmed and the stock retraced and bouncing back to Key Levels.
- On an Yearly chart the Previous leg which attempted to break Previous ATH has strong #Momentum - The Stock Bounce back on Major Demand Zone, signs of retracement complete.
- Current price: 163.67
- Multiple "Buy on Dips" opportunities identified across timeframes
- 2017 highs acting as reference resistance levels
- Target levels marked: Tgt 1 196.80, Tgt 2 220, Tgt 3 250, Tgt 4 280
- Conservative stop-loss suggested on candle closing basis (short-term)
Trading Strategy:
- Swing trading approach recommended
- #Investment Doubler potential noted on long-term chart
- Expecting 2017 yearly breakout on extended timeframe
DISCLAIMER:
This is for educational and informational purposes only. This is NOT investment advice. Trading and investing in stocks involves substantial risk of loss. Always conduct your own research and consult with a certified financial advisor before making any investment decisions. Past performance does not guarantee future results. The author/analyst is not responsible for any losses incurred from trading decisions based on this analysis.
#TradingView #IOC #IndianOilCorporation #StockMarket #TechnicalAnalysis #SwingTrading #NSE #IndianStocks #BuyOnDips #ChartAnalysis #BreakoutTrading #StockTrading #MarketAnalysis #Nifty #BSE #EquityTrading #ShareMarket #InvestingIndia #TradingSetup #PriceAction #SupportResistance #TrendAnalysis #DayTrading #PositionalTrading #StockTips #MarketOutlook #TechnicalChart #CandlestickPattern #BullishSetup #FinancialMarkets
💡 Remember: Trade at your own risk. Risk management is key to successful trading!

Indian Metals & Ferro Alloys - Buy - Swing Trading#Indian Metals & Ferro Alloys Ltd - #Swing Trade Setup
Current Price: 1,348.10
Technical Setup
Swing Trade Configuration:
✅ **All-Time High Breakout** - Stock has broken out from its previous ATH
✅ **Sorted EMAs** - Moving averages aligned in bullish formation
✅ **Consolidation Above ATH** - Price sustaining above breakout zone
✅ **Range Breakout** - Successfully broken and retested key resistance
Key Observation
Accumulation After ATH Breakout & Range Breakout After Retest
The stock is showing classic post-breakout behavior with accumulation building above the all-time high. The successful retest of the breakout level (962- 1,049 zone) has provided an excellent entry opportunity for swing traders.
Price Targets
Target 1: 1,418
Target 2: 1,498
Target 3: 1,614
Target 4: 1,829
Stop Loss: Below 1,049
Disclaimer: This analysis is for educational purposes only and should not be considered as financial advice. Trading and investing in stocks involves risk. Please conduct your own research or consult with a SEBI-registered financial advisor before making any investment decisions. Past performance is not indicative of future results.
#SwingTrading #StockMarket #TechnicalAnalysis #IndianStocks #BreakoutTrading #NSE #RetestOpportunity #TrendIsYourFriend #IMFA #MetalStocks

Buy MCX#MCX (Multi Commodity Exchange) Technical Analysis Summary
Current Market Price : ₹8,051.50
Dow Theory Analysis
The chart perfectly demonstrates **Dow Theory principles** in action:
Bullish Structure
Higher Highs : Clear progression from previous peaks
Higher Lows : Each dip maintains above previous lows
Fresh Higher High : Recent peak establishing new uptrend confirmation
Key Technical Levels
Daily Resistance : 8,339.00
Weekly Resistance : 8,901.50
Previous ATH : 9,115.00
Multiple Pattern Confirmations
1. Flag & Pole Pattern : - Bullish continuation pattern Suggests upward momentum continuation
2. Harmonic Pattern :
- Trading near point B
- Activation Level : 8,148.50
- 1st Target : 9,115 (Previous ATH)
- 2nd Target : 9,964 (Current projection)
Do your own analysis before Initiating any Trades.

Strong PSU Bank - Indian Bank - Strong BuyIndian Bank - Swing to Short-Term Investment Report
Current Price: 653.10
TECHNICAL SETUP OVERVIEW
Analysis Type: Monthly Chart | Investment Horizon: Short to Medium Term (6-18 months)
Key Observation: After a historic breakout from multi-year resistance, Indian Bank has established itself as a solid structure for accumulation with exceptional return potential.
BREAKOUT TIMELINE & PATTERN
Historical Resistance Battle (2018): Successfully tested 5 consecutive months.
Major Breakout (January 2024) Clean breakout above 2018 resistance level, Significance 6-year base breakout - high probability setup - Follow-through Strong momentum confirmed.
Bull flag Pattern formation, Price Range: 632-736. Building energy for next leg up
Structural Advantages:
1. Clean Breakout Pattern
- No false breaks or whipsaws
- Volume confirms genuine buying
2. Multiple Timeframe Confluence
- Monthly, weekly, daily all aligned bullish
- No conflicting signals
- High probability continuation
3. Measured Move Projections
- Targets based on historical patterns
- Flag pole height projects to 1,050+
- Conservative targets: 813-973
4. Fundamental Support
- PSU bank re-rating theme intact
- Improving asset quality
- Growing dividends (35% YoY growth)
- Strong Q4 profit growth (+31.56%)
Disclaimer: For educational purposes only. Manage risk appropriately and do your own research.
🎯 Trade Smart. Trade Safe. Accumulate Quality.

BharatForge - Swing Trade SetupBullish Setup
Buy already activated. Buy on Dips
1) On weekly TF made Breakout & made strong HH
2) Earlier on prev swing made Hidden Divergence
- Trend Cont Pattern
3) Stock riding on Parallel channel - Channel Top Tgt - 1481
4) EMA’s are sorted confirming Uptrend
Chart shared are for Educational purpose only, chart shared is not a Trade suggestion or recommendation, Do your own analysis, before initiating any Trade.

Deepak Fertilizer - Technical AnalysisDEEPAK FERTILISERS & PETROCHEMICALS CORPORATION LTD.
CMP:1,453.32
CHART OBSERVATIONS
Strong Historical Momentum: Stock showed powerful uptrend with 4 months of continuous momentum building base for next upside.
EMA Confirmation: Multiple EMAs sorted bullishly in both Monthly and Weekly timeframes
Higher Lows Pattern: Price forming higher lows indicating retracement / accumulation.
Trendline Support: Blue descending trendline acting as dynamic support.
Current Structure
Consolidation Phase: Stock consolidating in a defined range after significant rally
Breakout Setup: Price testing resistance of descending trendline - potential breakout candidate
KEY TECHNICAL LEVELS
Resistance Zones (Upside Targets)
- Target 1: 1,778.60
- Target 2: 2,020.60
- Target 3: 2,328.45
- Target 4: 2,668.30
Support Zone
- Accumulation Zone: 1,400 - 1,200 (highlighted in blue rectangle)
TRADING STRATEGY
Conservative Approach:
- Accumulate in parts within the blue zone (1,200 - 1,400)
- Conservative entry can be taken when trendline breaks or price action confirms
Aggressive Approach:
- Entry when 5% upmove is seen in stock price from current levels
- Breakout above descending trendline with volume confirmation
Risk Management
- Stop Loss: Close below 1,132 on weekly closing basis
- Position Sizing: Allocate 2-3% of portfolio per position
- Pyramiding: Add positions on dips within accumulation zone
Target Achievement Timeline
- T1 (1,778): Short to Medium term (3-6 months)
- T2-T4: Medium to Long term (6-18 months)
CONCLUSION
Deepak Fertilisers is displaying a healthy technical setup with strong foundational support from EMA structure across multiple timeframes. The current consolidation offers an attractive risk-reward opportunity for accumulation. Patient investors can build positions in parts, while momentum traders should wait for trendline breakout confirmation.
The stock has demonstrated robust momentum historically and appears to be building base for next leg of upside movement.
DISCLAIMER:
This analysis is for educational and informational purposes only and should not be construed as investment advice or a recommendation to buy, sell, or hold any securities.
- Past performance is not indicative of future results - Stock markets are subject to risks including loss of principal - The author is not a SEBI registered analyst/advisor
- This is a personal view based on technical analysis only - Investors are advised to consult with certified financial advisors before making investment decisions - The author does not guarantee accuracy of data or projections - Trading/Investing in securities is subject to market risks
#DEEPAKFERT #TechnicalAnalysis #StockMarket #NSE #FertilizerStocks #SwingTrading #PositionalTrading

L&T Multiyear BreakoutLarsen & Toubro Limited - Multi-Timeframe Breakout Analysis
Current Price:4,004.40
CRITICAL SETUP ALERT
L&T is at a pivotal moment with breakouts confirmed on weekly and monthly timeframes. The stock is now in a crucial period that will determine the validity of this range breakout.
KEY TECHNICAL OBSERVATIONS
Weekly Chart Analysis:
- Nearly 1.9 Years of Consolidation (2023-2025) between 3,200-3,800
- Clean breakout above 3,800 resistance with strong momentum
- All major EMAs (20/50/100/200) aligned bullishly
- Long accumulation phase suggests institutional participation
Monthly Chart Analysis :
- Breakout confirmed above 4,250 resistance box
- Strong bullish candle with healthy volume expansion
- EMAs: 20 | 50 |100 I 200 - all rising
Current Status:
✅ Breakout happened on weekly/monthly charts
⏳ Awaiting confirmation via follow-up candle close
📈 Price holding above breakout zone shows strength
🎯 PRICE TARGETS
Based on the range breakout and Fibonacci projections:
- Target 1: 4,451.25 (Immediate resistance)
- Target 2: 4,809.60 (Major psychological level)
- Target 3: 5,424.35 (Extended target - 35% upside)
- Target 4: 5,750+ (Bullish scenario)
📌 CRITICAL LEVELS
Support Zones:
- S1: 3,740 (Breakout retest level)
- S2: 3,611 (20 EMA on weekly)
- S3: 3,419 (Consolidation top - breakdown level)
WHAT MAKES THIS SETUP SPECIAL?
1. Time Factor: 1.9 years of consolidation = strong base building
2. Multi-Timeframe Alignment: Breakout on both weekly AND monthly charts
3. Volume Confirmation: Significant expansion during breakout
4. Long-Term Trend: Steep uptrend from 2020 lows still intact
For Conservative Traders:
- Wait for successful retest of 3,740-₹3,800 zone
- Confirm with strong bounce and volume
- Enter on confirmation with tighter stops
For Long-Term Investors:
- Accumulate on any dip to 3,700-3,800
- Strong fundamental backing (Infrastructure leader)
- Multi-year breakout suggests sustained momentum
- Target: 5,500-6,000 (12-18 months)
- ❌ Failure Signal: Close below 3,740 = False breakout, back to range
What to Watch:
1. Monthly candle close (crucial for pattern confirmation)
2. Volume sustenance above breakout level
3. No bearish engulfing on weekly/monthly timeframe
4. Hold above previous consolidation high (3,800)
DISCLAIMER:
This analysis is for educational purposes only and NOT financial advice.
- Technical patterns may fail; past performance doesn't guarantee future results - Breakouts can be false; always use stop losses - Conduct your own research and consult a financial advisor - The author may or may not hold positions in L&T - Trading/investing involves substantial risk of capital loss - You are solely responsible for your investment decisions
**Trade responsibly with proper risk management.**
#LarsenToubro #LT #Breakout #TechnicalAnalysis #NSE #Infrastructure #RangeBreakout #MultiTimeframe #BlueChip #IndianStocks

Long Term Buy #GMRCurrent market Price: ₹153.35
Key Technical Analysis Points
"Major Breakout Achievement"
The stock has successfully broken out of a 16-year resistance level around ₹101.73, which had been a significant barrier since the 2009 highs.
Previous ATH : ₹111.17
- Target 1: ₹125.86
- Target 2: ₹153.35
Key support : ₹101.73 (former resistance, now support)
**Long-term Pattern**: The chart shows a classic long-term consolidation pattern from 2009-2023, followed by a strong breakout and retracement that successfully held above the breakout level.
Conservative Trader can Initiate buy above ₹101.73 Breakout.
The stock experienced significant highs around 2009-2010, followed by a prolonged bear market and consolidation phase lasting over a decade. The recent breakout suggests a potential new bull cycle for the airport infrastructure company.

HDFCLIFE | Excellent cup and handle breakoutHDFCLIFE | Excellent cup and handle breakout
CMP : 776
SL : 700
Target : 1000+

RELIANCE IND - BLUE CHIP STOCK FOR LONG TERMCan Enter at 1260
Target - 1600,2000
Disclaimer - All information on this page is for educational purposes only,
we are not SEBI Registered, Please consult a SEBI registered financial advisor for your financial matters before investing And taking any decision. We are not responsible for any profit/loss you made.
Request your support and engagement by liking and commenting & follow to provide encouragement
HAPPY TRADING 👍

Invest Anuras Rasayan 45% already Reduced. Cheap price BUYPromoter holding 60% that means company is healthy and market capital also good.
already 45% reduced from all time high 1230 .
we may invest and hold upto 60%. 30% expected.
Buy/Entry 1 - 670
Buy/Entry 2 - 620
Sell/Exit 1 - 880
Sell/Exit 2 - 1060

Banknifty cautious level: Exit poll; Avoid - levelsBanknifty " Wedge pattern "
Now, currently Trading inside sideways level.
.
.
Don't make complicated trade set-up.📈📉
Keep it " simple, focus on consistency "💹
Refer our old ideas for accuracy rate🧑💻
Valuable comments are welcomed-✌️
.
Refer old ideas attached below

HDFC BANK - Consolidation phase, is it calm before the storm?Overview & Observation:
1. Solid consolidation happening since 2020.
2. Better to just watch it for now
3. Prices have started moving slowly from the demand zone.
4. PA structure is currently bullish forming HH-HL.
5. Overall strength and momentum are lacking.
D TF:
- Stay tuned for further insights, updates and trade safely!
- If you liked the analysis, don't forget to leave a comment and boost the post. Happy trading!
Disclaimer: This is NOT a buy/sell recommendation. This post is meant for learning purposes only. Please, do your due diligence before investing.
Thanks & Regards,
Anubrata Ray

BAJAJ FINANCE- Consistent Compounder getting ready for comeback?SYMBOL - BAJFINANCE
Bajaj Finance is one among India's the biggest NBFCs. This stock has been a consistent compounder.
This stock is currently trading in a support zone of 6500 level. This area is a major support zone for Bajaj Finance.
This is a good time to invest in it as long term investment. This stock is a blue chip compounder stock. It has made & It will make a lot of wealth to long term investors in long run.
There is also a trading opportunity. As this stock is in a good support zone, I have made a long position in far month futures today around CMP 6555. I will add more longs if getting 6500-6450 levels. My stoploss would be below 6400 & targets would be 6880-7200 & 7420.
Disclaimer - Do not consider this as a buy/sell recommendation. I'm sharing my analysis & my investment/trading position. You can track it for educational purposes. Thanks!

Wipro: 𝟖𝟎% 𝐮𝐩𝐦𝐨𝐯𝐞 𝐩𝐨𝐬𝐬𝐢𝐛𝐥𝐞?
➡️adding since September with an avg price around 410
➡️lowest PE among peers
➡️highest ever sales with large deal wins
➡️key trading area offering strong support

Investment_ WiproNamaste!
Wipro has been sold off (down 47% from the ATH) because of technology sector (NASDAQ 100) being selling off since the start of the year. Buying good companies at a discount is always a good idea.
So, I see a very good investment opportunity in this stock. Remember, investing is different from trading. There are only two scenarios in my opinion, either a company goes bankrupt, or I make money. I, even ( no one ) can predict when will the stock rise or reach the price targets. But, don't sell in a loss.
Q: When and what price to buy?
A: Entry price is Rs 415.05 . Well, I generally place a buy-stop orders above candle's high. There is always a resistance (sellers) above the high of any candle. So, logic is that, buyers have to be more powerful to move any stock above the highs. Hence, I will be joining strength and buying above highs.
Q: What if it doesn't execute?
A: Entry price won't be changed until I update it here. You can place GTT (Good Till Triggered) orders with your broker. Means, in a span of one year, whenever the stock reaches that price, you will be automatically buying it at a mentioned price.
Remember, I have a well planned investment method. Everything is pre-decided, when to buy, when to sell, how much shares to buy, capital allocation: Everything. So, kindly prepare yours. I share many stocks, from different sectors, different market caps, etc. So, it is your responsibility to select your favorite ones. Even if you're getting returns >12% annually, you should be very happy because you're beating the markets.
Disclaimer: The analysis I have shared is based on my understanding and experience in the markets. Investment carries an element of financial risk. Please do your analysis and/or consult your financial advisor before investing. I already have some shares and will add more if I get another opportunity.

Investment_ TECHM (Tech Mahindra)Namaste!
I have selected another stock, which looks good to invest in. You must have wondering, why am I sharing only technology companies? Well, it is the sector which have fallen mostly.
I don't like to buy at highs. I like to buy at correction, when there is fear, when the weak-hands get panic and selling it. That's what many of the great investors do.
Anyways, TECHM is a stock, which have fallen around 48% from all time highs. Well, in my perspective, this stock, along with other technology stocks are on a sale . I would advice anyone to invest in because, it is a very good opportunity to do so. If you have been reading my articles, you will know why.
And remember, don't concentrate your portfolio in the IT Sector, by buying every stock in the sector. Please diversify.
You can either place GTT (Good Till Triggered) orders with your broker at a price 1017.50-1018 , or manually buy it if it crosses this crucial price level.
I would modify the entry, if it signals to do so based on my plan, and will update it here.
Q: Will it sky-rocket as soon as you buy.
A: NO. Investment takes time to show results, months or years. There are many many things which affect the stock performance. You can't figure out why is this happening.
What can you do is, buy and sell .
Please read previous articles, for reading more about the above thing.
Disclaimer: The analysis I have shared is based on my understanding and experience in the markets. Investment carries an element of financial risk. Please do your analysis and/or consult your financial advisor before investing. I already have some shares and will/may add more if I get another opportunity.

Investment_ TCSNamaste!
TCS has been one of the stocks which didn't corrected much in the "corona crash", dropping only similar to 30%.
The main reasons for this stability was:-
1. IT sector still offered it's employees a work from home opportunity, so it's business didn't affected that much.
2. TCS is the biggest company in the IT sector today, and it's share price has been very stable due to the fact that it didn't fell more than 30% since the year 2010.
3. So, again it fell 30% and it's price is trading near support level.
4. It's an very good investment opportunity, for the people who are very conservative in risk taking. Hence, they should not expect higher returns rather stability.
5. Investment price looks good at current price of Rs 3074.
6. More capital allocation can be done to this stock as compare to small and mid-cap due to the nature of stability. But not more than 20%.
Disclaimer: The analysis I have shared is based on my understanding and experience in the markets. Investment does not guarantee a fixed return due to volatile nature of markets and may result in a loss. Please do your analysis and/or consult your financial advisor before investing.

ITC continues to look very strong | Stop Loss Levels revisedITC continues to look very strong. Stop Loss Levels revised.
Short term traders Stop Loss: 370
Momentum Trader Stop Loss: 360
Momentum Traders who can handle volatility can keep Stop loss at: 345
Disclaimer: invested in the stock. Not an advice for you to buy/sell. Just letting you all know the levels as per charts. Do things according to your understanding.
I'm also a non smoker and do not encourage smoking 😒 🚭

Will Output Repeat ?This is daily timeframe.
Kotak Mahindra Bank is taking support on a this support zone for more than a year.
It had formed a triangle pattern on support zone and gave breakout and had move
more than 25% last time.
After that, it corrected and again came back to previous levels at support zone,
and again consolidated for last 5 months and now showing some strength.
Today gave breakout, but it does not have strong volume.
Volume is average.
Let's see how it moves further.
This post is for information purpose only.

Bluechip stock analysis here is the upcoming best buy opportunity to buy some bluechip stocks and earn some hefty amount

P&G (PGHL) near BUY zone watch out for P&G (PGHL) near BUY zone 4700-4800
top company correction seems done , will rally soon .
Use your discretion
