SMALL CAP INDEXHello & welcome to this analysis
The index appears to be ending a wedge pattern near an Ichimoku cloud resistance with future Kumo bearish. It also has a slanting channel upper trendline resistance approaching.
The wedge would be considered broken below 17775, downside levels where it could then retrace to would be the Ichimoku Base line near 17400 and if that fails to hold it could further retrace till 16600 where it would form a Bullish Harmonic Gartley.
The PRZ of the Gartley coincides with a gap up area and the slanting channel lower trendline.
This bearish view would be invalid above 18150
All the best
Bluechips4u

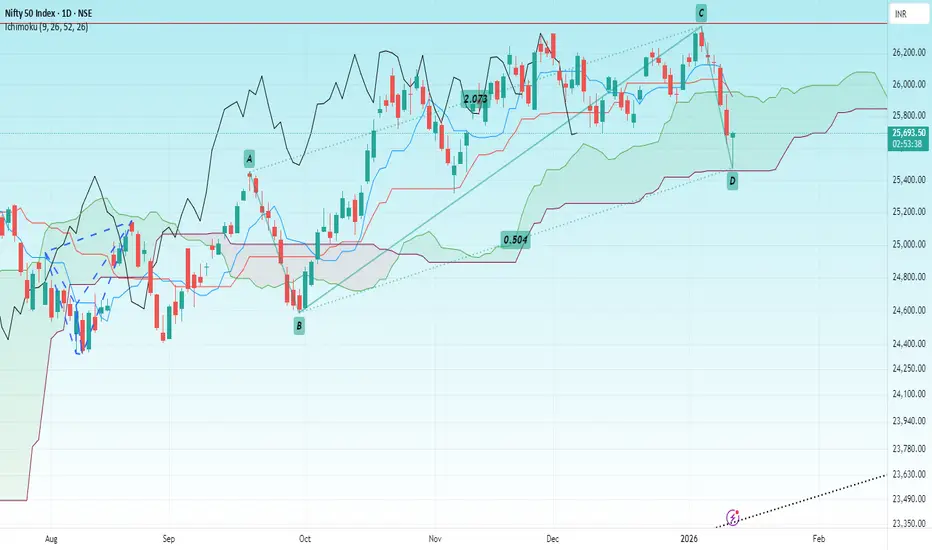
NIFTYHello & welcome to this analysis
Nifty has made a Bullish Harmonic Reciprocal ABCD pattern that coincides with Ichimoku Kumo support
If it sustains above 25650 then a bounce/reversal can be expected till 25800 / 26000 for now.
The view will go wrong below 25375
All the best
MIDCAP SELECTHappy New Year 2026
Hello & welcome to this analysis
The Midcap Select index has been sideways full December and might remain so for a few more days till it completes a triangle.
Leg D of this triangle could end near 13850-13900 followed by leg E that could retrace till 13700-650 to complete it formation (time wise correction)
The triangle structure will be invalid if either the current up move goes above 14000 without a pullback or the expected decline in leg E goes below 13575
The expected upside level post completion of triangle is approx 14300
All the best

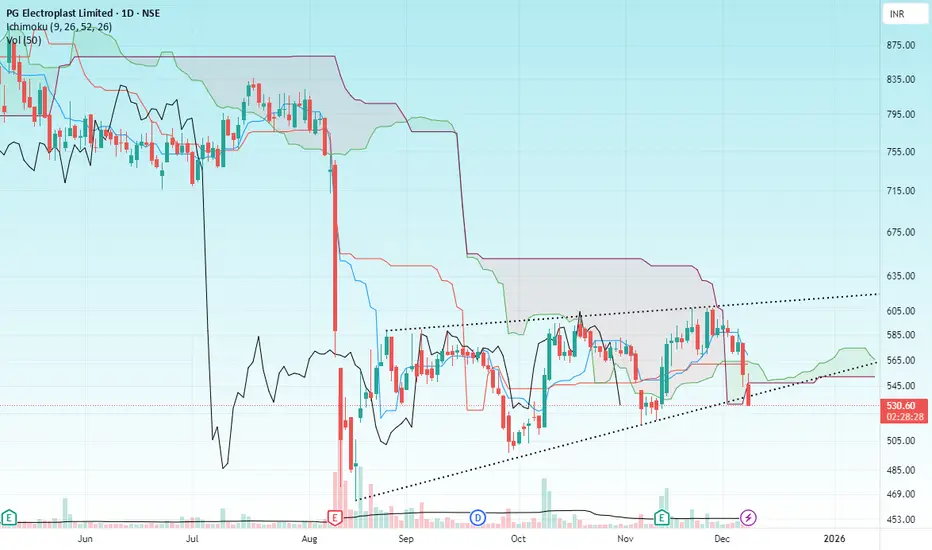
PGELHello & welcome to this analysis
PGEL came out with a statement that analyst seem to have researched another company's financials but posted them as of PGEL.
However, charts suggest a a bearish flag & pole pattern formation is taking place here suggesting more downside below 516.
One can wait for breakdown or use bounce (huge resistance near 565 with a stop loss above 570) for shorting opportunity.
Below 515 it opens for 450.
All the best
SILVERHello & welcome to this analysis
Silver had a dream run from August to October before going into a sideways correction.
Just like Gold, it too is forming a triangle, now likely into its last leg.
Comex Silver an ascending triangle as long as it does not trade above $54.40 could dip down to $51.50 - 50.75 to complete the formation of the triangle provided the expected last leg down does not go below 48.63.
MCX Silver is a contracting triangle (due to $:INR) as long as it does not trade above 165818 could dip down to 157000 - 155000 to complete the formation of the triangle provided the expected last leg down does not go below 150350.
Upon completion of the triangles the upside target on resumption of uptrend are $59 / INR 186000
All the best

GOLDHello & welcome to this analysis
GOLD after a super duper move from AUG - OCT followed by a sharp decline now appears to be consolidating within a triangle.
Currently appears to be in leg D which should be followed by leg E to complete the contracting triangle squeeze and from thereon the resumption of uptrend.
For those new to patterns - triangles are time wise correction that see less price retracement within a longer duration of time. The current triangle appears to be a contracting one.
Leg D could end near 4175 / 125750 approx while leg E could end near 4050 / 122250 approx.
The view would be incorrect if either the current up move goes above 4245 / 127950 without a pullback or the expected retracement goes below 4000 / 121000.
The interesting part here is that GOLD prior to its rally from 3250 was also within a triangle for 4 months. What followed was a parabolic move from a squeeze. Lets see if this one will also give such a move or not.
All the best

DALMIA BHARATHello & welcome to this analysis
Technical Outlook:
In the monthly time frame its completing the formation of a Cup & Handle breakout suggesting upside levels for medium term 2800 - 3500, for long term 3800 - 5000
Accumulation can be done in the range of 1900 (on downside) 2300 (on the upside).
The view would be invalid if it goes below 1700
Fundamental Outlook
Cost and operational efficiency focus
Recognized as one of the lowest-cost cement producers in India, thanks to measures such as increased use of blended cement, alternative fuels, optimization of lead distances
As of FY25, DBL reported a net debt to EBITDA ratio of ~0.3×, indicating a relatively comfortable leverage position for now.
Growth ambition/scale expansion
The company has achieved an installed capacity milestone of ~49.5 Mtpa (million tones per annum) of cement in FY25. It has set a long-term target of 110-130 Mtpa by ~FY31.
Regional presence & market opportunity
DBL has a strong footprint in the East & South of India, which are seen as growth regions. For example, the FY25 press release emphasized expansion in the East.
Where could margin gains realistically come from?
Better pricing / improved net realizations (higher NSR/ton).
Cost reductions: fuel/coal optimization, higher renewables share, freight savings and logistics efficiency.
Product mix shift to premium / blended cement with higher realizations.
Scale / utilization improvements (spreading fixed cost)
All the best

BAJAJ AUTOHello & welcome to this analysis
The decline from September 2024 high till April 2025 low appears to be a 5 waves down impulse that I have marked as A of the corrective ABC wave.
The rise from April 2025 low till September 2025 high appears to be corrective ABC in structure.
If we consider the corrective as completion of B of ABC then the current decline would unfold into another 5 waves impulse down to complete C of ABC
If we consider the corrective as completion of (A) of B of ABC then the decline would pause between 8400 - 8000 to attempt another leg up within the corrective.
In either scenario a decline is likely coming as long as it stays below 9200
Conclusion
Short term weakness, investors/buyers should wait for proper structure to unfold before attempting longs
All the best

BAJAJ HINDUSTANHello & welcome to this analysis
The daily time frame has formed an Inverse Head & Shoulder pattern suggesting upside levels of 24.50 & 26.50 as long as it does not breach 20.95
A healthy Risk : Reward ratio set up for short term trading in this small cap sugar sector stock
All the best

ETERNALHello & welcome to this analysis
A 3 years bull run could be coming to an end near 350-375 as it completes its 5 impulse waves.
This would be followed by wave 2 - ABC corrective retracement.
The view would be incorrect if it continues to rally beyond 400
All the best

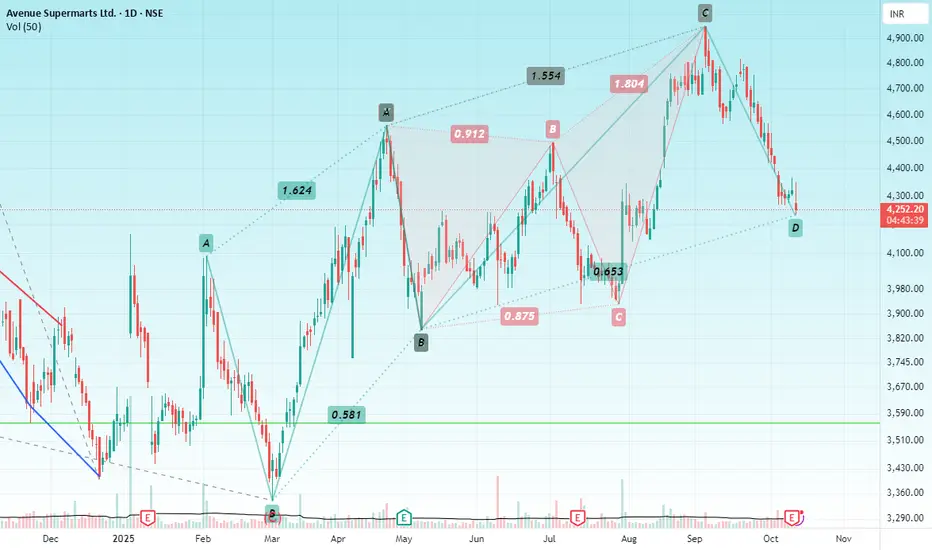
DMARTHello & welcome to this analysis
DMART has usually reversed regularly from Harmonic Patterns as can be seen in this chart in daily time from a
Bullish Reciprocal ABCD
to a
Bearish Deep Crab
to now forming a
Bullish Reciprocal ABCD
If it sustains above 4200 then it could give a probable bounce/reversal to 4400 & 4550 indicating a good risk : reward ratio
All the best
CRUDE OILHello & welcome to this analysis
USOIL in daily time frame has activated a bullish Harmonic Gartley suggesting probable upside till $62 - 64.50 - 69 as long as it does not breach $59.25
Crude (MCX) is forming a bullish candlestick - Hammer also suggesting likelihood of a rally till 5575 - 5750 - 6150 as long as it does not breach 5300
After a very long time a bullish formation is giving a follow through signal in CRUDE
All the best
Regards

Bank Of BarodaHello & welcome to this analysis
After giving a breakout with strong volume followed by a pullback to the breakout level it appears to be ready for further upside till 270 - 300
This view would be invalid below 247
All the best

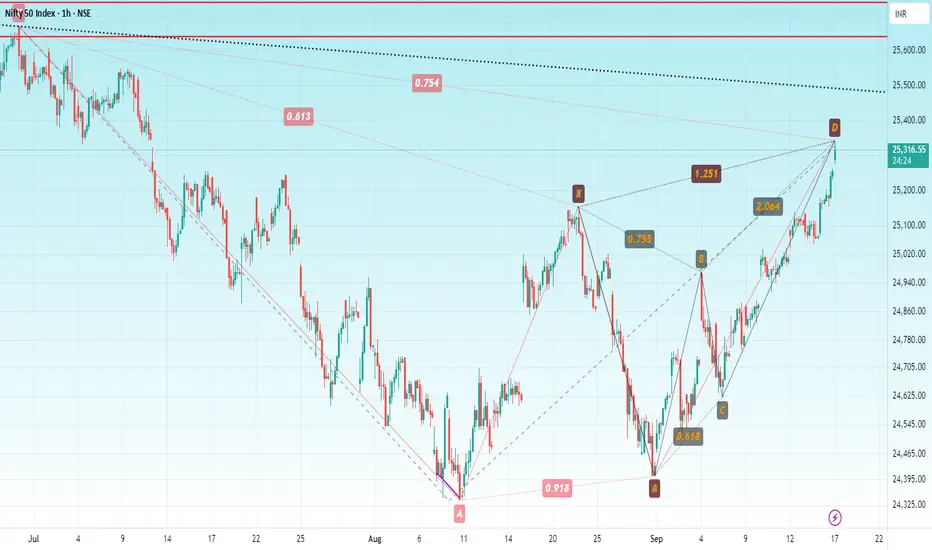
NIFTYHello & welcome to this analysis
On the eve of FOMC meet, the index has today covered the gap down made on July 11th and entered the potential reversal zone (PRZ) 25350 - 25425 of two bearish harmonic patterns - Butterfly (15m) & Gartley (daily).
Reversal confirmation as of now is once it starts giving a 60m close below 25225.
Pattern gets negated above 25525.
All the best
Regards
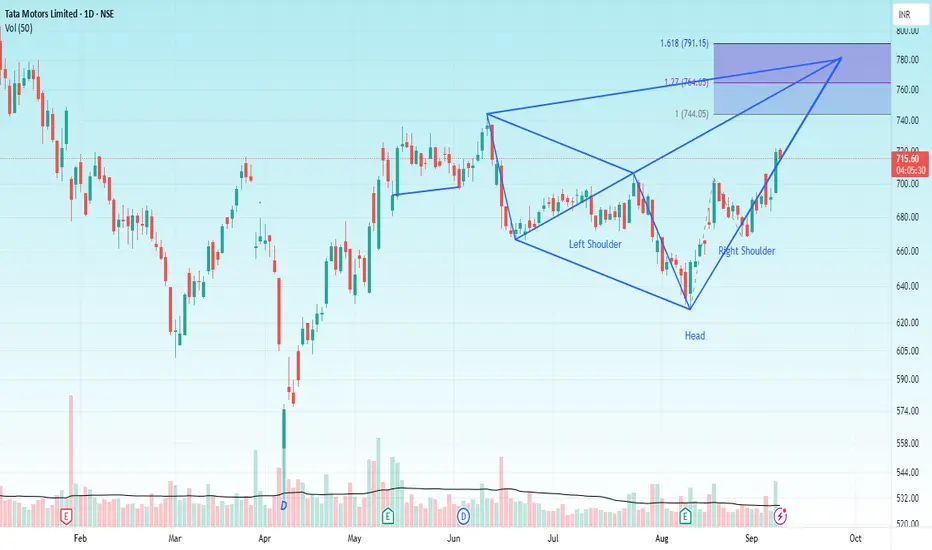
TATA MOTORS Hello & welcome to this analysis
The stock in daily time frame has given a double breakout
Inverse Head & Shoulder
Bullish Harmonic Seahorse
The upside levels as per IHS are 740 & 790 while the Seahorse pattern is indicating 775.
Both patterns have strong support at 690-700 and both would be considered invalid below 665
All the best
SILVERHello & welcome to this analysis
Silver in daily time frame appears to be in its 5th wave.
The larger impulse could end anywhere between $43.50 - 45 / INR 125000 - 129000. From there I expect it to retrace to $38 /INR 116000
MCX Silver will depend largely on $:INR movement.
Silver remains a strong commodity for medium to long term and all dips should be used to add.
All the best

PUNJAB NATIONAL BANKHello & welcome to this analysis
In my previous post on the bank I had suggested the likelihood of it declining to 103 where it had double bullish harmonic patterns. (link to that post is given)
Now the bullish harmonic Bat & reciprocal ABCD patterns are indicating the probability of a rally till 106 & 109 as long as it sustains above 100.
Immediate resistance at 104 with strong support near 102.50
All the best

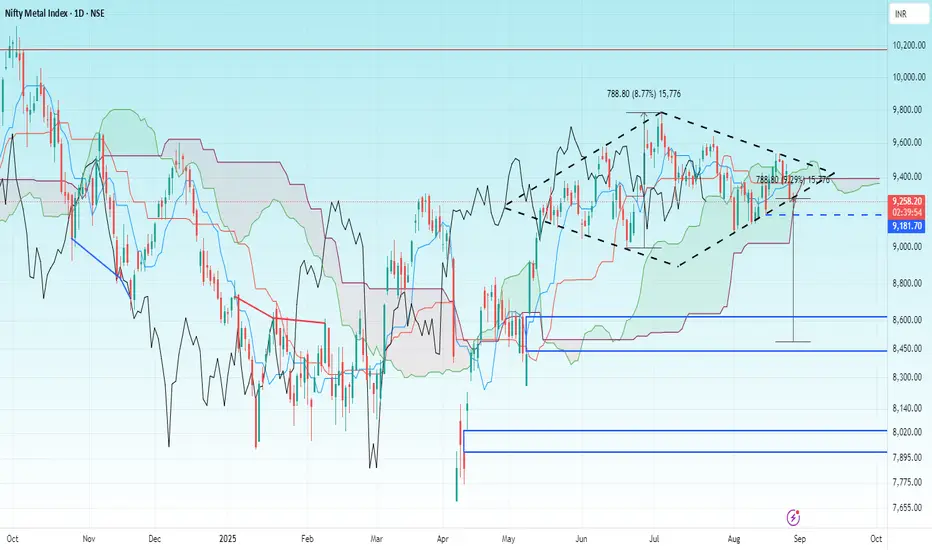
CNX METAL INDEXHello & welcome to this analysis
The metal index in the daily time frame has formed a bearish Diamond pattern suggesting further weakness below 9180 for a probable target of 8500 that coincides with the gap up area of May 12.
The upper resistance for the pattern is currently at 9475
All the best
PUNJAB NATIONAL BANKHello & welcome to this analysis
In July 2025 it activated a bearish Harmonic Butterfly pattern at 115 that lead to its current decline at 38 Fibonacci of its rally.
Going forward it could continue to decline till 100 where it would likely form two bullish Harmonic patterns - Shark & ABCD around the 50 Fibonacci retracement.
It has resistance now between 110 - 108 from where it fell with heavy volumes couple of days back.
All the best
Regards

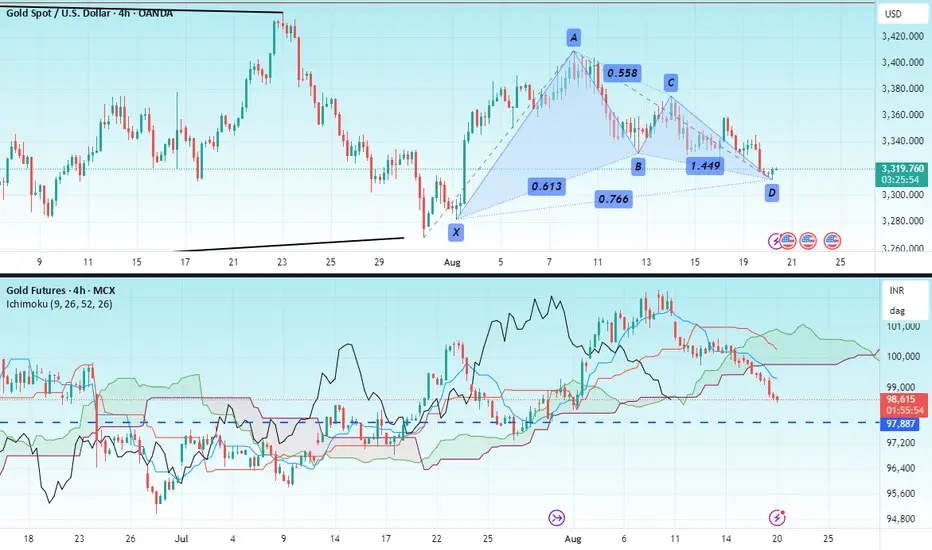
GOLDHello & welcome to this analysis
Gold at COMEX has formed a bullish Harmonic Gartley pattern in 4hr time frame suggesting a reversal in trend.
As long as it sustains above $3295 it could give a bounce/rally till $ 3345 - 3370 - 3400 - 3450.
Gold at MCX appears to be ending its pullback but due to INR $ fluctuations a bullish Harmonic pattern has not formed. One could look for bullish trades as long as its above 97900 for upside levels of 99400 - 100000 - 101000 - 102500. Keep in mind levels could alter due to forex changes
Overall GOLD is strong and has an upside triangle breakout target of $3700 open as long as it is above $3250 (refer to my earlier view published on Gold in the link)
All the best
IT SectorHello & welcome to this analysis
The relative strength of CNX IT with Nifty is indicating the likelihood of a stronger reversal.
In the monthly time frame we can see after doing a 2x Fibonacci trend extension it did a retracement up to the I H S neckline.
In the weekly time frame we can see an early stages of the probability of a double bottom formation.
Current ratio is 1.45, if it can hold on a weekly basis above 1.39 it could continue to improve with resistance coming in at 1.55. A weekly close above 1.60 opens the probability of 1.90 and 2.10. Failure to hold 1.39 would suggest further downtrend continuation.
Relative Strength is a measure of 2 tradeable assets versus each other. In this case the analysis is if Nifty rallies then IT index will rally strong and if Nifty declines IT index will decline less as long the ratios mentioned above are maintained.
All the best

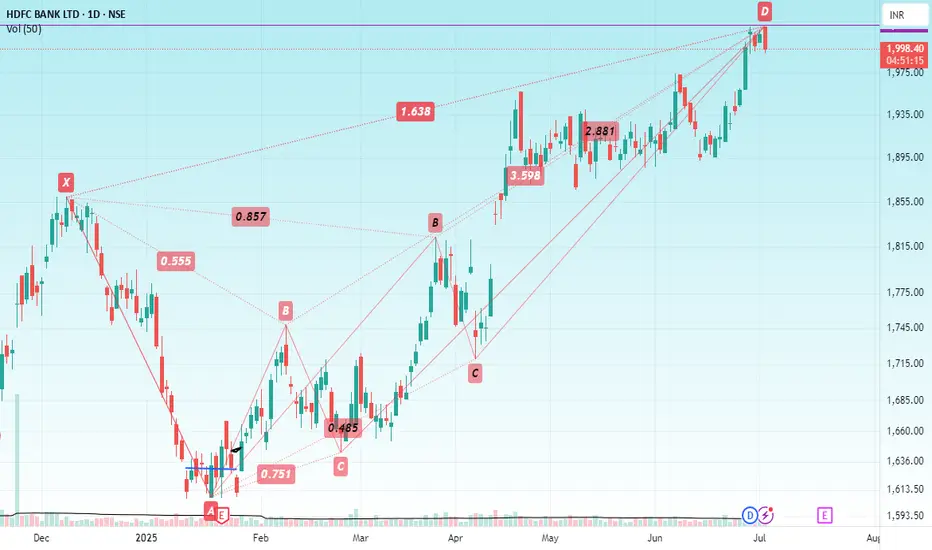
HDFC BANKHello & welcome to this analysis
It has made double bearish Harmonic patterns at the same PRZ level - Crab & Deep Crab in the daily time frame with so far today's candle being an Open = High in daily time frame.
A retracement till 1950 - 1875 could be possible as long as the stock does not cross 2050.
A heavyweight in both Nifty & Bank Nifty, it could halt the uptrend of both the indexes either till it does not complete its pullback or the patterns get negated.
All the best
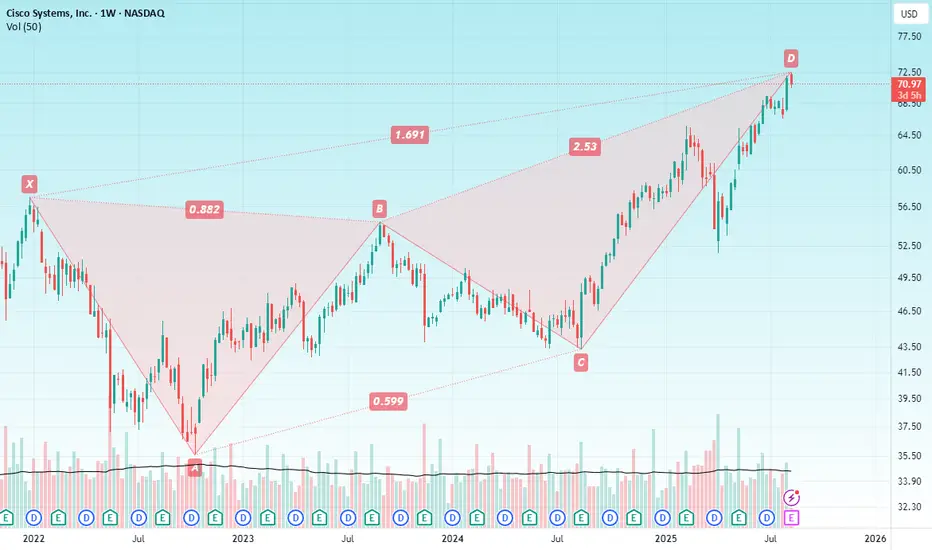
CISCO SYSTEMSHello & welcome to this analysis
In weekly time frame it has activated a bearish Harmonic Deep Crab pattern suggesting likely pullback to $65 and below that $57.
The pattern would be considered invalid above $77
All the best