Bitcoin Chart Analysis And Bearish overview #BTC Bearish Outlook
Bitcoin stays bearish below $113,400.
No H4 close above = downtrend intact, targeting the $100K psychological level.
Break $100K support, and liquidity near $90K becomes the next magnet.
Key levels:
$113,400 → HTF resistance
$100,000 → Psychological support
$90,000 → Demand zone
Already 13% down from our short entry, hope you caught the move. 🫡
NFA & DYOR
BNB
BNB/USDT – Bullish Breakout Trade Idea✅ Entry: 871.564
🎯 Target: 890.455
⛔ Stop Loss: 862.304
🔎 Trade Rationale:
Ascending Triangle Breakout – Price has respected the rising trendline and finally broken above the neckline resistance, signaling bullish continuation.
Volume Confirmation – A notable increase in buying volume supports the breakout strength.
Resistance Flip – The previous supply zone around 870 has turned into support, adding confluence.
📊 With a strong bullish structure and favorable RRR, this setup aims to capture the next push towards 890 zone.
⚠️ Disclaimer: This is not financial advice. Always do your own research and manage risk before trading.

#ETHEREUM – Macro Breakout Setup#ETHEREUM – Macro Breakout Setup 🚀
▶️ 6th time in history testing $4K macro resistance.
▶️ A clean weekly close above could ignite HTF expansion to $8K → $10K → $15K.
6 rejections in 4 years… one breakout can change it all.
NFA & DYOR

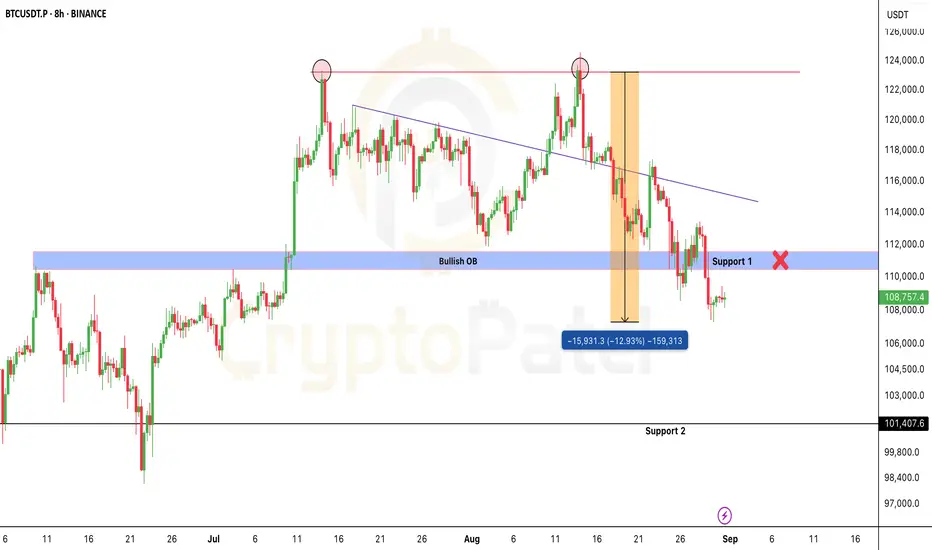
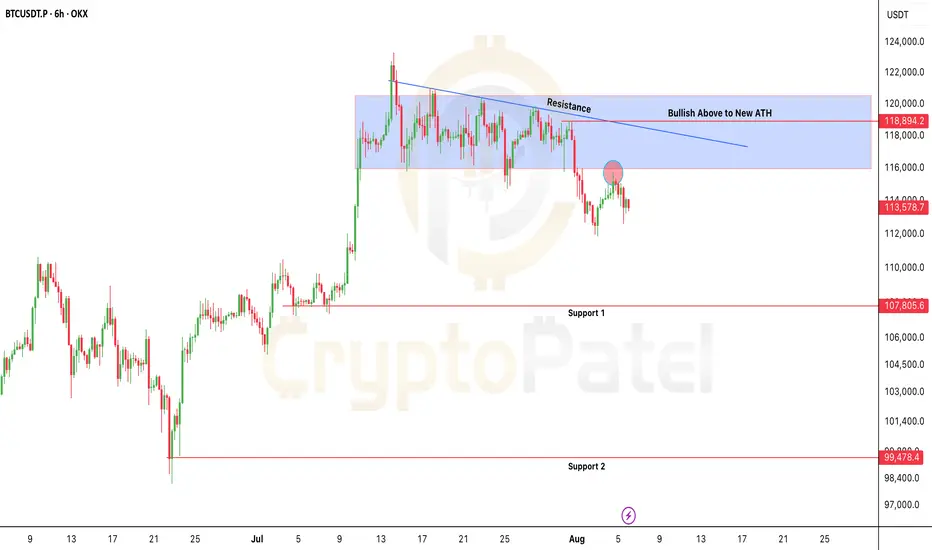
Bitcoin at Risk: $115.7K Is the Line Between Bounce or BreakdownBitcoin at Risk: $115.7K Is the Line Between Bounce or Breakdown
CRYPTOCAP:BTC is trading below key resistance ($115.7K–$118.9K) and rejected cleanly at the trendline.
As long as price holds below $115,700, bearish bias remains.
⚠️ Failure to reclaim = high risk of breakdown toward $107K and even sub-$100K levels.
Bearish invalidation only above $119K
NFA & DYOR
POL Could 3x After Breakout: Are You Buying the Right Zone?Price is consolidating above the accumulation zone ($0.19–$0.21) after multiple rejections off demand.
Now trading above this base, if price retests the zone, it could offer a high-probability entry.
Key Resistance = Targets: $0.28 → $0.41 → $0.52 → $0.70 → $1–$2
Structure remains valid above $0.150 (HTF close below = invalidation)
Break + Retest of $0.28 = Bullish continuation confirmed
Setup: Accumulation → Expansion
NFA & DYOR

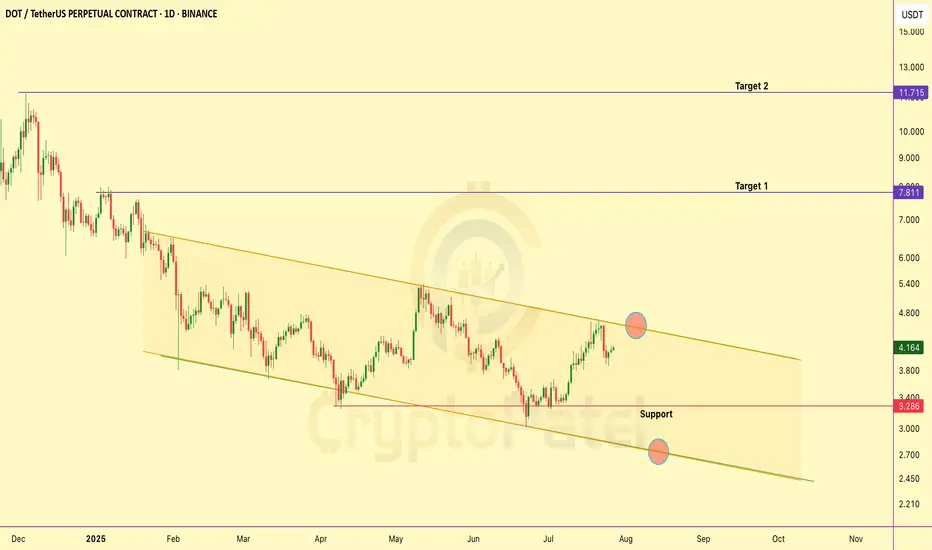
Polkadot is at $4.60 — breakout or last chance to buy?Polkadot is trading just under a key resistance at $4.60 — a level it’s failed to break several times in the past.
If it finally breaks above this, we could see a strong rally toward $8 and maybe even $12 in the coming weeks.
But if it gets rejected again, the price might drop back to the $3.30–$2.60 zone which has been a strong support area before and a good place to build long positions.
For now, DOT is still inside a long downtrend. A clean breakout above $4.60 could flip the whole structure bullish.
If it breaks — it could fly
If it fails — it’s a re-entry chance
Risk-takers can start slow accumulation from here because let’s be honest, no one can predict the exact bottom or top.
Not: NFA & DYOR
Big Triangle Forming on $NEAR — Massive Breakout Ahead!Big Triangle Forming on CBOE:NEAR — Massive Breakout Ahead!
CBOE:NEAR is showing strong bullish structure on the HTF – it's forming a large symmetrical triangle pattern, which often signals an explosive breakout move.
Technical Analysis Overview:
▶️ Best Accumulation Zone: $2.90 – $2.10
▶️ Targets: $5 / $10 / $20 / $30 / $50
▶️ Invalidation Below: $1.80
Once we break out of this triangle, the upside move could be massive.
Why I’m Bullish on NEAR:
✅ AI + Blockchain = Future – NEAR is already delivering real AI tools & apps
✅ User & Dev Growth – Ecosystem expanding fast
✅ Modular Infrastructure – Becoming the base layer for multichain apps like Celestia
✅ FastAuth + BOS – Easy Web2-like onboarding + AI-native UX
✅ Backed by Big Players – a16z, Circle, Tiger Global all invested
In the last cycle, CBOE:NEAR did 38x with just hype.
This cycle? It has the tech, adoption, and perfect timing.
Don’t sleep on $NEAR. It’s not hype — it’s building the future.
Note: NFA & DYOR

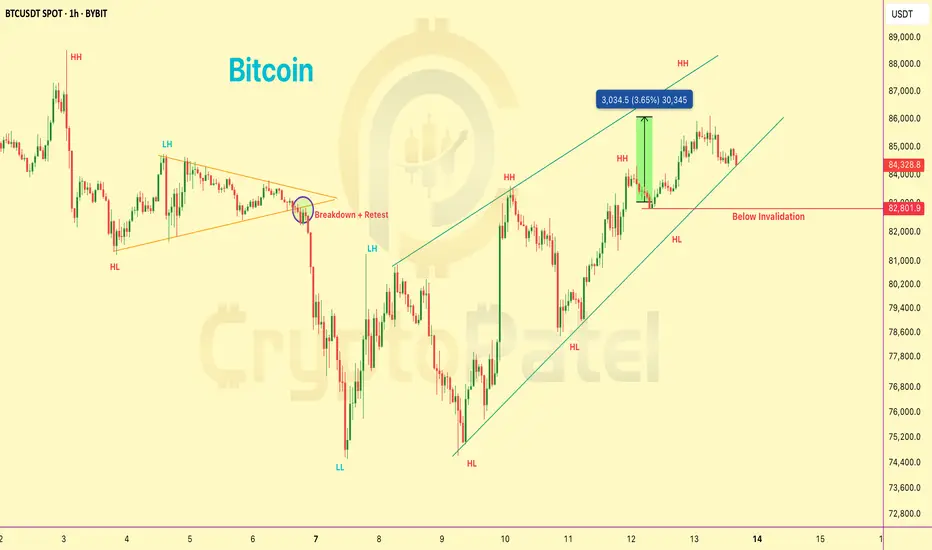
#Bitcoin 30 Minutes Chart Scalp profit Update:#Bitcoin 30 Minutes Chart Scalp Profit Update:
That quick scalp move delivered a clean +3.60% — just as planned. Scalp trades are meant for small, fast targets, and this one hit perfectly. ✅
But If Still holding?
🔹 Move SL to Break Even to protect capital
🔹 Structure looks fine for now, but don’t get greedy — manage your risk.
Always trade with a plan.
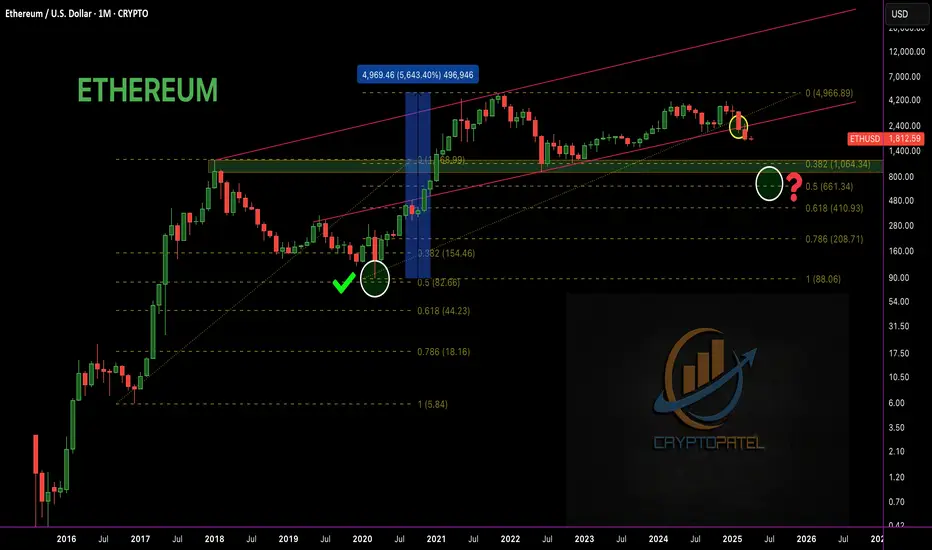
Will $ETH Drop Below $1,000 Before Heading to $7,000+? Will CRYPTOCAP:ETH Drop Below $1,000 Before Heading to $7,000+?
🟣 Historically, #ETH respected the 0.5 Fib retracement in bull markets – In the last bull run, ETH retraced to 0.5 Fib at $89 — then exploded to $4,867
🟣 That’s +56,000% in just 1.5 years!
This cycle, the 0.5 Fib level sits around $661. With the monthly trendline breakdown, the big question is:
Will #Ethereum dip below $1,000 and test $700 before making a new ATH?
If ETH reaches sub-$1,000 zones, I'm personally buying heavy and holding for 1–2 years. No FA – just Fib, patience & conviction.
ETH will reward those who ride the wave, not fear the dip.
Hold strong. Next 1–2 years = massive opportunity.
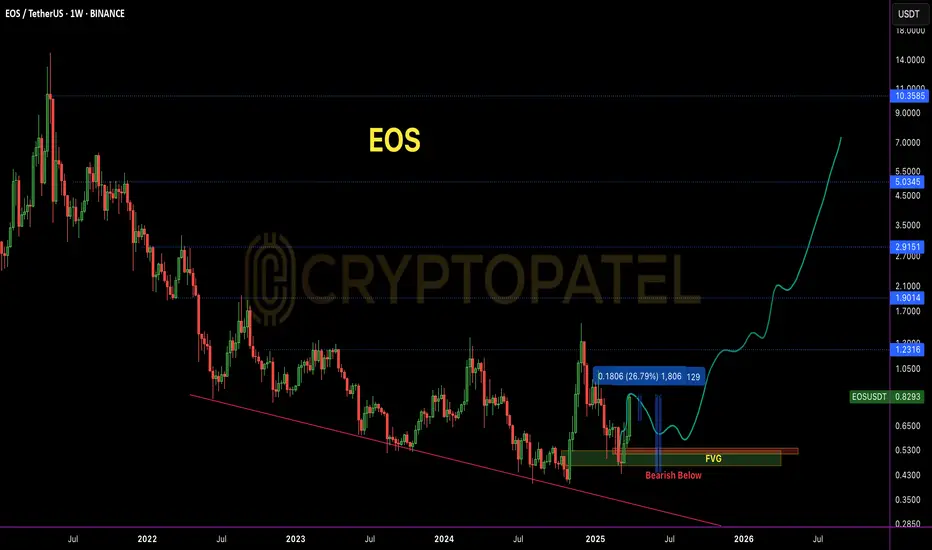
EOS Broke Out After Months — But Is This Just the Beginning?NYSE:EOS Broke Out After Months — But Is This Just the Beginning?
#EOS was once a top-tier asset, trading above $15. However, due to consistent development delays and unmet commitments, the price structure gradually broke down, eventually bottoming near the $0.40 zone — a key historical demand area.
Recent Development: EOS witnessed a sharp rally of +94% in the last month, with a strong +26% daily candle, backed by bullish news:
✅ Formation of Vaulta Banking Advisory Council (includes ex-Binance Canada CEO)
✅ CMO Tristan Dickinson teased a major upcoming announcement
Current Market Structure:
▶️ Price broke out of a long-term accumulation range
▶️ Volume spike confirms genuine interest
▶️ However, one FVG (Fair Value Gap) is still unfilled between $0.60–$0.50 zone on the 4H chart
Ideal Entry Zone (Pullback Play):
▶️ Watch for a retest near $0.60–$0.50
▶️ FVG fill + potential bullish OB (Order Block) = Confluence zone for long setups
🛑 Invalidation / Stop-Loss:
▶️ Breakdown below $0.43 on high volume will invalidate the structure
▶️ SL is wide, but RR (Risk-Reward) setup is favorable for swing traders
Long-Term Upside Targets:
First target: $0.95–$1.10 (range high breakout)
Mid-term target: $1.45+
Long-term potential if fundamentals sustain
⚠️ Manage your position size. NFA | DYOR | Risk Management is Key
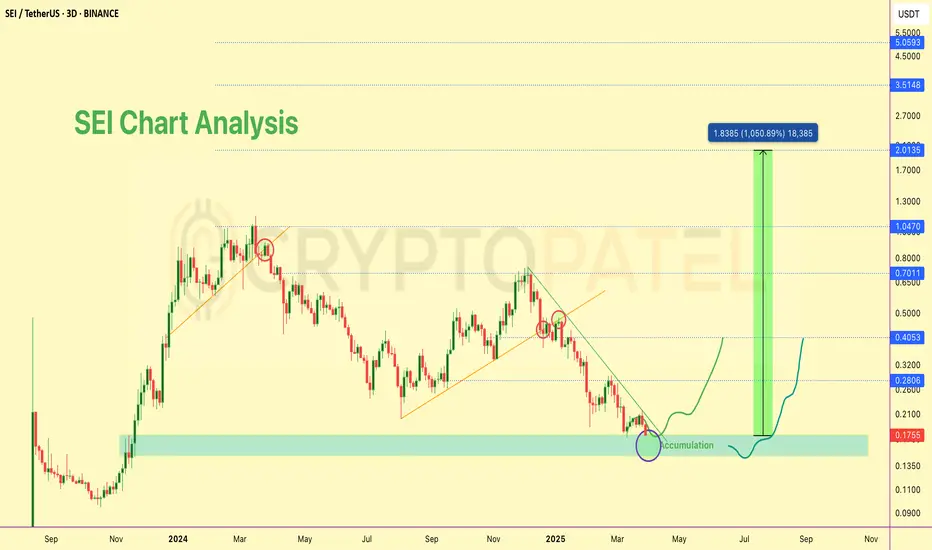
$SEI/USDT- Long-Term Technical Setup and $5 Potential in BullRun📊 $SEI/USDT – Long-Term Technical Setup
NYSE:SEI is holding strong at the $0.18 support zone, showing early signs of accumulation. This level has historically acted as a demand area, making it a key zone to watch.
🔹 Structure: Forming higher lows – bullish trend intact
🔹 Volume: Accumulation pressure building
🔹 Sentiment: Backed by large-scale buyers (e.g., Trump’s World Liberty)
📈 Long-Term Targets:
➡️ $0.45 → $1.00 → $2 / $3 / $5 (macro targets similar to CRYPTOCAP:SUI )
🛑 Invalidation: Close below $0.15
⚠️ Not financial advice. DYOR.
#SEI #CryptoTA #Altcoins #DYOR #TechnicalAnalysis
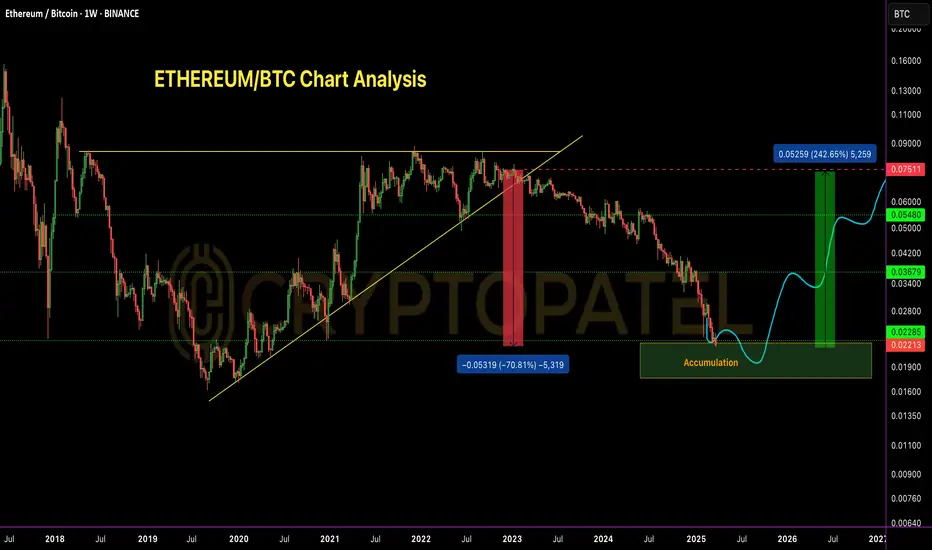
ETH/BTC – 70% Drop Achieved | Perfect Short ExecutionETH/BTC – 70% Drop Achieved | Perfect Short Execution
As projected in my analysis dated 10th Nov 2022, ETH/BTC has completed the anticipated 70% correction from the top.
Short Entry: 0.075 BTC ✅
TP1: 0.055 BTC – ✅
TP2: 0.037 BTC – ✅
TP3: 0.023 BTC – ✅
All targets achieved with precision.
Bearish structure played out as expected.
Current Outlook:
CRYPTOCAP:ETH Price has now entered a historical demand zone, coinciding with major multi-year support levels.
Accumulation Phase Activated –
Starting to scale into long positions from current levels, targeting mid-to-long term reversal setup.
Patience required – this could be the base of the next macro leg up.
Note: NFA & DYOR
#Ethereum
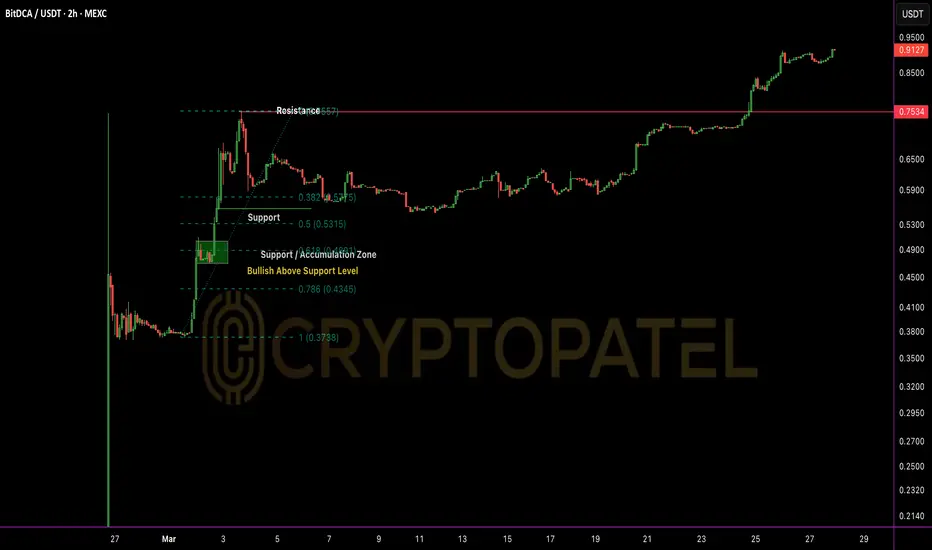
BDCA/USDT 9x up from Listing and 2x form Dip EntryECONOMICS:BDCA Update 🔥
Price just printed a fresh ATH at $0.92, marking a 9x move from pre-listing entry ($0.10) and a 2x rally since our chart-based call at $0.45.
Strong momentum, bullish structure intact.
Expecting further continuation in the short-to-mid term 🚀
#BDCA #CryptoGems #TechnicalAnalysis #Altcoins
NFA & DYOR
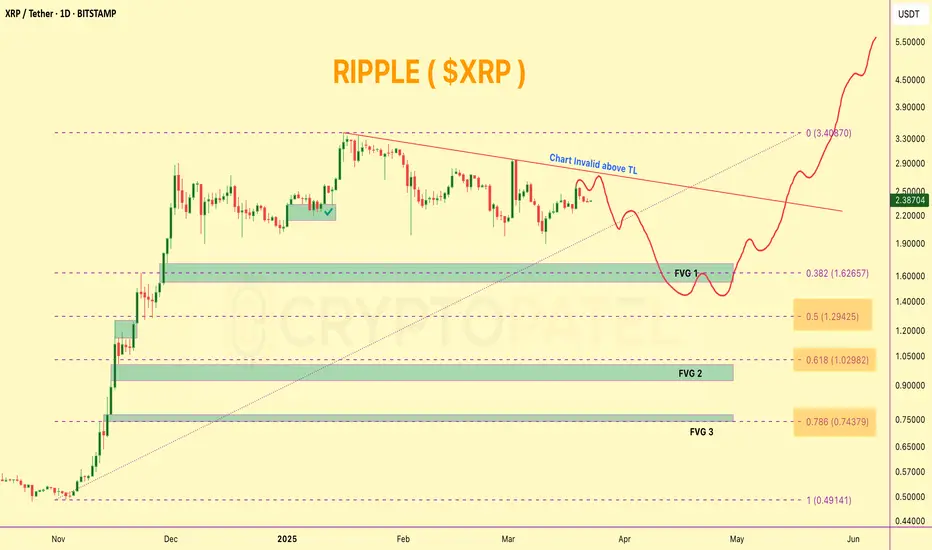
XRP Technical Breakdown – 3 Key Gaps Identified!🚨 XRP Technical Breakdown – 3 Key Gaps Identified!
Hey fam! 👇
I just spotted 3 major GAPS on the CRYPTOCAP:XRP Daily Chart, and they could play a crucial role in XRP’s next big move!
Gap Zones to Watch:
1️⃣ GAP 1 – $1.712 to $1.546
2️⃣ GAP 2 – $1.00 to $0.9268
3️⃣ GAP 3 – $0.772 to $0.64
My Take (IMO):
✔️ In this current super bullish market, GAP 1 has a high probability of being filled before the next leg up toward $5+.
However, if we rely purely on Technical Analysis + Fibonacci levels, the chart indicates that GAP 2 & GAP 3 might need to be filled first before a sustainable upside.
Based on the Fib retracement, if CRYPTOCAP:XRP revisits the 0.618 - 0.786 zones, it could create a powerful reversal and bounce setup from there. That’s a key confluence level for long-term holders and swing traders.
High Liquidity Zones = Opportunity Zones!
All 3 GAPs align with areas of high liquidity – ideal for setting strategic buy orders if you're playing the safe accumulation game.
📢 What do you think?
Do you believe Ripple can drop below $1 again before a new ATH?
Let’s discuss – drop your TA in the comments 💬👇
SOLANA AT FIVE: The High-Speed Blockchain Revolutionizing Crypto📢 SOLANA AT FIVE: The High-Speed Blockchain Revolutionizing Crypto Transactions
What is Solana?
#Solana is a high-performance blockchain designed for speed, scalability, and ultra-low fees. It supports DeFi, NFTs, and Web3 applications with an impressive 65,000 transactions per second (TPS) at almost zero cost!
📌 Founded by: Anatoly Yakovenko
📌 Launched in: March 2020
📌 Market Position: Among the Top 10 Crypto's
Top 3 Highlights of Solana
✅ Ultra-Fast Transactions: Solana’s unique PoH + PoS hybrid model enoS hybrid model ensures high-speed processing.
✅ Low Transaction Fees: Sub-penny costs make it more affordable than Ethereum.
✅ Growing Ecosystem: Used in DeFi, NFT marketplaces, and GameFi, attracting global investors and developers.
How Does Solana Work?
🔹 Proof of History (PoH): A cryptographic clock that timestamps transactions, reducing validation time.
🔹 Delegated Proof of Stake (dPoS): Users stake SOL tokens to secure the network and earn rewards.
🔹 Sealevel: Allows parallel smart contract execallel smart contract execution for improved efficiency.
🔹 Turbine & Gulf Stream: Optimized data transfer and transaction propagation.
Why Use Solana?
✔ Speed: 65,000 TPS vs. Ethereum’s 15 TPS
✔ Low Fees: $0.00025 per transaction
✔ Scalability: No need for Layer-2 solutions like Polygon or Arbitrum
✔ Eco-Friendly: Energy-efficient blockchain
✔ Developer-Friendly: Supports Rust & C++ SDKs
Solana vs Ethereum – Key Differences
▶️Feature | Solana | Ethereum
▶️TPS (Speed) | 65,000+ | ~15
▶️Transaction Fees | <$0.01 | $5-$50
▶️Consensus Mechanism | PoH + dPoS | PoS
▶️Smart Contracts | Rust, C++ | Solidity
▶️Scalability | Built-in (No L2 required) | Requires Layer-2
#Ethereum dominates DeFi & NFTs, but Soires Layer-2Ethereum dominates DeFi & NFTs, but Solana’s high-speed, low-cost model is attracting new projects & users.
Key Use Cases of Solana
🔹 Decentralized Finance (DeFi): Used in Serum, Raydium, Mango Markets
🔹 NFTs & Gaming: Magic Eden, Solanart, Star Atlas, Aurory leverage Solana’s low-cost transactions.
🔹 Smart Contracts & Web3: DAOs, Social Networks, Tokenization projects.
🔹 Crypto Payments: Solana Pay enableay enables instant, fee-less USDC payments, compe comp payments, competing with Visa.
Challenges of the Solana Network
⛔ Network Outages: Several disruptions in 2021-2024 raised concerns.
⛔ Centralization Risks: Fewer validators make it less decentralized than Ethereum.
⛔ Security Issues: Past incidents like the 2022 wallet exploit highlighted risks.
✅ Solution: Firedancer Client Upgrade is expected to enhance network stability.
Solana’s Recent Milestones & Price Performance
📌 2021: SOL hit $260 ATH in the bull run.
📌 2022: Dropped to $9 after FTX collapse.
📌 2023: Massive 1000% rebound, surpassing $100 again.
📌 2024: From $80 to $264 in one year. Visa integrates Solana for stablecoin payments.
📌 2025: New ATH of $295.83, then correction to $110. Over 105M active monthly users in January.
Is Solana a Good Investment?
✅ Pros:
✔ Strong Technical Foundation (PoH + PoS scal Foundation (PoH + PoS scalability)
✔ Growing Adoption & Developer Interest
✔ Institutional Support (Visa, Google Cloud)
✔Support (Visa, Google Cloud)
✔ Active & Expanding Community
❌ Cons:
⚠ Regulatory Uncertainty
⚠ Past Network Downtime Issues
⚠ Strong Competition from Ethereum & Other L1s
📢 Always do your own research before investing in any cryptocurrency.
Final Thoughts – The Future of Solana continues to push the boundaries of blockchain scalability with its ultra-fast transactions and low fees. With growing institutional adoption and ecosystem expansion, CRYPTOCAP:SOL has the potential to compete with Ethereum and beyond.

Will BNB hit $5000 in future?Back in 2020, I said GETTEX:BNB will hit $500 when it was just $16… and y’all laughed. 🤡
But guess what? It didn’t just hit $500… it went all the way to $800—a 50x from my entry! 😎💰
And yeah, right after I entered, GETTEX:BNB dumped almost 62%! 💀😂 But diamond hands win in the end! 💎🙌
Now, it won’t even drop below $500! 😏
Just wait… GETTEX:BNB → $5000 is only a matter of time! ⏳🚀
Not financial advice, so don’t blame me later. DYOR! 😆

Will Ethereum Fall below $1500 or Ready to $8000 ?#Ethereum Fresh Weekly Analysis
🔹 Current Trend: CRYPTOCAP:ETH has dropped -51% in the last 3 months, signaling a major retracement.
🔹 Key Support Zone: Trading above $2000-$1900, a crucial accumulation zone for this bull market.
🔹 Upside Targets: If #ETH holds this support, we could see $6000 / $8000 / $10,000 in the coming months.
🔹 Risk Factor: If ETH fails to hold $2000, expect a potential dip towards $1500—a key level for long-term accumulation.
Smart Strategy:
✅ Accumulate ETH on dips instead of chasing tops.
✅ Wealth is built by buying in bear markets and selling in bull cycles.
✅ Long-term holders should focus on accumulation, not panic selling.
IMO ETH/USDT has strong potential in this bull cycle—buy smart, hold strong!
Note: Not Financial Advice so DYOR

BNBUSDT: A Bullish Setup or a Trap? Key Levels to WatchYello Paradisers! Have you noticed the recent move in BNBUSDT? 📈 Could this be the breakout we’ve been waiting for, or is a retracement lurking in the shadows? Let’s break it down.
💎BNBUSDT has recently formed an inverse head and shoulders pattern, which also aligns with a bull flag formation on the higher timeframe—both strong indications of bullish potential. However, as disciplined traders, we must remain cautious and consider all scenarios.
💎If BNBUSDT breaks out and closes a candle above the resistance zone, the likelihood of a sustained bullish move significantly increases. This would confirm the breakout and signal a potential rally.
💎On the other hand, the probability of a retracement remains on the table. Should this happen, we would look for a bounce from the bullish order block (OB). To further increase the probability in our favor, waiting for a bullish internal change of character (I-CHoCH) would be prudent before entering any positions.
💎However, in the case of a breakdown with a candle close below the Bullish OB, the entire bullish idea would be invalidated. If this happens, patience will be key—waiting for stronger price action at better levels will provide higher-probability setups.
🎖This is why, Paradisers, we emphasize the importance of strategy and discipline in trading. Whether it's a breakout or breakdown, sticking to your plan is the only way to achieve long-term success. Stay vigilant, stay patient, and always trade smart. 💪
MyCryptoParadise
iFeel the success🌴

HBAR/USDT now 855% up From our Entry HBAR/USDT Huge Profit Update 🚀
Big congratulations to everyone who followed Cryptopatel's CRYPTOCAP:HBAR analysis! 🎉
➡️ HBAR/USDT is now up 855% from our entry point!
➡️ Entry: $0.037 - $0.040
✅ Target 1: $0.083
✅ Target 2: $0.170
✅ Target 3: $0.252
✅ Target 4: $0.44 (almost reached!)
Now’s a good time to take 80% profit at this level.
If you started with $1000, it’s now worth $8500.
Let’s keep the momentum going. 🚀

DOT/USDT 500% Potential: will it Hit New ATH ?#Polkadot ( CRYPTOCAP:DOT ) Bullish Chart Analysis
🔹 Performance: In just 25 days, DOT has surged 180%, showing strong bullish momentum.
🔹 Entry Strategy: Price is settling—look for the best entry zone for potential gains.
Best Entry Zone: $7.80 - $6.50 (Key FVG area).
Targets: $16 / $23 / $32 / $45 / Bonus Levels 🚀
Red Box Insight:
Strong Resistance Zone: Watch the red box closely.
Breakout Potential: If DOT breaks the red box, it could trigger a massive upward rally.
Support Flip: After breaking, this resistance will turn into a strong support zone.
⚠️ Risk Note: This entry carries risk. If you decide to enter, use a minimum amount and manage your risk carefully.

PROS/USDT 300% Potential as per chart analysis#PROS/USDT Chart Analysis
🔹 Support Level: PROS is holding strong above the $0.60 support level.
🔹 Potential Upside: If $0.60 support holds, targets of $2-$3 are possible in the coming days.
Risk-Reward Ratio:
Risk: ~20% (if it goes below $0.60).
Reward: 200%-300% potential gains.
Pro Tip: Always consider your risk-reward ratio and follow strict risk management.

IOST/USDT Technical Analysis: Breakout Setup with Massive PotentIOST/USDT Technical Analysis: Breakout Setup with Massive Potential
$IOST is currently testing a critical HTF resistance zone near the $0.0068 level. A confirmed breakout above this red box resistance could initiate a significant rally, with potential upside between 500%-1000% in the ongoing bull market.
Key Levels to Watch:
Resistance: $0.0068 (Breakout Zone)
Accumulation Zone: $0.0070 - $0.0065
Stop Loss: $0.0042
Potential Bull Market Targets:
1️⃣ $0.012
2️⃣ $0.021
3️⃣ $0.040
4️⃣ $0.072
Technical Outlook:
The chart structure suggests strong bullish momentum if resistance is broken.
Historical price patterns and the current market environment favor a high probability of a parabolic move.
Keep an eye on the breakout confirmation above $0.0068 for the next leg up. 🚀

Will Bitcoin History Repeat after US Election ?#Bitcoin and US Elections: History Repeats?
Looking back at the last two US elections, we’ve seen a strong Bitcoin bull market follow each one. Let’s take a look:
📅 2016 US Election (November):
➡️ Before the election, BTC was at $700
➡️ Within a year, BTC soared to $19,900
📅 2020 US Election (November):
➡️Pre-election price: $13,600
➡️ Just a year later, BTC hit an all-time high of $69,000!
Now, with the US election tomorrow, is this another CRYPTOCAP:BTC buying opportunity based on past trends?
🔮 My Prediction: By next year, November 2025, #BTC could reach $150,000 - $180,000.
Let’s see if history repeats!
#Crypto #BullMarket
