RSI Divergence part 2The relative strength index (RSI) is calculated using the following formula: RSI = 100 – 100 / (1 + RS) Where RS = Average gain of up periods during the specified time frame / Average loss of down periods during the specified time frame asset price is considered overbought (due for a correction) when RSI is above 70, and oversold (due for a rebound) when it is below 30. Some traders use more extreme levels (80/20) to reduce false readings.
In a strong uptrend, RSI will often reach 70 and beyond for sustained periods, and downtrends can stay at 30 or below for a long time. While general overbought and oversold levels can be accurate, they may not provide the most timely signals for trend traders.
Bnknifty

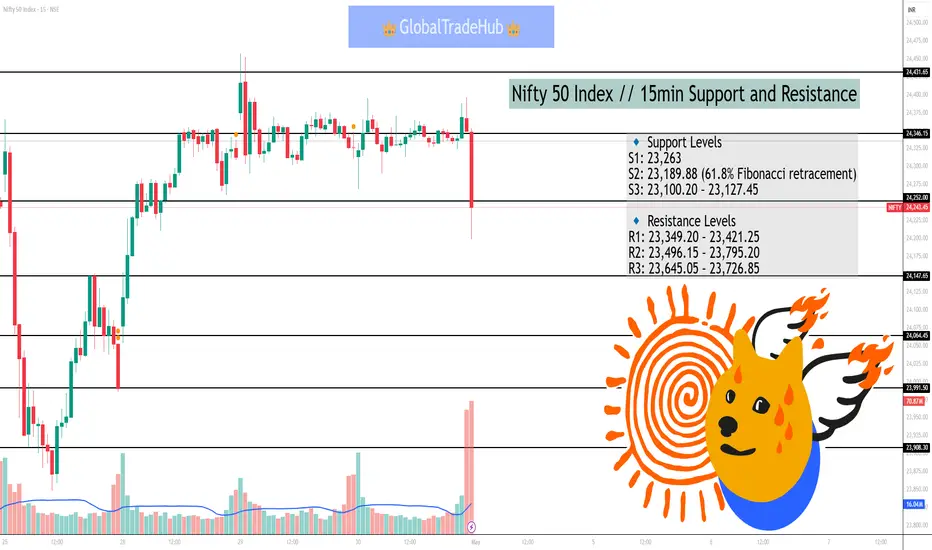
Nifty 50 Index // 15min Support and ResistanceAs of May 1, 2025, at 9:04 AM IST, the Nifty 50 index is trading at approximately 23,630. Based on recent intraday analysis, here are the key 15-minute support and resistance levels:
🔹 Support Levels
S1: 23,263
S2: 23,189.88 (61.8% Fibonacci retracement)
S3: 23,100.20 – 23,127.45
🔹 Resistance Levels
R1: 23,349.20 – 23,421.25
R2: 23,496.15 – 23,795.20
R3: 23,645.05 – 23,726.85
These levels are derived from recent intraday analysis and are subject to change with market conditions. It's advisable to monitor the stock's price movements and consult with a financial advisor before making any trading decisions.
RSI MeaningRSI stands for Relative Strength Index. It's a technical indicator used in financial markets to measure the speed and magnitude of recent price changes, helping traders identify potential overbought or oversold conditions. The RSI, developed by J. Welles Wilder Jr., typically ranges from 0 to 100. A value above 70 generally suggests an asset is overbought, while a value below 30 may indicate it's oversold.

Basic to Advance in TradingMake profits in intraday.
Stock market concepts and workings explained from very basic level.
Learn powerful day trading strategies.
Learn a step by step approach of how to trade in intraday.
Trend Following (Wealth Generation)
Learn the art of minimizing the risk and maximizing the return.

Technical TradingIn trading, "technical" refers to the practice of analyzing historical price and volume data to identify patterns and predict future price movements. This approach, called technical analysis, is a way to evaluate securities and forecast their behavior based on charts and statistical data.

Technical TradingIn trading, "technical" refers to the practice of analyzing historical price and volume data to identify patterns and predict future price movements. This approach, called technical analysis, is a way to evaluate securities and forecast their behavior based on charts and statistical data.

Option Trading AmalysisTop Option Trading Indicators
-Relative Strength Index (RSI) The relative strength index (RSI) is one of the most commonly used indicators. ...
-Bollinger Bands. ...
-Intraday Momentum Index (IMI) ...
-Money Flow Index (MFI) ...
-Put-Call Ratio (PCR) Indicator. ...
-Open Interest (OI)

Option Chain TradingAn option chain is a comprehensive listing of all available option contracts for a specific underlying asset, typically organized by expiration date and strike price. It provides a detailed view of call and put options, their premiums, and other relevant information like bid/ask prices, volume, and open interest. This tool is crucial for options traders to analyze market conditions, identify potential trading opportunities, and choose the right options contracts based on their investment strategy.

Advanced Divergence Trading Basically, a divergence exists when your indicator does not “agree” with price action. Granted, this is very basic and we will now explore more advanced divergence concepts and see how to trade them, but it's important to build a solid foundation. Bearish and bullish divergence. Price and indicator are out of sync.

Option Trading An option is a contract that represents the right to buy or sell a financial product at an agreed-upon price for a specific period of time. You can typically buy and sell an options contract at any time before expiration. Options are available on numerous financial products, including equities, indices, and ETFs.

Database trading InfluxDB is a high-performance, purpose-built time-series database designed for real-time analytics. It boasts low-latency writes, efficient storage, and a powerful query engine tailored for event-driven systems like algorithmic trading.

Advance Database Trading"Advanced Database Trading" refers to using sophisticated database technologies and techniques to support and optimize trading activities, particularly in financial markets, where speed, accuracy, and efficiency are crucial.

Banknifty for December viewsBanknifty is ready for highs because...
constant bulls (fiis and dis) interesting
in indian market and stocks buyings.
we will see soon Banknifty above + 45800 /46350+ soon might be this is possible end of this year 2023.
Election results in the favor of current central government..that will create positive impact on investor's (fiis & Dis) and market too..


Prediction & levels for Tuesdayhello firends
keep the levels in your watch and trade safe with proper Sl

Garware Technical SwingStock swing can be taken for following reasons :
1) Weekly Timeframe is Bullish
2) Daily Timeframe has tested it's structure
3) 4HR timeframe is also in bullish structure


DECEMBER TARGETSUptill blue line is safe on downside, 3 targets for december are there for swing trade.

Important levels in BankNifty
Important levels in BankNifty
SUPPORT 38394-433 38702-743, 38904 {MOST IMP}
RESISTANCE 39387-437, 39734-782

banknifty future classic range contraction going onbanknifty future previous support of 38000-38200 now became multi time resitance with range contractions..
till it is in a triangle one shoult play support resistance with the pattern...
bigger move expected once it breaks the pattern
till than trade patiently...
views are educational

BANK NIFTY REACHED TARGETBANKNIFTY as our analysis target reached near 36800 lets wait for a sideways market for next expiry

Banknifty No Trade Zone 39954---39795Banknifty no trade zone for intraday 39954---39795
If sustains above this zone than TGT 40200
and if sustains below this zone than 39500
short below 39795 active

BNKNIFTY CPR LEVEL and PROBABLITYBNKNIFTY can remain bullish only if it open gap up above cpr
IF BNK nifty opens gap up then look for first three cases to buy at that level
and if bnk nifty open gap down look for selling opportunity
