Oil India | Bullish Breakout with Institutional Volume Surge💹 Oil India Ltd (NSE: OIL)
Sector: Energy | CMP: ₹438.05 | View: Bullish Breakout Setup
📊 Price Action:
Oil India has shown a strong bullish candle breakout after weeks of consolidation between 410–420. Buyers stepped in aggressively with volume confirmation, pushing price above the short-term resistance. A sustained close above 435 could trigger a fresh up-move toward the 450–455 zone.
HNI Trade Levels (STWP Setup):
Aggressive Entry: 434.75–436.20 | Stop Loss: 416.08
Low-Risk Entry: 432.57 | Stop Loss: 411.75
HNI and institutional buyers are showing strong accumulation interest with rising volumes. The breakout candle indicates smart money entering early into the trend. Sustained buying momentum suggests continued institutional participation ahead.
VCP Analysis:
Oil India is forming a smooth Volatility Contraction Pattern with clear price tightening in recent weeks. Volume contraction followed by today’s strong expansion indicates a potential VCP breakout stage. The surge in volume confirms institutional activity aligning with the final contraction phase breakout.
STWP Trading Analysis:
Entry: 436.20 | Stop Loss: 410.30
Strong bullish momentum with a wide-range candle backed by heavy institutional volumes. The breakout structure signals renewed trend strength with clear directional intent. Sustaining above 430 will keep the momentum in favor of buyers.
Fibonacci Analysis:
Oil India’s Fibonacci structure is plotted from the Swing Low at 384.6 to the Swing High at 491.5, capturing the recent trend wave. The stock is currently trading near the 50% retracement level at 438.05, showing a strong recovery within the ongoing uptrend. Holding above the 38.2% zone at 425.44 will keep momentum intact, while a breakout above the 61.8% level at 450.66 could extend the move toward 468–491, confirming trend continuation.
STWP Support & Resistance:
Resistances: 440.53 | 446.32 | 456.43
Supports: 424.63 | 414.52 | 408.73
While we note the above technical levels, the chart displays resistance zones at 448–456 and 478–491 as relatively weak, indicating limited selling pressure. However, supports near 392–384 and 325–350 appear strong, reflecting firm institutional demand and accumulation interest. This structure suggests a bullish bias, where sustained buying above 440 could trigger continuation momentum toward higher levels.
STWP Volume & Technical Setup:
Oil India delivered a power-packed bullish session today, marked by a strong Marubozu candle that reflected uninterrupted buying momentum from open to close. The chart’s yellow label captures a perfect storm of bullish confirmations — from exceptional volume (6.03M vs 2.48M avg, ratio 2.43x) to a Bollinger Band breakout emerging right after a compression phase, signaling fresh volatility expansion. The RSI breakout, 200 EMA crossover, and BB Squeeze trigger all align to validate institutional accumulation and trend strength. With buyer dominance clearly visible, Oil India stands poised for a momentum-driven continuation in the sessions ahead.
STWP Summary View:
Final Outlook:
Momentum: Strong | Trend: Bullish | Risk: Low | Volume: High
Oil India displays a textbook bullish setup with strong price action, expanding volume, and visible institutional activity.
A high-volume breakout from a tight base confirms trend strength and upside potential. Holding above key supports keeps risk low and the bullish momentum intact.
________________________________________
________________________________________
⚠️ Disclosure & Disclaimer – Please Read Carefully
The information shared here is meant purely for learning and awareness. It is not a buy or sell recommendation and should not be taken as investment advice. I am not a SEBI-registered investment adviser, and all views expressed are based on personal study, chart patterns, and publicly available market data.
Trading—whether in stocks or options—carries risk. Markets can move unexpectedly, and losses can sometimes exceed the money you have invested. Past performance or past setups do not guarantee future results.
If you are a beginner, treat this as a guide to understand how the market works and practice on paper trades before risking real money. If you are experienced, always assess your own risk, position sizing, and strategy suitability before entering trades.
Consult a SEBI-registered financial adviser before making any real trading decision. By engaging with this content, you acknowledge full responsibility for your trades and investments.
Position Status: No active position in (OIL) at the time of analysis.
Data Source: TradingView & NSE India (Past Chart Reference) (Historical levels)
💬 Found this useful?
🔼 Give this post a Boost to help more traders discover clean, structured learning.
✍️ Drop your thoughts, questions, or setups in the comments — let’s grow together!
🔁 Share with fellow traders and beginners to spread awareness.
👉 “If you liked this breakdown, follow for more clean, structured setups with discipline at the core.”
🚀 Stay Calm. Stay Clean. Trade With Patience.
Trade Smart | Learn Zones | Be Self-Reliant 📊
Bollingerbandbreakout

MCX - Bullish W-Pattern (Double Bottom Breakout)________________________________________
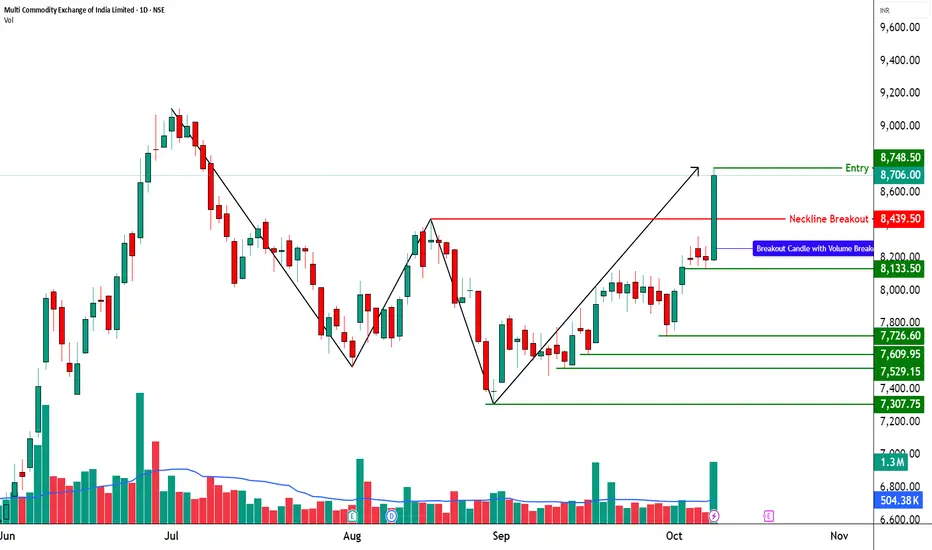
🚀 Multi Commodity Exchange of India Ltd (NSE: MCX) | Bullish W-Pattern (Double Bottom Breakout)
📊 Current Market Snapshot
CMP: ₹8,706.00
Sector: Financial Services / Commodity Exchange
Pattern Observed: 🟢 W-Pattern (Double Bottom Breakout)
Candlestick Signal: Strong Bullish Marubozu + Volume Breakout
Strength Rating: ⭐⭐⭐⭐☆ (High-Conviction Bullish Reversal)
________________________________________
🧭 Technical Indicators
The technical indicators on this chart are flashing strong bullish signals. Momentum is clearly positive, supported by a Bullish Marubozu candle, which reflects strong buying pressure and conviction. The chart also indicates a possible breakout formation, confirmed by a strong bullish candle backed by extremely high volume — a classic sign of institutional participation.
Multiple bullish confirmations like swing trade alignment, intraday signal, RSI breakout, and bullish engulfing pattern further add weight to the uptrend. The Bollinger Band breakout and Bullish VWAP suggest sustained price expansion, while the BB Squeeze-Off hints at volatility returning in favor of the bulls. Altogether, these indicators reinforce a buy-on-dip structure with potential for continuation toward higher resistance zones.
MCX is currently trading in the Progressive Zone, indicating a phase of steady upward momentum where buyers are actively accumulating positions. This zone reflects controlled bullish strength and sustained participation, suggesting that the stock is gearing up for a potential breakout continuation.
The KST (Know Sure Thing) indicator for MCX is in bullish territory, confirming the upward momentum seen in price action. With a strong positive crossover and supportive strength reading, the KST reinforces the ongoing uptrend — indicating that momentum remains firmly in favor of the bulls and the stock could continue its northward journey.
MCX is trading between its Swing High at ₹8,439.5 and Swing Low at ₹7,304. The Top Range near ₹9,115 acts as a major resistance zone, while the Bottom Range around ₹7,304 provides strong support, defining a clear bullish structure with room for further upside if momentum sustains.
________________________________________
📊 Trade Setup (Strong Momentum Entry)
Entry: ₹8,748.50
________________________________________
💡 Learning Note
This setup is a textbook example of a W-pattern (Double Bottom) breakout, where price reverses from a downtrend after forming two clear lows at similar levels. The neckline breakout with heavy volume confirms a shift in market sentiment from bearish to bullish. Such patterns highlight how volume expansion and strong breakout candles validate reversal strength and help traders identify early entry points in new uptrends.
________________________________________
⚠️ Disclosure & Disclaimer – Please Read Carefully
The information shared here is meant purely for learning and awareness. It is not a buy or sell recommendation and should not be taken as investment advice. I am not a SEBI-registered investment adviser, and all views expressed are based on personal study, chart patterns, and publicly available market data.
Position Status: No active position in MCX at the time of analysis.
Data Source: Past Chart reference(Historical levels)
Trading—whether in stocks or options—carries risk. Markets can move unexpectedly, and losses can sometimes exceed the money you have invested. Past performance or setups do not guarantee future results.
If you are a beginner, treat this as a learning guide and practice with paper trades before risking real money. If you are experienced, always assess your own risk, position sizing, and strategy suitability before entering trades.
Consult a SEBI-registered financial adviser before making any real trading decision. By engaging with this content, you acknowledge full responsibility for your trades and investments.
________________________________________
💬 Found this useful?
🔼 Give this post a Boost to help more traders discover clean, structured learning.
✍️ Drop your thoughts, questions, or setups in the comments — let’s grow together!
🔁 Share with fellow traders and beginners to spread awareness.
👉 “If you liked this breakdown, follow for more clean, structured setups with discipline at the core.”
🚀 Stay Calm. Stay Clean. Trade With Patience.
Trade Smart | Learn Zones | Be Self-Reliant 📊
________________________________________
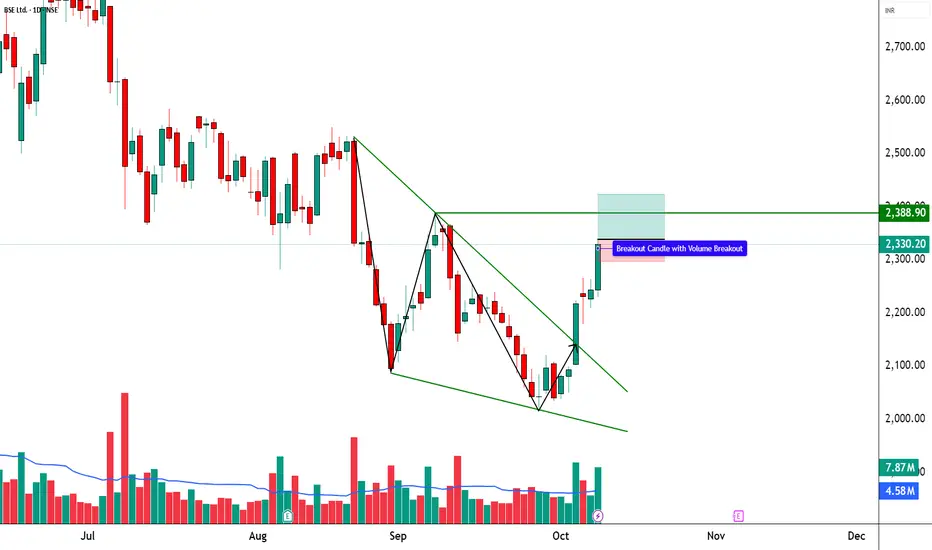
BSE | Intraday Bullish Setup📈 **BSE LTD | Bullish Breakout + SuperTrend Flip 🚀**
STWP Trade Analysis
🔹 **Entry Zone:** ₹2,328 – ₹2,334
🔹 **Stop Loss:** ₹2,296 (Risk ~₹32)
🔹 **Supports:** 2,305 / 2,265 / 2,232
🔹 **Resistances:** 2,388 / 2,423 / 2,450
🔑 **Key Highlights**
✅ Strong Bullish Candle — Breakout above consolidation with volume surge
✅ RSI & BB Expansion — Momentum revival confirmation
✅ SuperTrend Flip — Short-term trend turns bullish
✅ BB Squeeze-Off → Fresh volatility expansion underway
💡 **Learning Note**
This setup highlights how **volume-backed breakouts** aligned with **SuperTrend and RSI confirmation** provide high-probability entries. When volatility expands after a squeeze and price clears resistance with momentum, it often signals **institutional breakout strength** and **early trend continuation**.
⚠️ Disclosure & Disclaimer – Please Read Carefully
The information shared here is meant purely for learning and awareness.
It is not a buy or sell recommendation and should not be taken as investment advice.
I am not a SEBI-registered investment adviser, and all views expressed are based on personal study, chart patterns, and publicly available market data.
Position Status: No active position in BSE at the time of analysis.
Data Source: TradingView & NSE India (Past Chart Reference) (Historical levels)
Trading — whether in stocks or options — carries risk. Markets can move unexpectedly, and losses can sometimes exceed the capital you have invested.
Past performance or setups do not guarantee future results.
If you are a beginner, treat this as a learning example and practice with paper trades before risking real money.
If you are experienced, always assess your own risk, position sizing, and strategy suitability before entering trades.
Consult a SEBI-registered financial adviser before making any real trading decision.
By engaging with this content, you acknowledge full responsibility for your trades and investments.
________________________________________
💬 Found this useful?
🔼 Give this post a Boost to help more traders discover structured learning.
✍️ Drop your thoughts, questions, or setups in the comments — let’s grow together!
🔁 Share with fellow traders and beginners to spread awareness.
👉 “If you liked this breakdown, follow for more clean, structured setups with discipline at the core.”
🚀 Stay Calm. Stay Clean. Trade With Patience.
Trade Smart | Learn Zones | Be Self-Reliant 📊
STWP Analysis | ICICI Bank Showing Classic Breakout Behavior________________________________________
💼 ICICI BANK (NSE: ICICIBANK) | CMP ₹1436.60 (+1.36%)
Sector: Banking & Financial Services | Date: 19 Oct 2025
________________________________________
📊 Chart Summary
ICICI Bank closed strong at ₹1436.60, gaining +1.36% from its previous close of ₹1417.30.
Price made a high of ₹1439.60 — exactly around the Fibonacci resistance zone of ₹1439.85.
Volumes surged to 1.76x the average, with 1.70 crore shares traded against an average of 1.35 crore — indicating strong participation and renewed interest.
________________________________________
🟡 Technical Indicators Summary (Yellow Label Insight)
The chart highlights Bullish Momentum supported by a Strong Bullish Candle, indicating renewed buying interest.
A clear RSI breakout (68.36) confirms strengthening momentum, while the Bollinger Band breakout signals expanding volatility — often a precursor to a sharp directional move.
MACD at 8.33, CCI at 203.06, and Stochastic at 96.91 collectively point to short-term strength, while VWAP at 1427.77 serves as immediate support.
This confluence of volume + structure + volatility aligns perfectly for a potential breakout continuation.
________________________________________
📈 Price Action & Key Levels
The stock has been moving within a base range of ₹1342.6 – ₹1500, and has now approached the upper resistance band.
Immediate Resistance: 1447 / 1458 / 1476
Immediate Support: 1418 / 1400 / 1390
VWAP: 1427.77
A sustained close above 1439.60–1440 can confirm a bullish breakout, with upside potential toward 1466.30 → 1500 zone.
________________________________________
🧭 STWP Trade Analysis
Bias: Bullish
Breakout Level: Above 1439.60
Intraday Support: 1428
Swing Support: 1384
Intermediate Support: 1342
Momentum: Moderate
Trend: Bullish
Risk: Low
Volume: High
📌 Observation: The candle structure suggests a “volume-backed breakout” that may see short-term profit-booking near 1447 but remains structurally bullish if above VWAP.
________________________________________
🧾 Quick View: Q2 FY26 Results Snapshot
ICICI Bank reported a 5% YoY rise in PAT to ₹12,359 crore, supported by a 7.4% rise in Net Interest Income (₹21,529 crore) and improved asset quality.
Lower provisions and healthy loan growth kept the bottom line stable, while core operating profit rose 6.5% YoY.
With a clean balance sheet and improving credit metrics, the results complement the ongoing bullish technical setup — reinforcing confidence in trend continuation.
________________________________________
🧩 Final Outlook
ICICI Bank exhibits bullish momentum with low-risk positioning.
The current move represents a technical + fundamental confluence breakout, supported by strong volumes and improving financial health.
Traders may watch for price action near 1439–1447 zone for confirmation and potential swing continuation toward ₹1500 in the coming sessions.
________________________________________
🧠 Learning Note (Educational Purpose)
This setup perfectly demonstrates how volume expansion + momentum oscillator alignment + earnings strength often precedes meaningful breakouts in large-cap banking stocks.
Always track VWAP & RSI stability post-breakout — they often determine whether the move sustains or fades.
________________________________________
⚠️ Disclosure & Disclaimer (SEBI-Compliant)
This content is created solely for educational and informational purposes to help readers understand technical analysis and market structure.
It does not constitute investment advice, research recommendation, or a solicitation to buy or sell any security.
The author is not a SEBI-registered investment adviser or research analyst.
All charts, patterns, and levels are based on personal study and historical data available from public sources such as TradingView and NSE India.
Position Status: No active position in ICICIBANK at the time of publication.
Trading and investing involve risk. Market movements can be unpredictable, and losses may exceed invested capital.
Readers are strongly advised to consult a SEBI-registered investment adviser before making any trading or investment decisions.
By engaging with this post, you acknowledge that you take full responsibility for your own trades, decisions, and outcomes.
________________________________________
💬 Found this useful?
🔼 Boost this post to support structured learning content.
✍️ Share your thoughts, questions, or observations — let’s grow together!
🔁 Share with learners and traders to promote responsible market education.
👉 “If you liked this breakdown, follow for more disciplined, educational trade setups.”
🚀 Stay Calm. Stay Clean. Trade With Patience.
Trade Smart | Learn Zones | Be Self-Reliant 📊

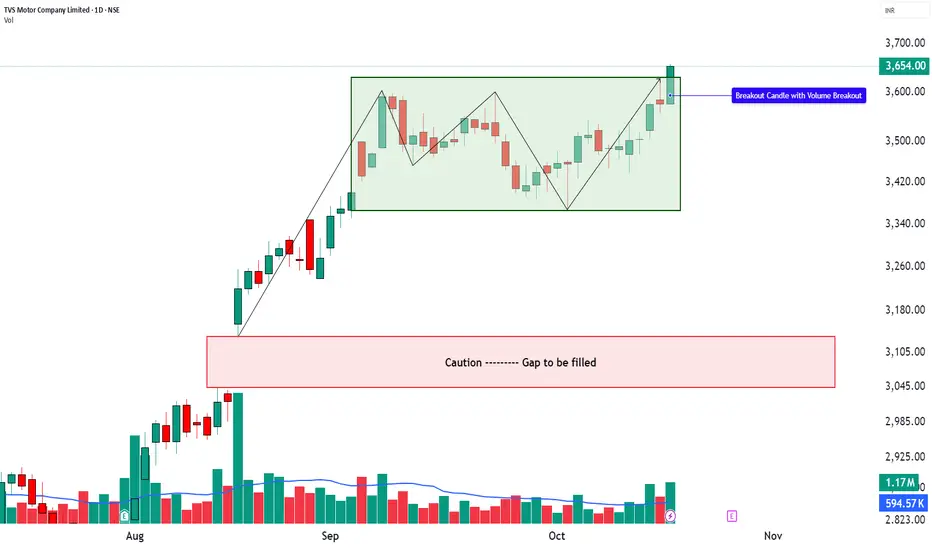
TVS Motor | 52-Week Breakout Case Study________________________________________
🏍️ TVS MOTOR (NSE: TVSMOTOR) | CMP 3,658.00
Sector: Auto & 2-Wheeler | Date: 19 Oct 2025
________________________________________
📊 Chart Summary
TVS Motor has delivered a 52-week breakout with a strong bullish Marubozu candle, signalling aggressive buying momentum.
The stock closed firmly near day’s high, reinforcing confidence among participants.
This move comes after a sustained consolidation phase, with volumes spiking well above the short-term average — confirming institutional and HNI participation around the 3,650 zone.
Structurally, the stock is transitioning from a Consolidation Phase into an Expansion Phase, marking the possible beginning of a fresh markup leg.
________________________________________
🟡 Technical Indicators Summary
The chart highlights Bullish Momentum supported by a Strong Bullish Marubozu, indicating conviction among buyers.
A clear RSI breakout (76) confirms strengthening momentum, while the Bollinger Band breakout and BBSqueeze-Off suggest volatility expansion — often preceding strong directional moves.
MACD at 5.54 shows a positive crossover, CCI 205.96 signals extended strength, and Stochastic 98.62 confirms short-term over-extension yet strong momentum.
VWAP support at 3,639.46 keeps intraday trend structure intact.
This confluence reflects multi-indicator alignment — the kind of structure often seen in sustained breakout phases.
________________________________________
📈 Price Action & Key Levels
Resistance: 3683 / 3712 / 3765
Support: 3600 / 3547 / 3518
VWAP: 3639.46
The breakout occurred above 3,658, which now acts as a pivot zone.
Sustaining above this level could keep momentum active, whereas any dip toward VWAP or ₹3,600 may offer short-term retest potential.
________________________________________
🧭 STWP Trade Analysis
Bias: Bullish
Breakout Level: Above 3658
Intraday Support: 3626
Swing Support: 3501
Intermediate Support: 3274
Momentum: Moderate
Trend: Neutral (Turning Bullish)
Risk: Low
Volume: High
📌 Observation: The strong candle structure backed by volume and RSI expansion suggests continued bullish sentiment.
A possible HNI setup was visible near 3654–3658 with support at 3518, while a lower build-up setup is also seen near 3647 with support at 3493 — confirming tiered accumulation.
________________________________________
🧭 STWP Note – Gap-Up Retest Zone
If TVS Motor opens gap-up above ₹3,658, key pullback levels to watch are ₹3,639 (VWAP), ₹3,547 (EMA support), and ₹3,443 (0.786 Fibonacci level). A mild, low-volume pullback toward these zones would represent a healthy retest within the ongoing expansion phase. The breakout remains valid and momentum bullish as long as price holds above ₹3,443.
________________________________________
📘 Learning Perspective (Educational Insight)
TVS Motor’s setup illustrates how multiple bullish confirmations (RSI breakout, MACD crossover, BB expansion, and VWAP strength) can align during a 52-week breakout phase.
The pattern teaches traders to spot volume-backed momentum near higher-timeframe resistance zones — a sign that larger players may be entering.
________________________________________
🧩 Final Outlook
TVS Motor currently displays:
Momentum: Moderate
Trend: Neutral turning Bullish
Risk: Low
Volume: High
While KST remains mildly bearish (34.45), the overall setup hints at a momentum continuation phase, provided the stock sustains above 3626–3600 levels.
Traders should watch price action around 3,683–3,712 for confirmation of follow-through strength.
________________________________________
💬 STWP Mentor Note
When multiple indicators speak in one direction — price, volume, and structure often follow. Watch how VWAP and RSI behave in the next few sessions; that’s where breakout traders can learn the art of patience and precision.
________________________________________
⚠️ Disclosure & Disclaimer (SEBI-Compliant)
This content is created solely for educational and informational purposes to help readers understand technical analysis and market structure.
It does not constitute investment advice, research recommendation, or a solicitation to buy or sell any security.
The author is not a SEBI-registered investment adviser or research analyst.
All charts, patterns, and levels are based on personal study and historical data available from public sources such as TradingView and NSE India.
Position Status: No active position in TVSMOTOR at the time of publication.
Trading and investing involve risk. Market movements can be unpredictable, and losses may exceed invested capital.
Readers are strongly advised to consult a SEBI-registered investment adviser before making any trading or investment decisions.
By engaging with this post, you acknowledge that you take full responsibility for your own trades, decisions, and outcomes.
________________________________________
💬 Found this useful?
🔼 Boost this post to support structured learning content.
✍️ Share your thoughts, questions, or observations — let’s grow together!
🔁 Share with learners and traders to promote responsible market education.
👉 “If you liked this breakdown, follow for more disciplined, educational trade setups.”
🚀 Stay Calm. Stay Clean. Trade With Patience.
Trade Smart | Learn Zones | Be Self-Reliant 📊
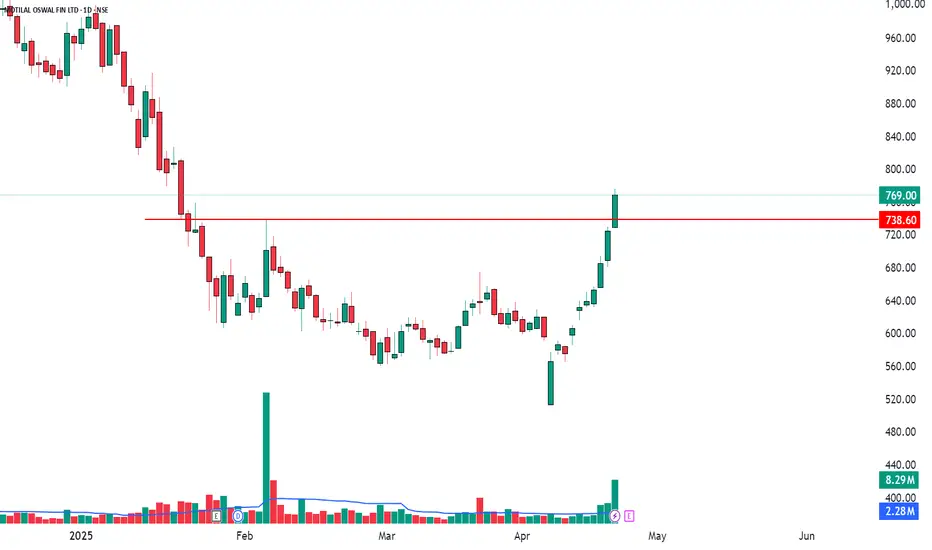
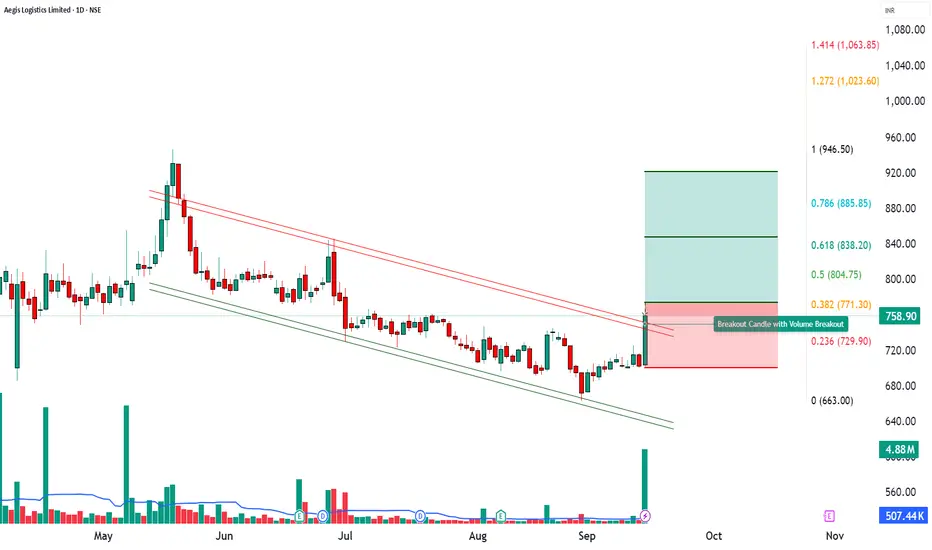
“Aegis Logistics | 20x Volume Breakout Signals Fresh Upside MomAegis Logistics Ltd (CMP: ₹758.90 | +8.07%)
🔎 Technical Outlook:
Aegis Logistics witnessed a 20-day volume breakout with an extraordinary 20X spike in price-volume activity, signaling strong market participation. The stock formed a powerful bullish candle, indicating robust momentum and accumulation interest.
The breakout above recent consolidation zones suggests the potential for a trend continuation if follow-up buying sustains.
________________________________________
📈 Key Levels:
Entry Zone: ₹774
Stop Loss: ₹700.25
Support Levels: 715.5 / 672.1 / 642.85
Resistance Levels: 788.15 / 817.4 / 860.8
Major Resistance Zone: ₹946 – ₹995
________________________________________
🎯 Upside Targets:
Target 1 → ₹847.75
Target 2 → ₹921.50
Target 3 → ₹995.25
Target 4 → ₹1,069
________________________________________
⚡ Why Bullish?
20-Day & 52-Week Volume Breakout confirmation
RSI, Stochastic & MACD supporting bullish bias on daily & weekly charts
Strong momentum candle near breakout zone
Rising interest seen from institutional volumes
________________________________________
📢 Summary:
Aegis Logistics is entering a high-momentum zone. Sustaining above ₹774 can trigger multi-level rallies toward ₹921–₹1,069 in the coming sessions. However, a dip below ₹700 will negate this bullish structure.
📰 Latest News
Aegis Logistics shares surged ~10% in a single day, driven by strong volumes. It was the stock’s highest single-day gain since March. Trading volume hit a four-month high (~31 lakh shares) much above its 20-day average. Business Today
The stock exceeded its 50-day moving average around ₹724, touching resistance zones around ₹763 to ₹772 (100- & 200-day moving averages). Business Today
Additional longer-term news: The joint-venture Aegis Vopak Terminals (AVTL) is planning a ₹2,800 crore IPO to reduce debt and fund expansion; Aegis Logistics has ~50.1% stake in that JV. The Economic Times
Also, an in-principle approval for a new LPG siding (rail facility) at Panambur (New Mangalore Port) for AEGIS Vopak was granted by Palakkad railway division. This could improve LPG logistic flows. The Times of India
📈 Investment Outlook
Aegis Logistics delivered a strong 20-day volume breakout (VolX ≈ 20x) with a sharp bullish candle. Technical momentum plus upcoming catalysts like the JV IPO and new LPG siding approval are fueling sentiment.
________________________________________
📈 Bullish Case – Why the stock could go up
High-volume breakout (20x average) signals institutional accumulation.
Momentum indicators: RSI 63, CCI 177, Stochastic 86 – still bullish.
Sustaining above ₹774 can open upside toward ₹847 – ₹921 initially, then ₹995 – ₹1069.
Positive news: JV IPO plans and LPG siding approval provide structural growth drivers.
📉 Bearish Case – Potential downside risks
Resistance near ₹788 – ₹817 may trigger profit booking.
Failure to sustain above ₹774 could lead to correction back toward ₹729 – ₹715.
Sectoral risks: energy/logistics costs, regulatory delays may hurt sentiment.
⚡ Momentum Case – Short-term Trading Edge
20x volume + bullish MACD on daily and weekly = strong near-term edge.
Bollinger Band breakout adds volatility momentum.
Holding ₹774 may fuel a rally toward ₹847 – ₹921 in 2–5 sessions.
📅 Short-term vs Long-term Perspective
Short-term (1–2 weeks): Test of ₹847–₹921 likely; supports 729–715 are critical.
Long-term (1–3 months): Sustained breakout plus IPO news flow can re-rate stock higher toward ₹995–₹1069.
________________________________________
⚠️ Disclaimer – Please Read Carefully
The information shared here is meant purely for learning and awareness. It is not a buy or sell recommendation and should not be taken as investment advice. I am not a SEBI-registered investment advisor, and all views expressed are based on personal study, chart patterns, and publicly available market data.
Trading — whether in stocks or options — carries risk. Markets can move unexpectedly, and losses can sometimes exceed the money you have invested. Past performance or past setups do not guarantee future results.
If you are a beginner, treat this as a guide to understand how the market works — practice on paper trades before risking real money. If you are experienced, always assess your own risk, position sizing, and strategy suitability before entering trades.
Consult a SEBI-registered financial advisor before making any real trading decision. By engaging with this content, you acknowledge full responsibility for your trades and investments.
💬 Found this useful?
🔼 Give this post a Boost to help more traders discover clean, structured learning.
✍️ Drop your thoughts, questions, or setups in the comments — let’s grow together!
🔁 Share with fellow traders and beginners to spread awareness.
👉 “If you liked this breakdown, follow for more clean, structured setups with discipline at the core.”
🚀 Stay Calm. Stay Clean. Trade With Patience.
Trade Smart | Learn Zones | Be Self-Reliant 📊
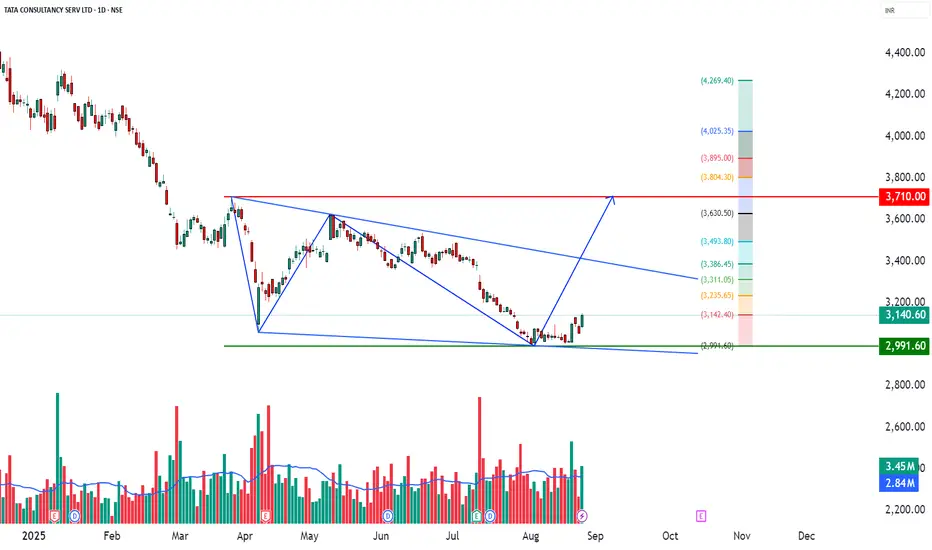
TCS – upport Bounce with Volume Confirmation📊 TCS – Technical & Educational Snapshot
Ticker: NSE:TCS | Sector: 💻 IT Services
CMP: ₹3,140.60 ▲ (+2.84% | 26 Aug 2025)
Learning Bias (for study purpose): ⭐⭐⭐ (Cautiously Bullish)
Pattern Observed: 📈 Support Bounce with Volume Confirmation
📰 Sentiment Analysis
👉 Overall Sentiment: Moderately Positive ✅
Bullish Drivers:
• Bounce from strong support near ₹3,000 with bullish candle & above-avg volume
• RSI breakout + Bollinger Band expansion → fresh buying interest
• Publicly available analyst reports indicate average estimates around ₹3,725; strong bullish case highlighted up to ₹4,610
• IT sector optimism for H2 FY26 earnings recovery
Risks (Bearish Case):
• Broader trend still marked Downtrend ⚠️
• Stochastic at 92 → overbought in short-term
• Employee layoffs & union protests (~12K–30K) may dampen sentiment
• Failure to hold ₹3,047 (support) could trigger deeper correction
Short-term Outlook: Upside momentum possible towards ₹3,160–3,200, but resistance supply zone must be watched.
Long-term Outlook: Positive — strong fundamentals, debt-free balance sheet, consistent dividends, and sector recovery cues.
📊 Technical Snapshot
TCS has formed a support bounce near the ₹3,000 bottom range, supported by a strong bullish candle and above-average volume.
Indicators: MACD bullish on daily/weekly, neutral-to-bearish on monthly.
RSI ~54 → healthy momentum without being overheated.
Trend direction still tagged as Downtrend, hence positional caution is advised.
📊 Volume Check
🔹 Current Volume: 3.45M
🔹 20 SMA Volume: 2.84M ✅
💥 Above-average participation → validates breakout reliability.
💡 Interpretation: Stronger demand from institutions/traders supporting price action.
💡 Learnings
Support bounces near psychological zones (₹3,000 in this case) often attract buying interest.
When combined with RSI breakouts, Bollinger Band expansion, and volume confirmation, the setup becomes more reliable.
However, overbought stochastic warns of possible near-term pullbacks — hence, stop-loss discipline is key.
📌 Key Levels
Resistance: 3,169 | 3,198 | 3,244
Support: 3,094 | 3,048 | 3,019
Fibonacci Reference Levels: 2,991 | 3,142 | 3,235 | 3,311 | 3,386 | 3,494 | 3,631
🎯 STWP Learning Reference
• Observed bounce zone: ~₹3,152
• Key support level: ~₹3,047
• Upside reference zones (if momentum continues): 3,200 | 3,244 | 3,310
• Pullback watch zone: 3,048–3,095
• Invalidation reference: Below 2,991 → momentum weakens
⚠️ Disclaimer – Please Read Carefully
This post is shared only for educational and informational purposes. It is not investment advice or a recommendation to buy/sell any security. I am not a SEBI-registered investment advisor. Please do your own research or consult a SEBI-registered advisor before making trading or investment decisions.
Trading and investing involve risk. Past performance or past setups do not guarantee future results. Always use stop-loss, proper position sizing, and risk management.
💬 Found this useful?
🔼 Boost this post to help more traders discover clean setups.
✍️ Share your thoughts, setups, or questions in the comments — let’s learn together.
🔁 Repost to spread awareness among traders & beginners.
✅ Follow simpletradewithpatience for clean charts, price action insights & beginner-friendly setups.
🚀 Stay Calm. Stay Clean. Trade With Patience.
Trade Smart | Learn Zones | Be Self-Reliant 📊
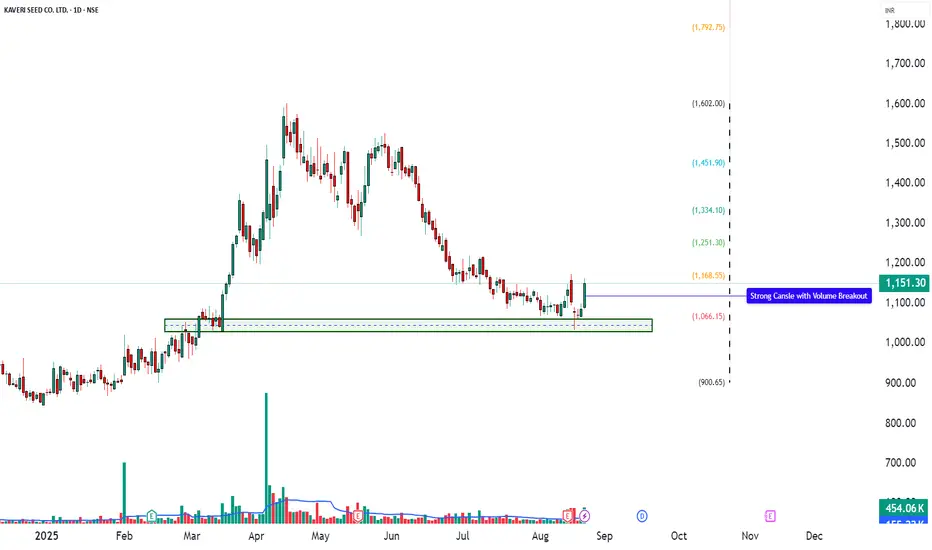
KSCL – Technical & Educational Snapshot📊 KSCL – Technical & Educational Snapshot
Ticker: NSE: KSCL | Sector: 🌱 Seeds & Agro
CMP: ₹1,151.30 ▲ (as of 21 Aug 2025)
Rating (for learning purpose): ⭐⭐⭐⭐
Pattern Observed: 📉 Double Top + Descending Wedge (target near ₹1,000 completed)
KSCL earlier formed a Double Top followed by a Descending Wedge breakdown, with the projected bearish reference zone being successfully achieved. With that completion, the stock has now entered a new phase, displaying fresh bullish momentum. A strong bullish candle, RSI breakout, and Bollinger Band expansion from a squeeze highlight renewed buying strength.
This technical shift points towards a possible trend reversal or at least a medium-term bounce, provided the price sustains above key resistance levels. Supporting indicators (MACD, CCI, Stochastic) are aligned in favor of momentum continuation, adding weight to the bullish case.
📊 Momentum Snapshot:
Momentum indicators are tilting to the bullish side. While Stochastic (84) is moderately elevated, the confluence of RSI breakout, MACD bullish crossover, and strong CCI indicates that momentum could sustain until higher resistance levels are tested.
📊 Volume Check
🔹 Current Volume: 454.06K
🔹 20 SMA Volume: 155.22K ✅
💥 Nearly 3x average volume – confirms strong institutional / broad-based buying interest!
💡 Interpretation:
When volume is well above the 20-period average, it strengthens the reliability of a breakout.
This shows the move is not just retail-driven but likely backed by larger participants.
High-volume breakouts tend to sustain better compared to low-volume moves.
💡 Learnings:
Breakouts emerging from a Bollinger Band Squeeze often lead to strong trending moves as volatility expands. When supported by confirmations such as RSI and MACD turning positive together, the reliability of the breakout improves significantly.
Elevated CCI values reflect strong buying momentum, though traders should remain mindful of possible pullbacks. Above all, defining clear stop-loss and invalidation levels ensures disciplined trade management.
📌 Fresh bullish signals are emerging → but confirmation only comes on sustained move above ₹1,180–1,209. Failure to hold above ₹1,100 may keep it in sideways consolidation or trigger further downward pressure.
🔑 Key Levels
Resistance: 1180 | 1209 | 1256
Support: 1104 | 1057 | 1028
Fibonacci Levels: 900.65 | 1066.15 | 1168.55 | 1251.30 | 1334.10 | 1451.90 | 1602
Pullback Level: Around 1104–1110 zone (first support & prior base)
Invalidation Level: Close below 1057 (would negate the bullish setup)
📝 STWP Trade Setup
📌 Entry (Long): Above 1,162
🛡 Stop Loss: 1,059 or below
🎯 Reference Levels: 1264 | 1366
⚠️ Disclaimer – Please Read Carefully
The information shared here is meant purely for learning and awareness. It is not a buy or sell recommendation and should not be taken as investment advice. I am not a SEBI-registered investment advisor, and all views expressed are based on personal study, chart patterns, and publicly available market data.
Trading — whether in stocks or options — carries risk. Markets can move unexpectedly, and losses can sometimes exceed the money you have invested. Past performance or past setups do not guarantee future results.
If you are a beginner, treat this as a guide to understand how the market works — practice on paper trades before risking real money. If you are experienced, always assess your own risk, position sizing, and strategy suitability before entering trades.
Consult a SEBI-registered financial advisor before making any real trading decision. By engaging with this content, you acknowledge full responsibility for your trades and investments.
💬 Found this useful?
🔼 Give this post a Boost to help more traders discover clean, structured learning.
✍️ Drop your thoughts, questions, or setups in the comments — let’s grow together!
🔁 Share with fellow traders and beginners to spread awareness.
✅ Follow simpletradewithpatience for beginner-friendly setups, price action insights & disciplined trading content.
🚀 Stay Calm. Stay Clean. Trade With Patience.
Trade Smart | Learn Zones | Be Self-Reliant 📊
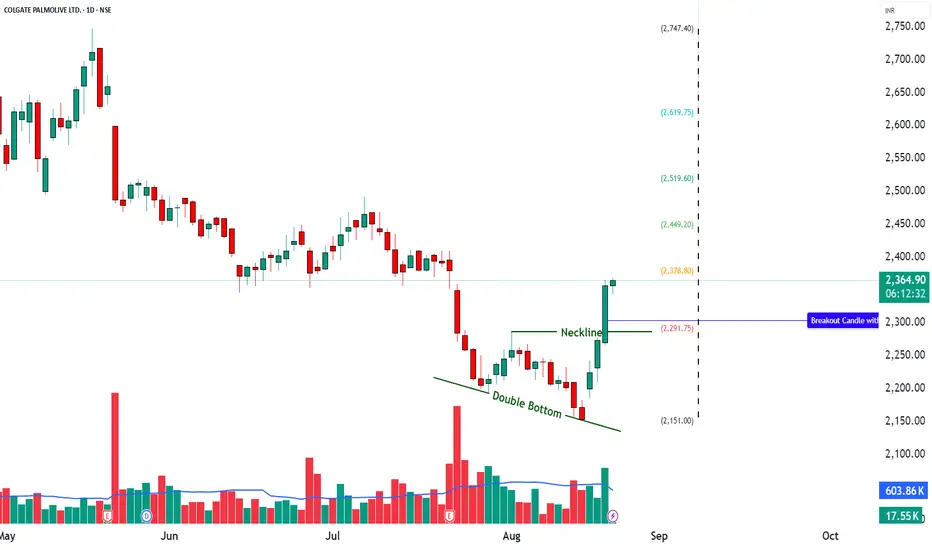
COLPAL - RSI Breakout + Bollinger Band Breakout📊 COLPAL – Technical & Educational Snapshot
Ticker: NSE: COLPAL | Sector: 🪥 FMCG
CMP: ₹ ▲ (as of 20 Aug 2025)
Rating (for learning purpose): ⭐⭐⭐⭐
Pattern Observed: 📈 RSI Breakout + Bollinger Band Breakout
COLPAL is showing strong bullish momentum supported by multiple technical indicators. The presence of a strong bullish candle, along with an RSI breakout at 61, highlights healthy buying pressure. A Bollinger Band breakout and BB Squeeze-Off indicate rising volatility and the possibility of a continuation move. The Bullish SuperTrend adds further confirmation, while momentum indicators (MACD bullish, CCI at 223, Stochastic at 96) signal strong near-term strength.
📊 Momentum Snapshot: Momentum indicators are aligned on the bullish side. While Stochastic shows overbought conditions, strong volume-backed momentum often sustains until key resistance levels are tested.
📊 Volume Check:
🔹 Current Volume: 1.01M
🔹 20SMA Volume: 710.56k ✅
💥 Significantly above average – confirms strong institutional / broad-based buying interest!
💡 Interpretation:
When volume is well above the 20-period average, it strengthens the reliability of a breakout.
It shows that the move is not just retail-driven but likely supported by larger participants.
Breakouts with high volume tend to sustain better compared to low-volume moves.
💡 Learnings:
Breakouts with Bollinger Band expansion often lead to strong follow-through moves.
RSI + MACD confirmation together strengthen trend reliability.
High CCI & Stochastic values show strong momentum but also highlight the importance of monitoring for pullbacks.
Defining pullback and invalidation levels helps in disciplined trade management.
Key Levels:
Resistance: 2393 | 2429 | 2492
Support: 2293 | 2229 | 2193
Pullback Area: 2294
Invalidation Level: Close below 2193
STWP Trade Setup:
Entry (Long): Above 2365
Stop Loss: 2262 or below
Reference Levels: 2467 | 2569
⚠️ Disclaimer – Please Read Carefully
The information shared here is meant purely for learning and awareness. It is not a buy or sell recommendation and should not be taken as investment advice. I am not a SEBI-registered investment advisor, and all views expressed are based on personal study, chart patterns, and publicly available market data.
Trading — whether in stocks or options — carries risk. Markets can move unexpectedly, and losses can sometimes be larger than the money you have invested. Past performance or past setups do not guarantee future results.
If you are a beginner, treat this as a guide to understand how the market works — practice on paper trades before risking real money. If you are an experienced trader, remember to assess your own risk, position sizing, and strategy suitability before entering any trade.
Consult a SEBI-registered financial advisor before making any real trading decision.
By reading, watching, or engaging with this content, you acknowledge that you take full responsibility for your own trades and investments.
💬 Found this useful?
🔼 Give this post a Boost to help more traders discover clean, structured learning.
✍️ Drop your thoughts, questions, or setups in the comments — let’s grow together!
🔁 Share with fellow traders and beginners to spread awareness.
✅ Follow simpletradewithpatience for beginner-friendly setups, price action insights & disciplined trading content.
🚀 Stay Calm. Stay Clean. Trade With Patience.
Trade Smart | Learn Zones | Be Self-Reliant 📊
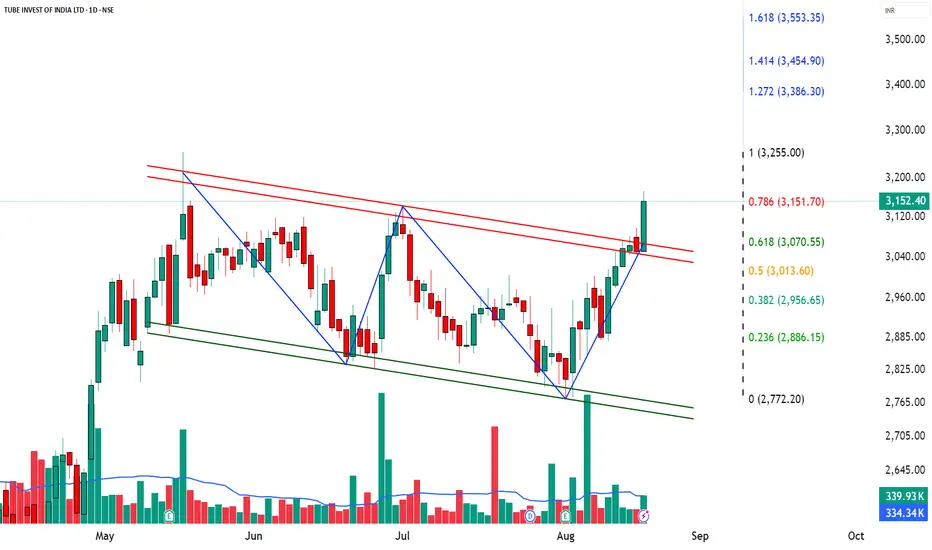
TIINDIA – Technical & Educational Snapshot📊 TIINDIA – Technical & Educational Snapshot
Ticker: NSE: TIINDIA | Sector: 🏭 Industrial Manufacturing
CMP: ₹ ▲ (as of 20 Aug 2025)
Rating (for learning purpose): ⭐⭐⭐⭐
Pattern Observed: 📈 Channel Breakout
TIINDIA is showing strong bullish momentum across multiple technical indicators. The presence of a strong bullish candle, combined with an RSI breakout at 68, indicates significant buying pressure. The Bollinger Band breakout and BB Squeeze-Off suggest increased volatility and the potential for a strong upward move. Bullish VWAP confirms the trend is supported by average price strength, while MACD bullish, CCI at 178, and Stochastic at 95 all point to strong near-term momentum, signaling a likely continuation of the upward trend.
📊 Volume Check:
🔹 Current Volume: 339.93k
🔹 20SMA Volume: 334.34k ✅
💥 Slightly above average – confirming possible buying interest!
💡 Learnings:
Breakouts with above-average volume are more reliable as they indicate real buying interest.
RSI, MACD, CCI, and Stochastic together provide a strong confirmation of momentum.
Bollinger Band squeeze-offs often precede strong directional moves – a good cue for potential entry. Identifying pullback areas and invalidation levels helps manage risk effectively.
Key Levels:
Resistance: 3200 | 3248 | 3323
Support: 3077 | 3002 | 2954
Pullback Area: 3013–3070
Invalidation Level: Close below 2956
STWP Trade Setup:
Entry (Long): Above 3172.90
Stop Loss: 3039.80 or below
Reference Levels: 3306 | 3439
⚠️ Disclaimer – Please Read Carefully
The information shared here is meant purely for learning and awareness. It is not a buy or sell recommendation and should not be taken as investment advice. I am not a SEBI-registered investment advisor, and all views expressed are based on personal study, chart patterns, and publicly available market data.
Trading — whether in stocks or options — carries risk. Markets can move unexpectedly, and losses can sometimes be larger than the money you have invested. Past performance or past setups do not guarantee future results.
If you are a beginner, treat this as a guide to understand how the market works — practice on paper trades before risking real money. If you are an experienced trader, remember to assess your own risk, position sizing, and strategy suitability before entering any trade.
Consult a SEBI-registered financial advisor before making any real trading decision.
By reading, watching, or engaging with this content, you acknowledge that you take full responsibility for your own trades and investments.
💬 Found this useful?
🔼 Give this post a Boost to help more traders discover clean, structured learning.
✍️ Drop your thoughts, questions, or setups in the comments — let’s grow together!
🔁 Share with fellow traders and beginners to spread awareness.
✅ Follow simpletradewithpatience for beginner-friendly setups, price action insights & disciplined trading content.
🚀 Stay Calm. Stay Clean. Trade With Patience.
Trade Smart | Learn Zones | Be Self-Reliant 📊
APOLLOHOSP – Ranging Channel Breakout Case Study (Educational)________________________________________
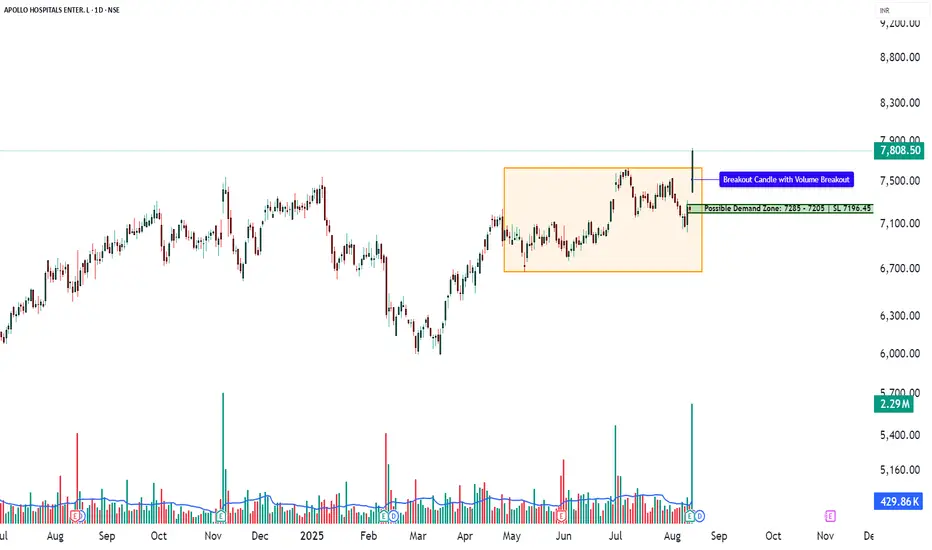
📊 APOLLOHOSP – Technical & Fundamental Educational Snapshot
Ticker: NSE: APOLLOHOSP | Sector: 🏥 Hospitals & Healthcare Services
CMP: ₹7,808.50 ▲ (as of 13 Aug 2025)
Rating: ⭐⭐⭐⭐☆ (Moderately Bullish Setup – Educational Purposes Only)
Pattern Observed: 📈 Ranging Channel Breakout
________________________________________
“Apollo Hospitals is on fire! After reporting a stunning 42% rise in Q1 net profit, the stock zoomed nearly 8%, now hovering near its 52-week high. Technical charts are flashing a powerful ‘Strong Buy’ signal across multiple indicators—momentum is undeniable. With balanced options interest and analyst targets pegged around ₹8,100, the stock may still have room to run. A breakout past ₹7,800 could set the stage for the next leg higher!”
________________________________________
Chart Pattern & Technical Analysis:
Close: ₹7,808.5 — strong bullish momentum after Ranging Channel breakout.
Candle: Big bullish bar with multiple confirmations — 52-week breakout, RSI breakout, MACD crossover, Bollinger Band breakout, bullish SuperTrend.
Momentum: WVAP bullish; RSI 68, MACD Buy, CCI 235, Stochastic 96.
________________________________________
Volume Analysis:
Volume: 2.29M shares traded — 5× the 20-day average (429.86K).
Signal: Exceptional participation confirming a decisive 20-day volume breakout.
________________________________________
Support & Resistance:
Resistance: ₹7,969, ₹8,130, ₹8,420.
Support: ₹7,518, ₹7,228, ₹7,060.7.
Outlook: Possible breakout opportunity with swing trade potential.
________________________________________
Learnings:
Q1 FY26 Results: PAT ↑ ~42% YoY to ₹433 cr; revenue ↑ ~15% YoY to ₹5,842 cr; stock rallied 5–6% post-results.
AI Focus: Plans to double AI investments in 2–3 years to boost efficiency & patient outcomes.
Value Unlocking: Spin-off & listing of digital health & pharmacy unit in 18–21 months.
Share Swap: 195.2 shares in new entity for every 100 Apollo shares; Apollo to retain ~15% stake.
________________________________________
Investment Outlook & Conclusion:
📈 Bullish Case:
5th straight quarter of profit growth; Q1 beat estimates.
Expanding margins via premium care, diagnostics, and digital.
Demerger of digital health & pharmacy arm could unlock value.
AI investments to enhance efficiency & returns.
Rising insurance penetration & healthcare spending favor leaders.
________________________________________
📉 Bearish Case:
Premium valuation risks de-rating if growth slows.
Demerger success hinges on smooth execution.
Regulatory changes could impact margins.
Heavy capex & competition may delay returns.
________________________________________
📅 Short vs Long Term:
Short-term (1–3M): Possible follow-through gains from Q1 beat; track Q2 updates & demerger progress.
Long-term (12–24M): Growth from core hospitals + value creation via digital arm listing & AI-driven efficiency.
________________________________________
📊 STWP Trade Analysis:
Trend: Bullish continuation — price broke key range and sustained momentum.
Sample Trade Setup:
Entry: ₹7,840 | Stop: ₹7,011.95
Reference Levels: ₹8,668 (~1:1 RR), ₹9,496 (~1:2 RR)
💡 These prices are only for demonstrating risk–reward calculations and position planning — not for live execution.
________________________________________
Conservative Setup:
Entry Zone: ₹7,808.50–₹7,840 | Stop: ₹7,723.24
Reference Levels: ₹8,064, ₹8,235
(For learning position sizing and risk control)
________________________________________
Pullback Watch:
Zone: ₹7,717.56 | Stop: ₹7,594 | Potential retest area
Potential Use: Studying pullback retests in breakout structures.
________________________________________
Possible Demand Zone(on Daily Time Frame): 7285 - 7205 | SL 7196.45
This is for observing historical demand behaviour — not a call to buy.
________________________________________
Market View (Based on Current Data):
Overall Bias: Bullish positioning.
Trend: Uptrend likely if ₹7,800–₹7,850 holds as support.
Volatility: Moderate (IV ~22–26).
OI Insight: Strong call writing above spot & put writing below — bullish stance with support defense.
________________________________________
🔍 Option Structures – For Learning Purpose
(Prices, Greeks & OI data are from market snapshot on 13 Aug 2025)
________________________________________
7800 CE – LTP ₹155.60
📊 Delta: 0.54 | Theta: -6.27 | IV: 22.39%
💡 Breakeven: ₹7,955.60
Why it’s worth studying:
ATM strike with quick reaction to spot moves (Delta ~0.50)
Strong OI build-up (+1.52L) & high liquidity (37k contracts)
Positioned just above spot; could capture momentum on a 7,850+ breakout
________________________________________
7600 PE – LTP ₹66.60 | Contra View
📊 Delta: -0.27 | Theta: -4.19 | IV: 25.18%
💡 Breakeven: ₹7,533.40
Why study it:
Strong short build-up in Puts (+3.32L OI) shows confidence price stays above this level
~200 pts below spot, acting as a buffer support zone
Higher IV means time decay favours sellers if support holds
________________________________________
Bull Call Spread
🟢 Buy: 7800 CE @ ₹155.60
🔴 Sell: 8000 CE @ ₹72.20
💰 Net Debit: ₹83.40 | Breakeven: ₹7,883.40
Why study it:
Lowers cost vs. naked CE buy by pairing ATM buy with OTM sell
Positive delta for upside, with loss capped to net debit
8000 strike OI acts as a profit cap zone, helping define risk-reward
Reduces theta decay compared to a single long option
________________________________________
📘 My Trading Setup Rules
Avoid Gap Plays
→ Check pre-open price action to avoid trades influenced by gap-ups/gap-downs.
Breakout Entry Only
→ Enter trades only if price breaks previous day’s High (for bullish trades) or Low (for bearish trades).
Watch Volume for Confirmation
→ Monitor volume closely. No volume = No trade.
Enter on Strong Candle + Volume
→ Execute the trade only if a strong candle appears with increasing volume in the direction of the trade.
Defined Risk:Reward Only
→ Take trades only if R:R is favorable (ideally ≥ 1:2).
Premium Disclaimer
→ Option premiums shown are based on EOD prices — real-time premiums may vary during execution.
Time Frame Preference
→ Trade with your preferred time frame — this strategy works across intraday or positional setups.
________________________________________
⚠️ Disclaimer – Please Read Carefully
The information shared here is meant purely for learning and awareness. It is not a buy or sell recommendation and should not be taken as investment advice. I am not a SEBI-registered investment advisor, and all views expressed are based on personal study, chart patterns, and publicly available market data.
Trading — whether in stocks or options — carries risk. Markets can move unexpectedly, and losses can sometimes be larger than the money you have invested. Past performance or past setups do not guarantee future results.
If you are a beginner, treat this as a guide to understand how the market works — practice on paper trades before risking real money. If you are an experienced trader, remember to assess your own risk, position sizing, and strategy suitability before entering any trade.
Data, prices, and analysis are based on information available as of 12 August 2025, and market conditions can change at any time. Always verify with reliable sources and consult a SEBI-registered financial advisor before making any real trading decision.
By reading, watching, or engaging with this content, you acknowledge that you take full responsibility for your own trades and investments.
________________________________________
💬 Found this useful?
Drop your thoughts, questions, or setups in the comments — let’s grow together!
🔁 Share this post with fellow traders and beginners to spread clean, structure-based learning.
✅ Follow simpletradewithpatience for beginner-friendly setups, price action insights, and disciplined trading content.
🚀 Stay Calm. Stay Clean. Trade With Patience.
Trade Smart | Learn Zones | Be Self-Reliant 📊
________________________________________
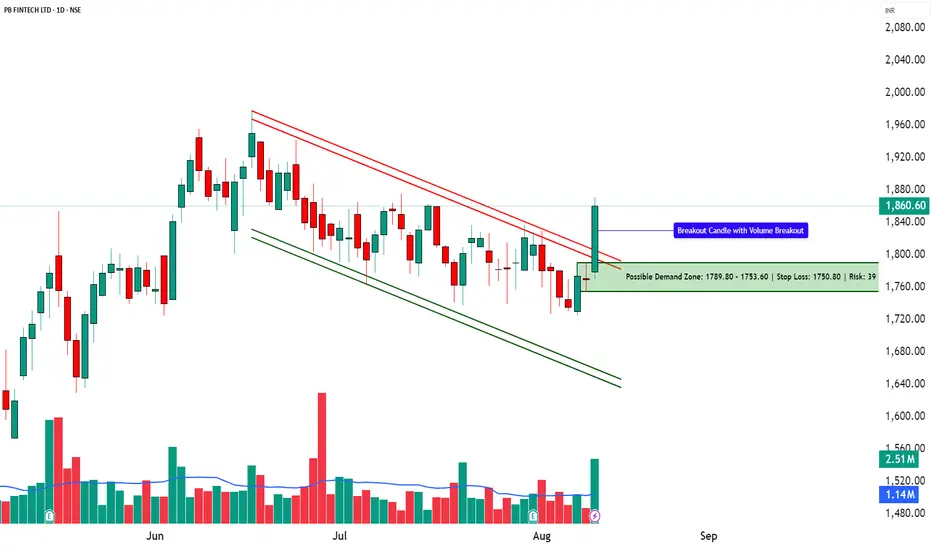
POLICYBZR – Technical & Fundamental Analysis | Channel Breakout📊 POLICYBZR – Technical & Fundamental Educational Snapshot
Ticker: NSE: POLICYBZR | Sector: Digital Insurance & Fintech
CMP: ₹1,860.60
Rating: ⭐⭐⭐ (Neutral to Moderately Bullish Setup – Educational Purposes Only)
Pattern Observed: 📈 Channel Breakout
________________________________________
POLICYBZR (CMP: ₹1,860.6) is exhibiting a Channel Breakout formation, supported by a strong bullish candle. The stock has moved from a bottom range of ₹1,558.4 towards the top range of ₹1,978, with key resistances placed at ₹1,898, ₹1,935, and ₹1,998, while supports are noted at ₹1,797, ₹1,733, and ₹1,696. Technical indicators show RSI at 59 (breakout zone), a bullish MACD crossover, CCI at 122, and Stochastic at 93, indicating strong upward momentum. The price action has also seen a Bollinger Band breakout and is trading above VWAP, suggesting bullish bias. Volume surged to 2.51M shares, significantly higher than the 20-day average of 1.14M, indicating institutional participation. Based on current momentum, there is a possibility of breakout continuation; however, traders should monitor support levels for any reversal signals.
As of early August 2025, PB Fintech’s insurance platform Policy Bazaar has been penalised ₹5 crore by the insurance regulator for certain regulatory lapses, leading to a short-term decline of around 2–3 percent in its share price. Despite this development, the company reported a 33 percent year-on-year increase in Q1 revenues, with net profit rising by 50 percent, supported by a 35 percent growth in core insurance premium collections to approximately ₹6,616 crore. In addition, its enterprise arm has introduced “ClaimSetu”, an AI-powered claims insights and scoring tool for group health insurance, aimed at streamlining documentation and potentially improving claim processing efficiency by up to 50 percent.
From an investment perspective, the outlook for PB Fintech (Policy Bazaar) remains mixed, with both upside potential and downside risks. On the bullish side, sustained revenue growth, rising profitability, and continued expansion in insurance premium collections reflect strong operational momentum. The introduction of AI-driven claim processing solutions could enhance efficiency and customer experience, potentially boosting market share over time. However, the bearish view factors in recent regulatory penalties, heightened compliance scrutiny, and the possibility of short-term sentiment pressure on the stock price. In the short term, price action may remain volatile as the market digests recent developments and broader market conditions. Over the long term, the company’s growth trajectory will depend on successful regulatory compliance, execution of technology-led initiatives, and maintaining a competitive edge in the digital insurance space.
________________________________________
📊 STWP Trade Analysis – Based on the STWP trade framework, a backtest-style example of a possible breakout setup could involve a long entry near ₹1,870.7 with a protective stop at ₹1,722.2. In similar past setups, price movements have reached zones such as ₹2,019 (approx. 1:1 risk–reward) and ₹2,168 (approx. 1:2 risk–reward).
A more conservative hypothetical example might involve an entry in the ₹1,870.70–₹1,860.60 zone, with a protective stop at ₹1,832.48 and potential upside zones at ₹1,945 and ₹2,001 — risk–reward will vary based on entry.
Additionally, a pullback scenario could be illustrated with a potential entry near ₹1,842.9, protective stop at ₹1,805.6, and upside zones aligned with resistance levels.
Possible Demand Zone (Illustrative): ₹1,789.80 – ₹1,753.60 with Stop Loss: ₹1,750.80
Approximate Risk: ₹39
________________________________________
⚠️ Risk Reminder:
Price volatility may increase due to regulatory factors, market sentiment, or broader index trends. Past chart patterns and backtests do not guarantee future performance.
________________________________________
⚠️ Disclaimer (Read Carefully)
This post is for educational and informational purposes only.
The author is not a SEBI-registered investment advisor. No buy or sell recommendations are being made.
All views are based on chart patterns, publicly available data, and personal learning experience.
Trading involves risk. Losses can exceed your investment. Always consult a SEBI-registered advisor before making financial decisions.
By engaging with this content, you agree to these terms.
________________________________________
💬 Found this useful?
Drop your thoughts, questions, or setups in the comments — let’s grow together!
🔁 Share this post with fellow traders and beginners to spread clean, structure-based learning.
✅ Follow simpletradewithpatience for beginner-friendly setups, price action insights, and disciplined trading content.
🚀 Stay Calm. Stay Clean. Trade With Patience.
Trade Smart | Learn Zones | Be Self-Reliant 📊
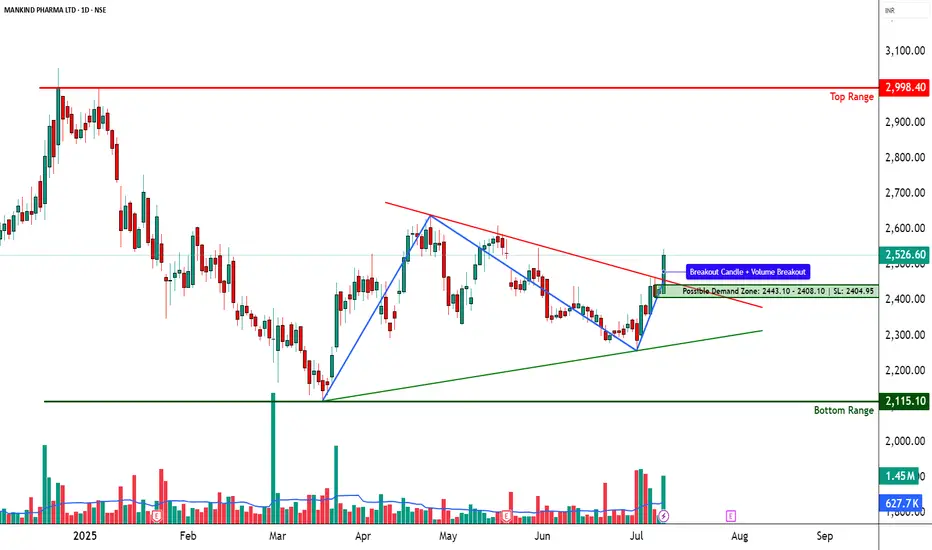
MANKIND PHARMA – Descending Triangle Breakout________________________________________________________________________________📈 MANKIND PHARMA – Falling Trendline Breakout | Strong Reversal Candle | Volume Spike
🕒 Chart Type: Daily Chart
📆 Date: July 9, 2025
________________________________________________________________________________
📌 Price Action:
MANKIND PHARMA has executed a decisive breakout above a falling trendline on the daily chart, breaking out of a multi-week descending structure. The price action had been consolidating within a triangular pattern, and on July 9, it registered a powerful wide-range bullish candle, closing at 2526.60 — well above the recent consolidation highs. This move came from a structured base with two strong pivot lows and now places the stock back into a strong bullish trajectory. The breakout is not random; it’s backed by structure, momentum, and confirmation — suggesting potential for a trend continuation if sustained.
________________________________________________________________________________
📊 Chart Pattern:
The chart shows a descending triangle breakout with compression near the apex. This setup builds pressure and usually resolves in the direction of volume. The move out of this pattern has occurred with authority, marked by a clean range expansion and bullish follow-through above resistance. This is a momentum-confirming breakout, which opens up room toward testing higher resistance zones.
________________________________________________________________________________
🕯️ Candlestick Pattern:
Strong Bullish Candle
Open = Low (Intraday strength)
Buy Today, Sell Tomorrow-type price action
Aligned with Volume Spike and Trendline Breakout
________________________________________________________________________________
🔊 Volume Analysis:
The breakout is accompanied by more than 2x the 20-day average volume, signaling real participation — not just speculative noise. Delivery volumes are notably strong, and volume came after a phase of tight consolidation, which indicates a possible transition from quiet accumulation to active participation by stronger hands.
________________________________________________________________________________
📈 Technical Indicators:
RSI (Daily): 66 – strong, trending up
MACD: Bullish crossover, both on Daily and Weekly
CCI: 220 – highly bullish momentum territory
Stochastic: 94 – overbought but confirming momentum
SuperTrend & VWAP: Clearly bullish
Bollinger Band: Price is expanding beyond upper band — volatility expansion in motion
________________________________________________________________________________
🧱 Support & Resistance:
🔻 Supports:
2448.27 – Immediate support (previous breakout zone)
2369.93 – Structure base support
2322.27 – Last defense before breakout invalidation
Bottom Range / Demand Zone: 2115.1 – Long-term accumulation zone
🔺 Resistance Zones:
2574.27 – First supply zone; watch for price reaction
2621.93 – Medium-term resistance; previously rejected here
2700.27 – Higher timeframe swing resistance
Top Range: 2998.4 – Long-term resistance; breakout confirmation if crossed
________________________________________________________________________________
👀 What’s Catching Our Eye:
What stands out is the confluence breakout — trendline, structure, volume, and indicators are all pointing in the same direction. The BB squeeze, RSI breakout, and strong candle together make this a multi-signal setup — rarely do we get such alignment across tools.
________________________________________________________________________________
🔍 What We’re Watching For:
Will the price hold above 2448–2526 for the next couple of sessions? If yes, this breakout can see momentum continuation toward 2574+. Any low-volume pullback toward the trendline or support zone could be a low-risk re-entry. If it fails to hold above the breakout candle, momentum could fade.
________________________________________________________________________________
✅ Best Buy Level for Equity (Low Risk Idea):
Entry: Above 2543.60 (post-breakout confirmation or clean retest of 2448–2455 zone)
Stop Loss: 2404.95 (on a closing basis)
Risk Reward Strategy: 1:1 initially, trail for 1:2+ if volume expands
Avoid chasing: Let the price validate with sustained volume above breakout
________________________________________________________________________________
💼 Sector Tailwinds:
The pharmaceutical sector is seeing renewed investor interest post-COVID, with growing focus on specialty products, chronic therapy lines, and export-led growth. MANKIND is among the strongest consumer-pharma brands with consistent results and brand recall — adding fundamental strength to this technical breakout.
________________________________________________________________________________
⚠️ Risk to Watch:
A close below 2448 could invalidate this setup
The overbought Stochastic means minor pullbacks or shakeouts are possible
Don’t chase — always confirm the breakout with a retest or follow-through candle
Over-positioning during volatility can lead to poor R:R trades
________________________________________________________________________________
🔮 What to Expect Next:
If this breakout holds, we may see follow-through toward 2574.27 in the short term. Strong volume above 2540+ can unlock upside toward 2621+. However, if the price closes below 2448, we may be dealing with a failed breakout — a scenario to strictly avoid. Watch next 2–3 sessions for clarity.
________________________________________________________________________________
🧠 How to Trade MANKIND PHARMA (For Educational Use Only):
🔹 Breakout Trade Plan
Entry: Above 2543.60
Stop Loss: 2404.95 (Closing basis)
Pullback Entry: Into 2448 zone with bounce candle
Risk-Reward: Start with 1:1, then trail to 1:2+
Position Sizing: Risk-calibrated, never go all-in
________________________________________________________________________________
⚠️ Disclaimer (Please Read):
• This chart is shared for educational purposes only and is not investment advice.
• I am not a SEBI-registered advisor.
• The information provided here is based on personal market observation.
• No buy/sell recommendations are being made.
• Please do your own research or consult a registered financial advisor before making any trading decisions.
• Trading involves risk. Always use proper risk management.
________________________________________________________________________________
💬 Found this helpful?
What’s your ideal approach to this setup — breakout entry or pullback into zone?
Drop your thoughts or questions in the comments below ⬇️
🔁 Share this post with your trading community
✅ Follow STWP for clean technical setups backed by price action and volume
🚀 Let’s trade with patience, logic, and clarity!
Be Self-Reliant | Trade with Patience | Learn with Logic
________________________________________________________________________________
BLUE STAR LTD. – TECHNICAL ANALYSIS📈 BLUE STAR LTD. – TECHNICAL ANALYSIS
📆 Date: July 1, 2025 | ⏱ Timeframe: Daily Chart
🔍 Educational Breakdown – For Learning & Study Use Only
________________________________________________________________________________
🔹 Price Action Zones
• 🔴 Top Range (Resistance): 2417
• 🟢 Bottom Range (Support): 1521
________________________________________________________________________________
🔹 Chart Pattern: ✅
Rectangle/Box Consolidation Breakout – Price was range-bound in a tight zone and has given a strong breakout on high volume, indicating bullish intent.
________________________________________________________________________________
🔹 Reversal Candlestick Patterns
• Top Range (2417): ⛔ No recent candlestick activity visible at the top range.
• Bottom Range (1521): Todays Candle
✅ Bullish Engulfing + Strong Bullish Candle
✅ RSI Bounce + Volume Spike
✅ Confirmed by Price Action and Momentum Indicators
________________________________________________________________________________
📊 Trade Plan (Based on Reason and Logic)
🔼 Bullish Trade Setup:
• Entry: 1715 (Breakout Candle Close)
• Stop Loss: 1614.45 (Below consolidation and bullish candle)
• Target 1: 1850
• Target 2: 1980
• Reason:
o Strong breakout with above-average volume
o Multiple confirmations (RSI, Bollinger Band, Supertrend)
o Box breakout with previous supply cleared
________________________________________________________________________________
🔽 Bearish Trade Setup:
• If price fails to sustain above 1715 and closes back below 1680 zone
• Entry: Below 1665 (Fakeout confirmation)
• SL: Above 1715
• Target: 1615 / 1550
• Reason: Potential failed breakout & liquidity trap
________________________________________________________________________________
📌 Disclaimer
This analysis is shared for educational and study purposes only. It does not constitute investment advice. The author is not SEBI-registered. Please consult a SEBI-registered advisor before making trading decisions. Always use proper risk management and trade only with confirmation.
________________________________________________________________________________
💬 Comments
What’s your view on Britannia?
Drop your thoughts and chart setups
________________________________________________________________________________

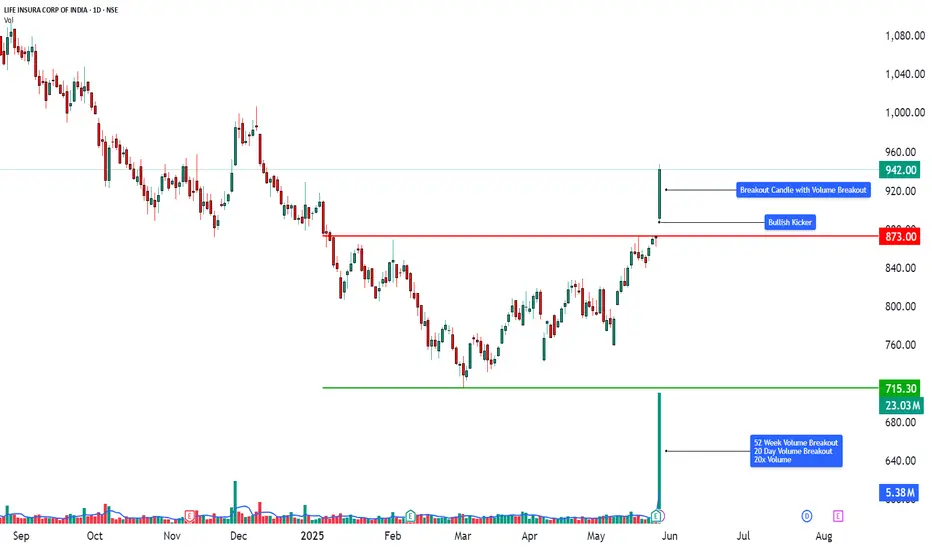
Technical Analysis | Powerful Price Action with Volume Breakout📈 LIFE INSURANCE CORPORATION OF INDIA (LICI) – TECHNICAL ANALYSIS
📆 Date: May 28, 2025
🔍 Timeframe: Daily
________________________________________
Price Action:
LICI surged over 8.12% in today’s session, registering a breakout after weeks of sideways consolidation. The breakout candle was wide-bodied, closing near the day’s high, and supported by a 20-day volume breakout – signaling fresh bullish momentum and accumulation at lower levels.
________________________________________
Chart Pattern / Candlestick Pattern:
• Sideways Consolidation Breakout
• Strong Bullish Candle (Buy Today, Sell Tomorrow setup)
• 52-Week Volume Breakout
• RSI Breakout
• BB Squeeze Exit – Volatility Expansion Phase
• Bollinger Band Expansion + Momentum Surge
• Multiple bullish candlestick patterns across all timeframes = multi-frame trend alignment.
• Gap-Up + Kicker + Long White Candle combo increases conviction of momentum breakout.
• Heikin Ashi continuity indicates a trend in motion without signs of reversal.
________________________________________
Technical Indicators:
• RSI (Daily): 79 – Bullish territory
• MACD: Bullish crossover active
• Stochastic: 97 – Overbought but confirms momentum
• CCI: 206 – Strong upside acceleration
• Volume: 23.03M – Very high vs. 2.24M average, confirms breakout
________________________________________
Support & Resistance Levels:
• Immediate Resistance: ₹964
• Next Resistance: ₹986
• Major Resistance: ₹1024
• Immediate Support: ₹904
• Secondary Support: ₹866
• Major Support: ₹844
• Weak Support Zone: ₹760–₹720
________________________________________
Chart Overview:
This visual representation highlights:
🔸 Clear resistance break with powerful volume
🔸 Bullish momentum confirmed by multiple indicators
🔸 20-day volume breakout indicating accumulation
🔸 Layered resistance levels between ₹964–₹1024
🔸 Tight squeeze breakout offering high R:R setups
________________________________________
Educational Breakdown:
This trade setup showcases:
• Breakout Confirmation: Price + Volume + Momentum Alignment
• Band Expansion: Beginning of volatility trend
• Momentum Shift: From sideways to bullish trend
• Volume Behavior: Institutional interest clearly visible
• Support Layering: Gives fallback levels for pullback traders
Such a chart is a perfect case study in breakout trading, especially post-consolidation and on high volume days.
________________________________________
How to Trade LICI (for learning purpose):
• Entry Example: ₹942.00
• Stop Loss: ₹844.00 (Risk: ₹98.00)
• Target 1: ₹964.00 (Reward: ₹22.00)
• Target 2: ₹986.00 (Reward: ₹44.00)
• Target 3: ₹1024.00 (Reward: ₹82.00)
• Sample Quantity: 50 shares
• RR Ratio: Short-term ~1:0.5; Swing ~1:1 or more
• Aggressive Traders: Can trail stop-loss as price approaches ₹986
• Conservative Traders: Wait for dip toward ₹904 or ₹866 zones
________________________________________
This breakout setup is ideal for swing trades, backed by strong volume and momentum indicators. However, since the RSI and Stochastic are in the overbought zone, traders should manage risk through stop-losses or wait for minor retracements for safer entries.
⚠️ Risk Management Tip: Always trade with a clearly defined stop loss. Avoid entering positions impulsively. It is advisable to start with a smaller quantity and increase your exposure only if the price action confirms the continuation of the trend. Capital protection should always be the priority.
📢 Disclaimer
This content is created purely for educational and informational purposes. It is not intended as investment advice, stock recommendations, or trading tips. Trading and investing in the stock market involves risk. Please consult with a SEBI-registered financial advisor before making any investment decisions. The author/creator is not registered with SEBI and shall not be held responsible for any losses incurred based on this information. Always do your own research and use proper risk management.
👉 If you found this analysis helpful, don’t forget to Follow, so you never miss out on a trade-worthy setup, breakout opportunity, or valuable educational insight again. Stay updated and trade smarter! 💡📈
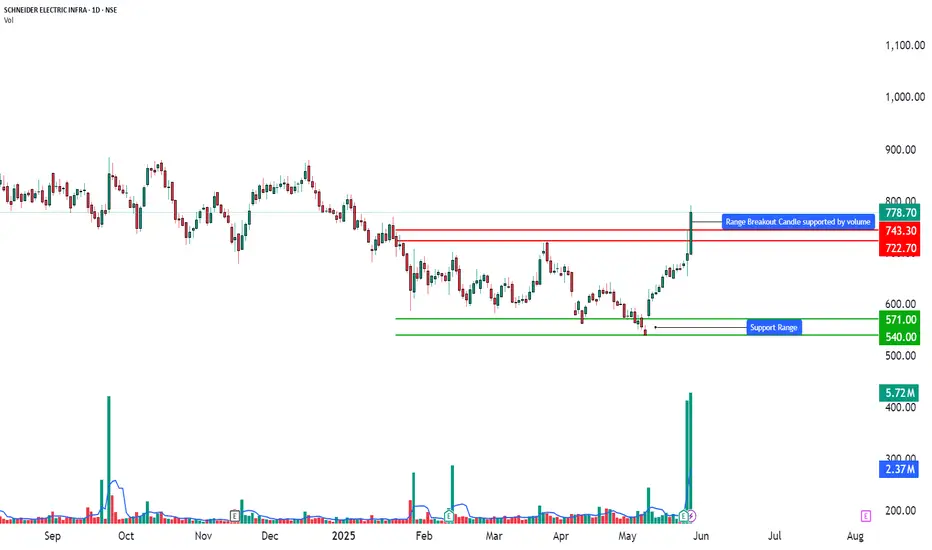
Technical Analysis - 52-Week Volume Breakout📈 SCHNEIDER ELECTRIC INFRA – TECHNICAL ANALYSIS
📆 Date: May 28, 2025
🔍 Timeframe: Daily
________________________________________
Price Action:
Schneider Electric Infra soared over 11.5% today with a strong bullish candle breaking above recent consolidation levels. This wide-range breakout candle marks a 20-day and 52-week volume breakout, indicating heavy accumulation and institutional participation. The price surged from support near ₹570 to close around ₹778.70, confirming bullish momentum.
________________________________________
Chart Pattern / Candlestick Pattern:
• Breakout Setup
• 52-Week High Breakout
• Bullish Candle with strong body and large volume
• BB Squeeze Breakout (Volatility Expansion Expected)
• Bollinger Band Expansion
• Volume Spike – highest in over a year
• Daily Chart: Bullish Initiation pattern on Heikin Ashi
• Weekly Chart: Bullish Continuation pattern formed
• Monthly Chart: Spinning Top, but with bullish undertones confirmed by volume
• Recent Candles: Long White Candle patterns on daily and monthly charts (May 28, 2025)
________________________________________
Technical Indicators:
• RSI (Daily): 79 – Strong bullish territory
• MACD: Bullish crossover active
• Stochastic: 95 – Overbought but shows strong momentum
• CCI: 188 – Momentum phase, institutional buying signs
• Volume: 5.72M – Extremely high, 20-day volume breakout
________________________________________
Support & Resistance Levels:
• Immediate Resistance: ₹814.75
• Next Resistance: ₹850.80
• Major Resistance: ₹910.20
• Immediate Support: ₹719.30
• Secondary Support: ₹659.90
• Major Support: ₹623.85
• Weak Support Zone: ₹570–₹550
________________________________________
Chart Overview:
The chart highlights:
🔸 Strong bullish candle piercing prior resistance
🔸 Volume breakout aligned with price breakout
🔸 Clear resistance cluster above ₹814–₹910
🔸 Support zone well established below ₹720
🔸 Multiple confirmations from indicators and volume surge
🔸 Entry was marked at ₹791.40 with SL at ₹651.85
________________________________________
Educational Breakdown:
This is a textbook breakout with volume confirmation setup:
• Price Action: Breakout from resistance zone
• Momentum Indicators: Strongly aligned
• Volume: Institutional spike with confirmation of trend continuation
• Band Expansion: Signals beginning of high volatility trend
• Entry Confirmation: RSI + BB + Volume breakout + Trend indicators
This setup indicates a fresh trend beginning post-accumulation phase, making it suitable for swing to positional trades. The aggressive rise also suggests short-term profit-taking zones near the immediate resistance, while medium-term targets remain valid.
________________________________________
How to Trade Schneider Electric Infra (for learning purpose):
• Entry Example: ₹791.40
• Stop Loss: ₹651.85 (Risk: ₹139.55)
• Target 1: ₹930.95 (Reward: ₹139.55)
• Target 2: ₹1070.45 (Reward: ₹279.05)
• Sample Quantity: 50 shares
• RR Ratio: 1:1 to 1:2
• Aggressive Traders: Can ride trend with trailing stop
• Conservative Traders: Wait for pullback near ₹720–₹700 before entry
⚠️ Risk Management Tip: Always trade with a clearly defined stop loss. Avoid entering positions impulsively. It is advisable to start with a smaller quantity and increase your exposure only if the price action confirms the continuation of the trend. Capital protection should always be the priority.
📢 Disclaimer
This content is created purely for educational and informational purposes. It is not intended as investment advice, stock recommendations, or trading tips. Trading and investing in the stock market involves risk. Please consult with a SEBI-registered financial advisor before making any investment decisions. The author/creator is not registered with SEBI and shall not be held responsible for any losses incurred based on this information. Always do your own research and use proper risk management.
👉 If you found this analysis helpful, don’t forget to Follow, so you never miss out on a trade-worthy setup, breakout opportunity, or valuable educational insight again. Stay updated and trade smarter! 💡📈
Daily Technical Analysis & Trade Setup📊 Pfizer Ltd – Technical Chart Analysis
Date Analyzed: 27-May-2025
Time Frame: Daily
Price Action Overview:
Pfizer Ltd has recently witnessed a sharp bullish move, backed by a strong breakout candle on the daily chart. This up-move is accompanied by a significant volume spike, suggesting increased market participation and conviction in the direction of the breakout. The price has convincingly broken past a key resistance zone, turning it into a potential support zone going forward.
Chart Pattern / Candlestick Analysis:
Breakout Candle: A large green candle with strong body formation.
Volume Breakout: The stock saw a 20-Day Volume Breakout, confirming the strength of the move.
Momentum Continuation Phase: The price structure indicates a transition from accumulation to markup phase, possibly following a Volatility Contraction Pattern (VCP) that resolved on the upside.
Technical Indicators:
Stochastic (D/W/M): Strong bullish readings across daily and weekly timeframes.
CCI (D/W): Shows strength on daily and weekly charts.
MACD (D/W): Bullish crossover on daily and weekly charts.
RSI (D/W): Daily RSI is above 90, showing momentum strength.
Support & Resistance Levels:
Support Zones:
Support 1: 5240.87
Support 2: 5064.13
Support 3: 4965.57
Strong Support: 3800–4000 zone (historical demand zone)
Resistance Zones:
Resistance 1: 5516.17
Resistance 2: 5614.73
Resistance 3: 5791.47
Weak Resistance: 6177.85 and 6547.75 (based on higher timeframe pivots)
Educational Analysis:
This chart is a textbook case of a Breakout with Confirmation. Pfizer Ltd traded within a descending channel from August 2024 to April 2025, consistently forming lower highs and lower lows within two parallel downward-sloping trendlines. This phase indicated sustained bearish sentiment and acted as a long-term consolidation zone. However, in late May 2025, the stock broke out decisively above the upper resistance line of the channel, supported by a surge in volume—an essential sign of institutional participation. Such breakouts gain further credibility when accompanied by bullish signals from momentum indicators like RSI and MACD, which often turn upwards before or during the breakout. For traders tracking breakout setups, this alignment of price structure, volume, and momentum provides a strong confirmation of trend reversal potential and buying interest.
How to Trade Pfizer Ltd (For Educational Purpose Only):
How to Trade Pfizer Ltd (for learning purpose):
Entry Example: 5438.00
Stop Loss: 5068.10 (Risk: 369.90)
Target Example: 5807.90 / 6177.85 (Reward: 369.90 / 739.85)
Sample Quantity: 50 shares
RR Ratio: ~1:1 / ~1:2
Aggressive Traders: May consider riding the trend with trailing stop
Conservative Traders: Can wait for a pullback into the fresh strong demand zone (4488-4405)
⚠️ Risk Management Tip: Always trade with a clearly defined stop loss. Avoid entering positions impulsively. It is advisable to start with a smaller quantity and increase your exposure only if the price action confirms the continuation of the trend. Capital protection should always be the priority.
📢 Disclaimer
This content is created purely for educational and informational purposes. It is not intended as investment advice, stock recommendations, or trading tips. Trading and investing in the stock market involves risk. Please consult with a SEBI-registered financial advisor before making any investment decisions. The author/creator is not registered with SEBI and shall not be held responsible for any losses incurred based on this information. Always do your own research and use proper risk management.
👉 If you found this analysis helpful, don’t forget to Follow, so you never miss out on a trade-worthy setup, breakout opportunity, or valuable educational insight again. Stay updated and trade smarter! 💡📈
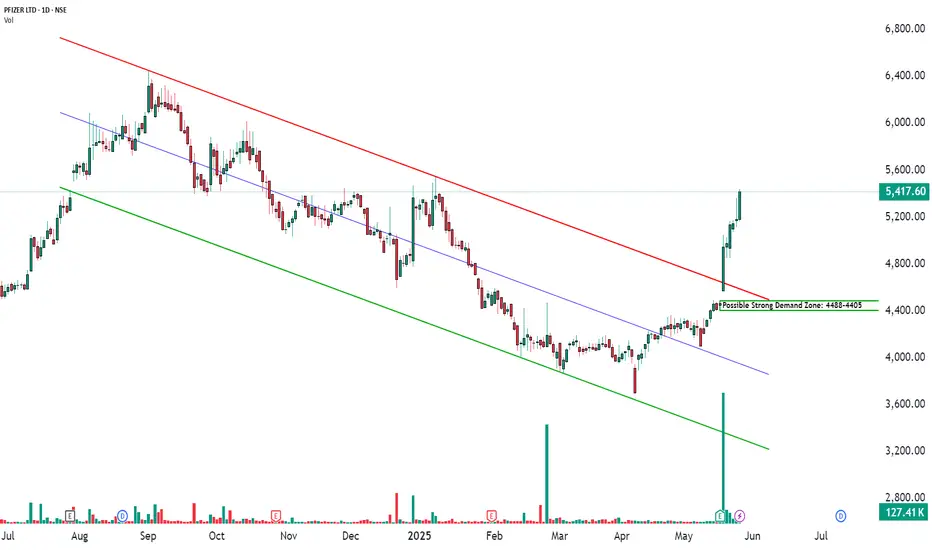
A Classic Case of Accumulation Turning into Momentum📈 SUPREME INDUSTRIES LTD – TECHNICAL ANALYSIS
📆 Date: May 27, 2025
🔍 Timeframe: Daily
Price Action:
Supreme Industries surged over 4% today and delivered a clean breakout after forming a consolidation triangle. The strong bullish candle closed near the day’s high with significant volume, confirming momentum on the upside.
Chart Pattern / Candlestick Pattern:
Symmetrical Triangle Breakout
Pullback Entry Zone Tested
Breakout Candle – wide range, strong body
Volume Surge – institutional interest visible
Technical Indicators:
RSI (Daily): 77 – strong bullish zone
MACD: Bullish crossover active
Stochastic: 98 – overbought but confirming strength
CCI: Above 200 – high momentum phase
Volume: 791.75K – supportive of breakout
Support & Resistance Levels:
Immediate Resistance: 4277.93
Next Resistance: 4355.47
Major Resistance: 4490.43
Immediate Support: 4065.43
Secondary Support: 3930.47
Major Support: 3852.93
Possible Fresh Demand Zone: 3837.60 – 3750.90
Chart Overview:
This visual clearly shows:
🔸 The symmetrical triangle pattern
🔸 Breakout + retest zone
🔸 Marked fresh demand zone for potential pullback opportunity
Educational Breakdown:
This setup combines:
Price Action: Triangle + Breakout
Volume Confirmation: Institutional participation
Momentum Indicators: Strong alignment
Demand Zone Mapping: Pre-breakout base
This is a classic trend continuation setup with clearly defined zones of interest. Risk control is key as price enters overbought territory.
Over the past few months, Supreme Industries displayed classic signs of an accumulation zone — a period marked by sideways movement, controlled volatility, and relatively stable volumes. This range-bound behavior typically indicates that long-term investors are quietly building positions while retail participation remains low. Recently, a strong bullish move supported by a significant rise in volume suggests the stock may have exited accumulation and entered the mark-up phase. This phase is often characterized by increased demand, higher price swings, and a clear shift in sentiment from neutral to bullish. The sharp breakout from the range, along with volume confirmation, signals the possible beginning of a new directional trend — where price tends to move swiftly as broader market participants join in.
How to Trade Supreme Industries (for learning purpose):
Entry Example: 4220.50
Stop Loss: 3781.50 (Risk: 439.00)
Target Example: 4659.50 (Reward: 439)
Sample Quantity: 50 shares
RR Ratio: ~1:1/1:2 etc.
Aggressive Traders: May consider riding the trend with trailing stop
Conservative Traders: Can wait for a pullback into the fresh demand zone (3837.60–3750.90)
⚠️ Risk Management Tip: Always trade with a clearly defined stop loss. Avoid entering positions impulsively. It is advisable to start with a smaller quantity and increase your exposure only if the price action confirms the continuation of the trend. Capital protection should always be the priority.
📢 Disclaimer
This content is created purely for educational and informational purposes. It is not intended as investment advice, stock recommendations, or trading tips. Trading and investing in the stock market involves risk. Please consult with a SEBI-registered financial advisor before making any investment decisions. The author/creator is not registered with SEBI and shall not be held responsible for any losses incurred based on this information. Always do your own research and use proper risk management.
👉 If you found this analysis helpful, don’t forget to Follow, so you never miss out on a trade-worthy setup, breakout opportunity, or valuable educational insight again. Stay updated and trade smarter! 💡📈

Price Action, Demand Zones, and Low-Risk Entry Areas📊 Tata Chemicals – Technical Chart Study
🗓️ Date: May 22, 2025 | NSE: TATACHEM | Chart Type: Daily
**Price Action:**
Since mid-April 2025, the stock has exhibited an uptrend characterized by higher lows and higher highs, which is generally considered a positive sign of market strength. The current price stands at 900.40, supported by a strong green candle that closed near its daily high. This recent price movement suggests buying interest in the stock, indicating potential for further upward movement. However, investors are advised to conduct their own analysis and consider market conditions before making any decisions.
**Chart Pattern Analysis:**
TATACHEM is showing a Volatility Contraction Pattern (VCP), with several contraction phases visible since March. The price has been trading within a tightening range of approximately 860 to 900, forming a recognizable pattern handle. During this period, volume declined gradually, which is typical in a VCP setup and may indicate absorption by stronger hands. The last few sessions before the breakout showed tight-range candles with lower volumes and mildly positive delta, often seen as a sign of accumulation. The breakout on May 27 came with approximately double the average volume, suggesting increased participation. While this pattern can indicate a higher probability of continuation, traders should evaluate risk carefully and not rely solely on any single pattern.
**Footprint Analysis:**
Footprint data for TATACHEM leading up to the breakout shows signs of increased buyer activity. The session on May 27 recorded total volume near 1.75 million and a positive delta of +174,050, suggesting buyers were more aggressive than sellers. Previous sessions showed fluctuating delta values, indicating a gradual shift from selling pressure to buying control. This trend may reflect a period of accumulation, with sellers becoming less dominant. Despite these observations, it is important to note that past volume and delta patterns do not guarantee future price movements.
**Demand Zones:**
Potential demand zones have been identified at key price levels: between 886.70 and 871.05, 863.90 and 851.50, and 842.85 and 834.55. These areas could act as support where buying interest may emerge if the stock experiences a pullback. Monitoring these zones can help investors plan entries, but it is essential to consider overall market dynamics and perform due diligence before trading.
**Low-Risk Entry Zone:**
TATACHEM recently entered a zone between 895 and 900 that may offer a lower-risk entry opportunity, with a brief intraday breach observed. For additional confirmation, a sustained close above 900 to 905 accompanied by above-average volume could suggest continuation strength. A potential stop loss could be placed below the handle low near 860, implying a risk of roughly 4.5%. This setup may offer a favorable risk-reward balance, but traders should assess their risk tolerance and market conditions before making decisions.
⚠️ Risk Management Tip: Always trade with a clearly defined stop loss. Avoid entering positions impulsively. It is advisable to start with a smaller quantity and increase your exposure only if the price action confirms the continuation of the trend. Capital protection should always be the priority.
📢 Disclaimer
This content is created purely for educational and informational purposes. It is not intended as investment advice, stock recommendations, or trading tips. Trading and investing in the stock market involves risk. Please consult with a SEBI-registered financial advisor before making any investment decisions. The author/creator is not registered with SEBI and shall not be held responsible for any losses incurred based on this information. Always do your own research and use proper risk management.
👉 If you found this analysis helpful, don’t forget to Follow, so you never miss out on a trade-worthy setup, breakout opportunity, or valuable educational insight again. Stay updated and trade smarter! 💡📈
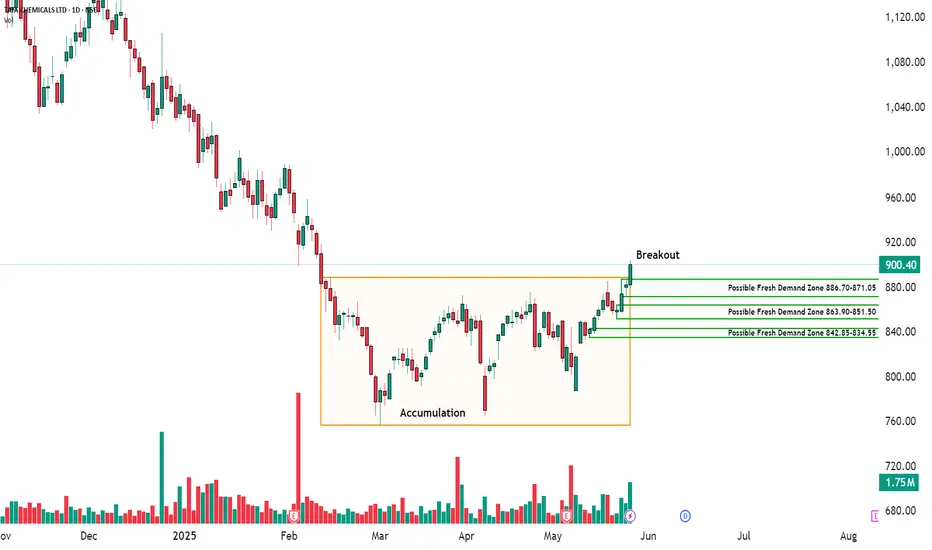
Bullish Signal with EMA Crossover and TTM SqueezeESCORTS (2.64%)
Bullish Signal with EMA and TTM Squeeze Breakout
ESCORTS shows a promising bullish setup, with a Strong Bullish Candle and an EMA 200 Crossover signaling a potential long-term trend reversal. The RSI Breakout and Bollinger Band Breakout further confirm the bullish outlook. A TTM Squeeze breakout also indicates increasing volatility, which could propel the stock further upwards.
Resistance Levels: 3482-3517-3572
Support Levels: 3392-3338-3302
Entry: @/above 3463.20
Stop Loss: @/below 3244.80
Volume Analysis: Volume has been increasing steadily, with higher than the average volume of 115.43K on 23rd April. This shows increased investor activity and potential momentum building.
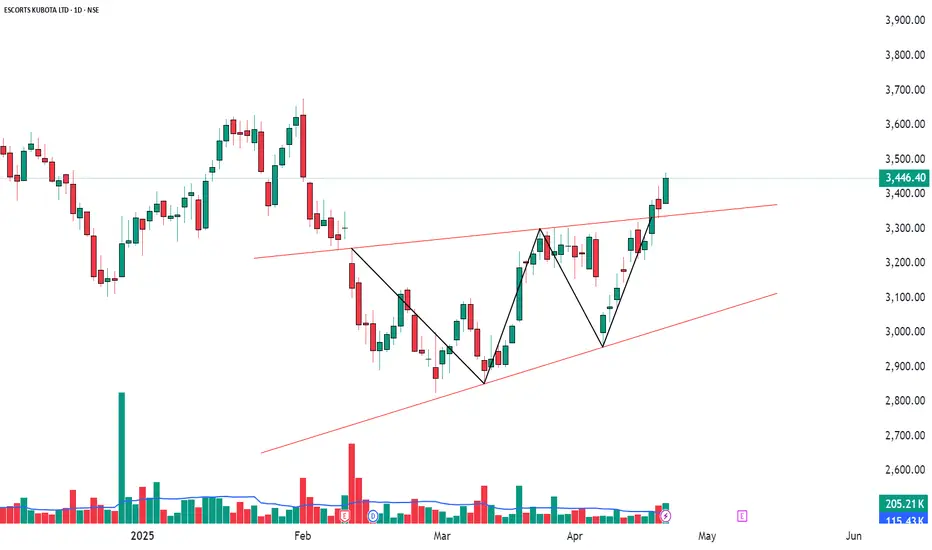
Strong Bullish Momentum and Volume SurgeAUBANK (8.41%)
Bullish Momentum Building
AUBANK is showing promising bullish signs across several technical indicators. A Bullish Marubozu candlestick has formed, complemented by an RSI Breakout, signaling a shift toward bullish momentum. The stock has broken out of the Bollinger Bands, with VWAP and Volume confirming the strength of this move.
Resistance Levels: 684-702-733
Support Levels: 634-602-584
Entry: @/above 669.90
Stop Loss: @/below 590.75
Volume Analysis: A significant volume breakout was observed on April 23rd, surpassing the average volume of 4.65M, suggesting strong market interest and buying power.
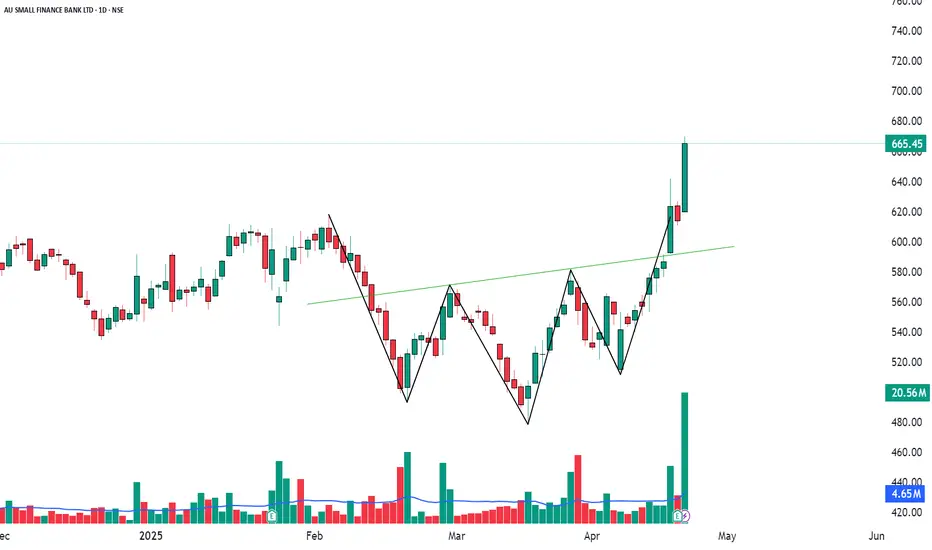
Bullish Momentum with RSI and Bollinger BreakoutMOTILALOFS (6.16%)
Bullish Trend and Breakout
MOTILALOFS is showing strong bullish momentum, with a Bullish Marubozu candlestick signaling the continuation of upward momentum. The RSI Breakout and Bollinger Band Breakout both point to an increase in buying pressure. The volume has seen a notable uptick, confirming the strength of the bullish move.
Resistance Levels: 787-805-834
Support Levels: 740-711-693
Entry: @/above 775.95
Stop Loss: @/below 653.65
Volume Analysis: Volume has been significantly higher than average, with a noticeable volume of 8.29M on 23rd April. This suggests that institutional or large players might be entering the stock.