ERIS - Bullish Momentum Revival💹 Eris Lifesciences Ltd (NSE: ERIS)
Sector: Pharmaceuticals | CMP: 1701.30 | View: Bullish Momentum Revival
Chart Pattern: Falling Wedge Pattern
Candlestick Pattern: Strong Bullish Momentum Candle
Swing High: 1910
Swing Low: 1506
Price Action
Eris Lifesciences has delivered a decisive shift in structure with a wide-range bullish candle emerging directly from the 1506–1530 demand zone. The move invalidates the recent weakness and successfully wipes out the liquidity sweep below prior lows. The strong candle, accompanied by a 52-week volume breakout, signals aggressive participation by stronger hands. Price has reclaimed the mid-Fibonacci levels and is now approaching the early breakout zone of the falling wedge structure, indicating a transition from compression toward directional expansion.
STWP Trade Analysis:
Bullish Breakout Level: 1740
Stop Loss: 1523
Momentum: Strong
Volume: Extremely High – Institutional Participation
Eris Lifesciences has delivered a powerful reversal from the 1506–1530 demand zone, triggering a breakout attempt supported by exceptional volume. The strong bullish candle reflects aggressive buying, reclaiming key mid-Fibonacci levels and rejecting the earlier liquidity sweep, which now appears to be a fake breakdown. Indicators across the board confirm strength — RSI breakout, MACD crossover, Bollinger Band expansion, and BB Squeeze-Off — all signalling the transition from compression to expansion. Buyers have clearly taken control and are defending higher lows with conviction.
VCP Analysis
The stock has displayed volatility contraction through a prolonged falling wedge, compressing steadily over multiple months. Each contraction phase has shown reduced amplitude, culminating in a sharp volume expansion today. This behaviour aligns with the early ignition stage of a VCP breakout. The surge in volume confirms that this is likely not a random upswing but a structural shift backed by institutional intent. Sustaining above 1708 keeps the VCP bias firmly intact.
STWP Support & Resistance
Supports:
• 1579 – Active demand zone, recently defended with strength
• 1457 – Medium-term structural support
• 1377 – Strong historical accumulation zone
Resistances:
• 1781 – First supply zone; momentum checkpoint
• 1861 – Upper mid-range rejection band
• 1983 – Major structural resistance; breakout gateway
These levels define the range in which the stock will oscillate before confirming its next directional leg.
STWP Stock Analysis:
Final Outlook:
Momentum: Strong | Trend: Neutral(Bullish Bias Developing) |
Risk: Moderate | Volume: Extremely High
Eris Lifesciences has staged a clean reversal after weeks of downward drift, with today’s candle marking a decisive shift in structure. The 52-week volume breakout confirms strong institutional activity, while the open=low candle and wide-range body highlight solid buyer dominance. Multiple technical triggers have aligned — RSI breakout, MACD bullish crossover, Bollinger Band breakout, BB Squeeze-Off, and a liquidity sweep below prior lows — collectively signalling the beginning of a fresh directional phase. The Fibonacci structure reinforces this momentum: price has reclaimed the 0.382 and 0.50 retracements, with room toward the 0.618 and 0.786 levels at 1755 and 1823. Sustaining above 1708 strengthens the upward outlook, opening the path toward higher resistances at 1781 → 1861 → 1983. The falling wedge breakout attempt, supported by the massive volume spike, indicates that the stock is transitioning from a prolonged compression into an early expansion cycle. As long as price holds above the layered demand zones at 1579 → 1457 → 1377, the bullish structure remains firmly intact. Traders should observe how the stock behaves on shallow dips toward 1660–1579. Healthy retests or tight pullbacks within this band often act as high-probability continuation setups in strong momentum environments.
⚠️ STWP Legal Disclaimer
This document is strictly for educational and informational purposes. All examples, charts, levels, and option structures discussed are illustrative and are not intended as buy, sell, or hold recommendations. STWP does not provide investment advice, trading tips, signals, or personalized financial guidance of any kind, nor is it a SEBI-registered intermediary or research analyst. The analyses, illustrations, and risk–reward structures included here are generic in nature and based on publicly available data and observed market behaviour, which may change without notice. Financial markets involve significant risk; derivatives in particular carry the potential for substantial losses. Option premiums, implied volatility, open interest, delta, and other market variables can fluctuate rapidly and unpredictably.
Readers are solely responsible for their trading decisions, capital management, and risk assessment. Before making any investment or trading decision, please consult a SEBI-registered investment advisor. STWP, its representatives, and affiliates shall not be liable for any direct or indirect loss arising from the use of this material. Historical patterns or past market behaviour do not guarantee future outcomes, nor should any part of this document be interpreted as a promise of performance, accuracy, or returns.
Position Status: No active position in this instrument at the time of analysis.
Data Source: TradingView & NSE India.
💬 Found this useful?
🔼 Boost this post to support structured learning
✍️ Share your thoughts or questions in the comments
🔁 Forward this to traders who value clean technical studies
👉 Follow for disciplined, structured, STWP-style analysis
🚀 Stay Calm. Stay Clean. Trade With Patience.
Trade Smart | Learn Zones | Be Self-Reliant 📊
Bollingerbandsbreakout

ASIAN PAINTS LTD – Technical Analysis________________________________________
🧠 ASIAN PAINTS LTD – Technical Analysis
Ticker: NSE:ASIANPAINT | Sector: Decorative & Industrial Coatings
CMP: 2,491 ▲ (+1.9%)
Chart Pattern: Symmetrical Triangle Breakout
Technical View: ⭐⭐⭐⭐ (Neutral-to-Positive Setup – Educational Purposes Only)
________________________________________
📈 Technical Overview (For Educational & Informational Purposes Only)
🔹 Pattern Observed:
Price action indicates a breakout from a symmetrical triangle pattern on the daily timeframe – a structure often linked to volatility contraction and potential directional movement. The stock breached the upper trendline near 2,467 with an uptick in volume, indicating possible buyer interest.
🔹 Supporting Indicators:
— MACD: Bullish crossover
— 200 EMA: Price reclaimed above the long-term average
— RSI: Reading near 66, indicating strengthening momentum
— Bollinger Bands: Price broke above upper band + BB squeeze
— SuperTrend: Bullish
— Open = Low: Potential buyer strength
🔹 Volume Context:
Volume during the breakout session was ~2.02M – higher than average, suggesting institutional participation or increased trader interest.
________________________________________
🔼 Resistance Levels (Reference Zones)
R1: 2,518
R2: 2,545
R3: 2,583
🔽 Support Levels (Reference Zones)
S1: 2,452
S2: 2,413
S3: 2,387
________________________________________
📰 News Summary & Sentiment Context (Neutral View)
📌 Earnings:
Q1 FY26 PAT declined ~6% YoY to 1,100 Cr. Revenue slightly lower YoY but largely in-line with expectations. Decorative segment volume grew ~4%, which helped cushion margin pressures.
📌 Demand Trends:
Urban & project-led demand showing signs of recovery. Rural demand is stable. Some macroeconomic caution warranted due to external factors (e.g., job market uncertainties).
📌 Regulatory Update:
The CCI has initiated a probe on alleged market dominance following a complaint. The company has contested the investigation citing procedural inconsistencies.
📌 Market Mood:
Despite regulatory concerns, post-earnings sentiment appears improved. The stock has risen ~5.2% YTD and has been among recent Nifty outperformers.
________________________________________
📚 Educational Insight for Traders & Learners
The symmetrical triangle is a common consolidation pattern formed by converging trendlines. It reflects a balance of power between buyers and sellers. A breakout (especially with volume) can signify renewed directional bias.
In this case, the stock broke out above the resistance trendline, backed by volume and confirmation from technical tools (RSI > 60, MACD, BB squeeze, etc.).
Such breakouts are monitored by traders for swing or positional opportunities, provided risk is managed and external catalysts (like earnings and macro sentiment) are factored in.
✅ Key Reminder: Technical setups should be combined with proper position sizing, exit plans, and broader market context.
________________________________________
🔍 Trade Setup (For Educational Simulation Only)
Trade Details
🔹 Long Entry: ₹2,505.60
🔹 Stop Loss (SL): ₹2,406.55
🔹 Risk-Reward Ratio: 1:1 | 1:2+
Pullback Trade Setup (Optional Re-Entry)
📍 Pullback Entry Zone: ₹2,491.20 – ₹2,505.60
📍 Protective Stop Zone: ₹2,465.87 – ₹2,453.60
📍 Risk-Reward Range: 1:1 | 1:2+
________________________________________
⚠️ Disclaimer (Please Read Carefully):
This content is shared strictly for educational and research purposes only.
I am not a SEBI-registered investment advisor, and no buy or sell recommendations are being made.
All views expressed are based on personal market analysis and experience. They are not intended as financial advice.
Trading — especially in derivatives like options — involves significant financial risk. Losses can exceed your initial investment.
👉 Always do your own research and consult a certified SEBI-registered advisor before making any investment or trading decisions.
👉 Use proper risk management and only trade with capital you can afford to lose.
The author assumes no responsibility or liability for any trading losses incurred from acting on this content.
By engaging with this material, you agree to these terms.
________________________________________
💬 Found this helpful?
Drop your thoughts, questions, or insights in the comments below ⬇️ — let’s learn together!
🔁 Share this post with your trading friends and community — help them discover clean charts, structured setups, and zone-based learning.
✅ Follow simpletradewithpatience for clear setups, educational content, and a no-nonsense approach to price action, supply-demand zones, and risk-managed trades.
🚀 Trade with patience. Trust your charts. Stay clear-headed.
Because the goal is not just to trade — it's to trade better.
Be Self-Reliant | Trade with Patience | Learn with Charts & Zones 📊

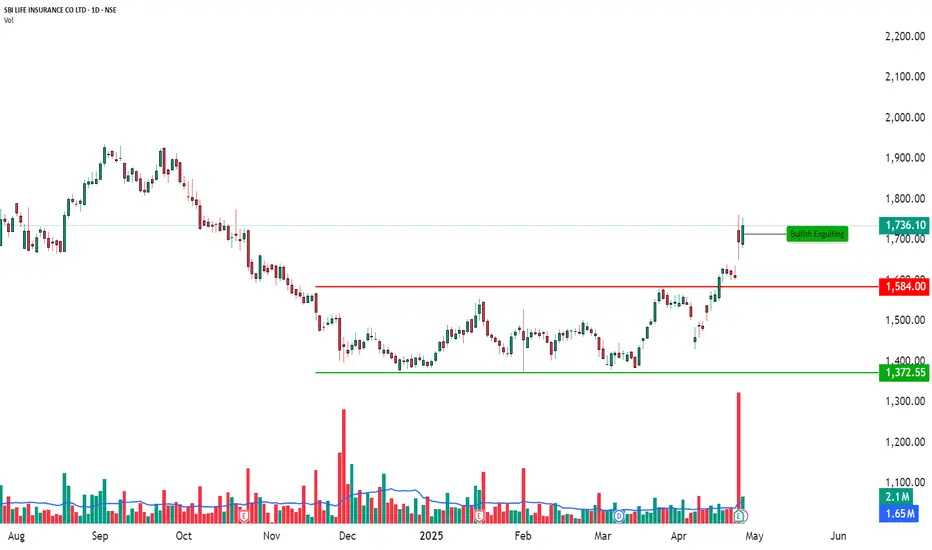
Breakout with Bullish Engulfing Confirmation | Daily Chart🏦 SBI LIFE INSURANCE CO LTD – Breakout with Bullish Engulfing Confirmation | Daily Chart
📅 Date: April 28, 2025
📈 Timeframe: Daily Chart
🔍 Stock: SBI Life Insurance Co Ltd (NSE)
📌 Technical Overview:
SBI Life is showing strong bullish momentum on the daily chart after breaking out above a key horizontal resistance around ₹1,584.
The price has formed a Bullish Engulfing candlestick pattern, indicating renewed buyer strength, backed by heavy volume.
🧩 Chart Pattern:
Strong horizontal resistance at ₹1,584 (now acting as support).
Bullish Engulfing candle printed around ₹1,736.10, showing strong rejection of lower levels.
Price structure continues to maintain higher highs and higher lows – a positive sign for bulls.
🔍 Key Price Levels:
Support Zones: ₹1,584(marked in red)
Major Support: ₹1,372.55(green horizontal line)
Current Market Price (CMP): ₹1,736.10
A sustained move above ₹1,736 with rising volume could potentially take the stock towards higher psychological levels around ₹1,800+.
📊 Volume Analysis:
Strong volume breakout observed during the recent rally.
Volume spike supports the validity of the bullish breakout, indicating increased buying interest.
🧠 Observational Bias:
As long as SBI Life holds above ₹1,584, the short-term to medium-term bias remains positively bullish. Any healthy pullbacks near ₹1,580–₹1,600 zones could offer better risk-reward setups for positional traders.
TTML, TATA TELESEVICES It gives breakout on two three parameters although now everything is dependent on coming market behaviors but it is looking very much fine on charts
