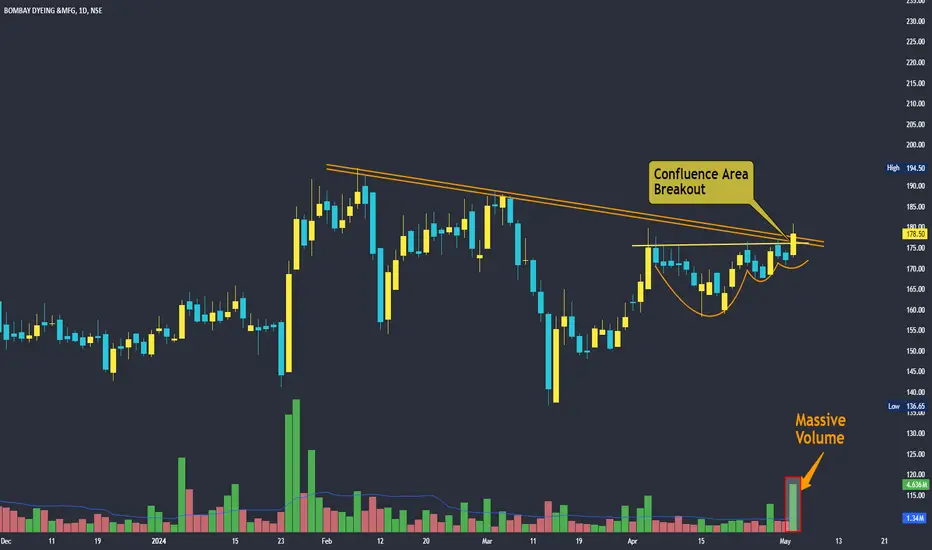
BOMDYEING - Strong VCP breakout + Multiple Trendline Breakout~ #BOMDYEING - Gave a good breakout of multiple patterns
~ Breakout of a 3T VCP Pattern
~ Trendline Breakout
~ Stock Looks good for both Swing and Positional Trades
BOMDYEING
BOMDYEING - Weekly Chart Analysis, CMP-181.95The stock coming out of a downtrend, it rallied without any consolidation since then. It went in a base formation of 18Weeks and range of 28% it has broke on decent volumes.
Stock sailing above its key moving averages.
155-164 zone shall now act as good support and a weekly close with follow through will invalidate our view.
197 - 205 - 213 - 270 - 321 are the levels that shall be tested over the long term.
Disclaimer: This is just a study and shared here for educational purpose. It is not a buy/sell recommendation in any way. If you intend to trade this counter then do your own due diligence and trade at your own risk.

BOMDYEINGBOMDYEING:- Breakout is going to give after 4 years, wait for breakout and plan something only after that.
Hello traders,
As always, simple and neat charts so everyone can understand and not make it too complicated.
rest details mentioned in the chart.
will be posting more such ideas like this. Until that, like share and follow :)
check my other ideas to get to know about all the successful trades based on price action.
Thanks,
Ajay.
keep learning and keep earning.

BOMDYEING LOOKING GOODNot Sebi Reg
Its My Personal View Before Trade Take Advise From Ur Advisor
Any Profit Loss Me Not Resposible

YR 2022 Idea #92: Long on BOMDYEINGThis is a public swing trade idea and is only for Learning and observational purpose. Please understand your risk and take full responsibility of your actions. I might trail my stoploss after I get an entry but even if my original Stoploss hits, i exit the trade with pre-planned loss (risk). At target, I book usually 75% positions and trail stoploss for rest. Our objective to help anyone who wants to learn technical analysis using charts by demonstrating my real trade entries. You can post your queries in comment section here and we will try to answer them asap.

YR 2022 Idea #9: Long on BOMDYEINGThis is a public swing trade idea and is only for Learning and observational purpose. Please understand your risk and take full responsibility of your actions. We would comment on any further updates on our entry, targets and stop-loss on this idea, so make sure to follow if you want to get further updates. Our objective to help anyone who wants to learn technical analysis using charts. You can post your queries in comment section here and we will try to answer asap.

BOMDYEINGGo For Long - if it Crosses above 97 , broke the symmetrical triangle on downside , now trying cross back after nifty correction

BOMDYEING - BOMBAY DYEING Triangle Breakout expectedDetails provided in Chart.
Consider hitting like and follow if you find it useful.

BOMBAY DYEING LONGBreakout on daily charts with brilliant volumes.
Seeing some selling pressure currently. Good to buy if sustains above 96.50 today.
Add on retracements (after bounce back form retracements, add more)
ENTRY: Above 96.50 (if sustains)
Targets: 105, 115, 122++ (obeying the path marked)
Stop loss: 91.30 (Considering buying around 96.50)
TRAIL STOP LOSS
FOLLOW IF YOU LIKE THE ANALYSIS
LIKE AND COMMENT WHAT YOU THINK ABOUT THIS
THANKS

