Linear Regression with RSI: A New approach to Trend AnalysisHello Friends,
Welcome to RK_Chaarts,
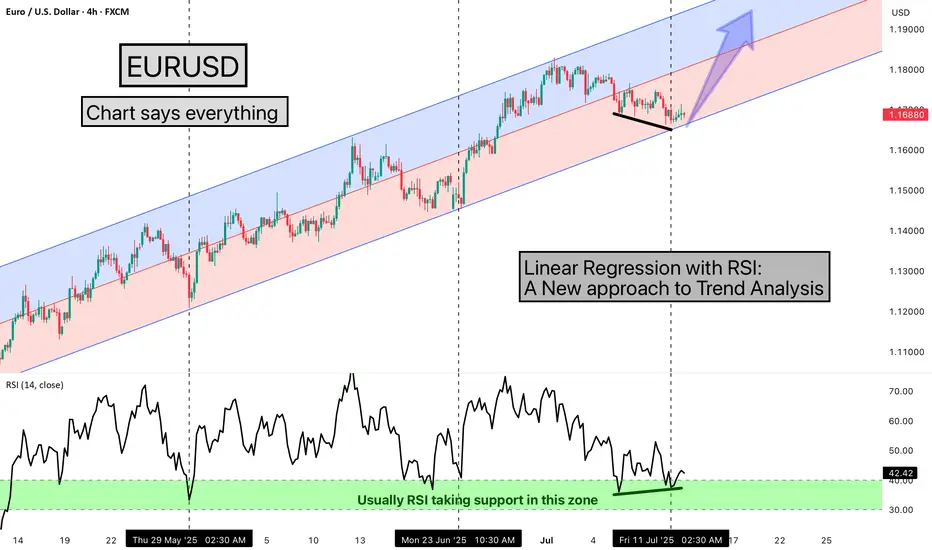
Today we are going to learn one Method of analysing the chart, here we are using EURUSD chart, and the method we're using is very simple & interesting, We are using the Linear Regression Trend Channel & Relative Strength Index (RSI), What happens in this method, is that we identify a particular zone where the price is making a one-sided move, like if the price is trending upwards, making higher highs and higher lows. We then apply a regression channel to it, and within that channel, we set internal deviation for the upper and lower sides, like 2 or 2.5 or 3 etc., whatever setting it takes.
In this chart, we can clearly see that the 2.5 setting is forming a complete channel, which we've applied for the last two months, from 12th May 2025, when the uptrend started. We've used the 4-hour time frame chart and the RSI. Every time the price hits the bottom of the channel, we can see that the RSI also enters the same zone, between 30-40, and from there, it bounces back.
Currently, the price has again hit the bottom of the regression channel, and the RSI has also gone below 40, between 30-40. And the good thing is that we're seeing a positive divergence in the RSI. So, there's a high possibility that the price might bounce back from here.
It's worth watching what happens next in the market. Nothing is guaranteed here; everything is a game of probabilities. This is one method that we often use, and its results have given us a very good experience. So, let's see what happens next in this chart. This observation is also a good learning experience, which we often encounter, 7-8 times out of 10, in favor of the market, but sometimes it doesn't work, maybe 2-3 times, when the trend changes. So, let's see what happens next.
This post is shared purely for educational purpose & it’s Not a trading advice.
I am not Sebi registered analyst.
My studies are for educational purpose only.
Please Consult your financial advisor before trading or investing.
I am not responsible for any kinds of your profits and your losses.
Most investors treat trading as a hobby because they have a full-time job doing something else.
However, If you treat trading like a business, it will pay you like a business.
If you treat like a hobby, hobbies don't pay, they cost you...!
Hope this post is helpful to community
Thanks
RK💕
Disclaimer and Risk Warning.
The analysis and discussion provided on in.tradingview.com is intended for educational purposes only and should not be relied upon for trading decisions. RK_Chaarts is not an investment adviser and the information provided here should not be taken as professional investment advice. Before buying or selling any investments, securities, or precious metals, it is recommended that you conduct your own due diligence. RK_Chaarts does not share in your profits and will not take responsibility for any losses you may incur. So Please Consult your financial advisor before trading or investing.
Bounceback
Eicher - Seeing A ReversalCMP 4703 on 17.02.25
All important levels are mentioned on the chart.
In the last 6 months, the stock price has taken support many times on the dotted line shown on the chart. This time again comes to the support.
The price is corrected around 10% after the earnings declaration.
Though it is a risky setup, the risk-reward ratio is quite good at present.
If gives a bounceback, upside targets may be 4910/5100 and 5300.
Keep your stop-loss strict according to risk management.
This is only for learning and sharing purposes, not a trading recommendation in any way.
All the best.

Bounce back from Support in EmamiNSE:EMAMILTD Bounceback is happening from the current level of support of 600.
Tgt for another 200 points with SL at swing low

AMBERAMBER has given approx 20% correction from the top. Retraced about 50% from recent rally. If it doesn't close below 5700 then it may take a good bounce and me resume its rally from this levels. Risk-reward is quite in favor. RSI reversal on daily time-frame also observed. Keep it on radar. AMBER is one of the stock which IMO seems fundamentally strong as well. Do your due diligence.

IREDA - Ready To Bounce From Support🔊 IREDA - Ready To Bounce From Support
IREDA - INDIAN RENEWABLE ENREGY
⌛Duration - Short Term (3 month to 5 month)
📊📈 Trade Logic - Bouncing from Long Term Support Area
CMP - ₹232.37
Time Frame - Weekly
🎯Target 1 : ₹260
🎯Target 2 : ₹280
🎯Target 3 : ₹300
🛑 Stop : ₹210/₹220
🏆 Risk/Reward Ratio (1: 2.5)
Disclaimer: The stock information shared here is not a recommendation to buy, sell, or hold. It reflects my own analysis and is intended solely for educational purposes. Any actions you take based on this information are your responsibility, and the admin of this channel is not liable for any financial gains or losses. Please consult a financial advisor before making any investment decisions. I am not a SEBI-registered advisor.

Just A View - BSE Double Top Neckline Support📊 Script: BSE
📊 Sector: Miscellaneous
📊 Industry: Miscellaneous
Key highlights: 💡⚡
📈 Script is taking support of level 2075 which is neckline of double top.
📈 We may see bounce back from here.
⏱️ C.M.P 📑💰- 2148
⚠️ Important: Always maintain your Risk & Reward Ratio.
✅Like and follow to never miss a new idea!✅
Disclaimer: I am not SEBI Registered Advisor. My posts are purely for training and educational purposes.
Eat🍜 Sleep😴 TradingView📈 Repeat 🔁
Happy learning with trading. Cheers!🥂

REVERSAL IN BEATEN DOWN LAURAS LABBuy Lauras Lab 320 to 335 range for 375/400/440. Expecting some proper bounce in beaten down names in pharma space. Keep stop below 310 on two days closing basis. Good volume base buying happening after bad results posted this quarter

Strong Support | Good Setup | Long BiasOn 1h TF
SNX has rejected $3.1 and strong bounce back to $3.5 now it's returning to test the bottom again
So I think this is the chance to join after confirmation SNX can't through this support
Wait for next move

Rain Industries at strong support One can keep Rain Industries in radar as it's in a very strong support zone.
Look at weekly 200 ma and ema and keep that as SL
Wait for it crossing 200 dma and dema and daily Supertrend to turn green!

BTC LongBTC Long for a bounce to the VWAP area. It's a movment to Stay inside the range. If we lose these range low we are gonna see more downside presure.

Teamlease Services | Weekly Chart | Techno-Fundamental Pick There are two possibilities here :
1. Either the stock will continue the trend but the volume doesn't suggest so.
2. The weak hands will start exiting at current levels as it's a good resistance level. Wait for some retracement to start building the position. Better to buy as close as near the key zone level.

Mindtree near the support zone Mindtree near the support zone
A hammer at the support zone, could bounce high from here. IT is showing weakness to be careful and trade with strict stop loss
Anything candle close below the support zone can be a trigger to get out!

MMP Industries bounces back1. Buy or Sell at your own risk
2. Don't risk more than 1%-2% of your capital as stop loss
3. Position Size formula:- Stop Loss/(Buy Price-Initial Stop Loss Price)
4. Sell on initial stop loss hit or close below daily supertrend (for short term traders) or close below weekly supertrend (for long term investors)
5. Some other ways to sell stocks can be
a. 25% or 50% up in three weeks or less
b. Largest weekly price spread
c. Exhaustion gaps
d. Heavy daily volume without further upside
e. Largest one day price drop
buy NSE:MMP with a stop just below Rs.190.

KPIT TECHNOLOGIES CONSOLIDATION BREAKOUT COMMING AFTER FALLkpit technologies after correction in entire it sector is ready for another up move. it is bouncing between its 200 and 100 day moving average , which means a big move is about to come . it is also forming a small symmetrical triangle formation whose breakout is about to happen. if you see then the candles at the bottom or during this base formation have been very small , which means after correction there is some halt in selling and probability is that the buyers may come into picture now. so this stock looks extremely bullish also because of broad based it sector rally , and by the way this stock is fundamentally very good because of electric vehicle sector.

Nifty Today: “What doesn't Kill you, Makes you Stronger” - 22 FeNifty View: Yet another volatile trading session for the benchmark Nifty index today, as the index gapped down and fell more than 300 points, to bounce back in the late afternoon and close the day with a loss of just 131 points. The market is reactive in nature now, and equity as an asset class globally is going through a similar correction. At today's lows, the index finds support yet again from the (16,800–16,900) zone, which has held the market thrice over the past few weeks. If today's bounce back happens to be a "dead cat bounce", then we are very likely to see a break below today's low by the end of this week. And if that happens, prepare yourself for further weakness.
Thank you for following my work and please feel free to share your thoughts and suggestions.
Trade Well. Trade Wise.

Nifty Today: “Lunatic” - 15 Feb’22 Nifty View: In today's trading session, it was a big 500+ points recovery from the Nifty benchmark index. This brings in a lot of volatility to the overall market conditions considering that the index had lost over 500 points in yesterday's trade. Nevertheless, even after today's bounce back, the underlying short-term and intermediate trend of the index is still down. And so, as we advance, the benchmark Nifty will have to deal with immediate resistances before it confirms a short-term trend reversal. Strategically these are challenging times to time the market, especially for short-term traders. And so I suggest that keeping a low profile and trading less with lesser quantity is a better proposition rather than going aggressive.
Thank you for following my work and please feel free to share your thoughts and suggestions.
Trade Well. Trade Wise.

NB Ventures buying opportunity1. Buy or Sell at your own risk
2. Don't risk more than 1%-2% of your capital as stop loss
3. Position Size formula:- Stop Loss/(Buy Price-Initial Stop Loss Price)
4. First sell on initial stop loss hit or close below supertrend
After posting a quarterly sales growth of 44%, a quarterly profit growth of 58% and OPM improvement from 41% to 43% NSE:NBVENTURES gave a high-volume breakout, retested the support zone and resumed its uptrend. It is a buy at current levels with a stop loss at or below Rs.129
Other Fundamentals: -
1. Stock is trading at 0.47 times its book value
2. Debtor days have improved from 197.31 to 130.94 days
3. Debt coming down since Mar'17
4. Promoter stake increased from 45.53% in Mar'21 to 49.51% in Dec'21
5. FII stake increased from 2.25% in Mar'21 to 6.25% in Dec'21
6. The Company’s Ferro Alloys facilities are supported by captive power from its own power plants giving them certain inherent advantages in terms of availability of power and control on costs
7. The company has entered into a Conversion Agreement with TATA Steel Mining Limited (TSML) for conversion of high carbon ferro chrome. The Agreement postulates that the entire smelting capacity of the Odisha plant is dedicated to TSML to produce up to 70,000 metric tons of high carbon ferro chrome per annum. The duration of the Conversion Agreement with TSML is from December 1, 2020 to March 31, 2025
8. Company plans to increase the capacity of its power plant to 600MW in the second phase, depending on the build-up of demand for power in the region

Nifty Today: “A Confident Close” - 09 Feb’22
Nifty View: The recent bounce back extends further, with the benchmark Nifty index gaining more than 200 points in today's trading session. The intraday charts are improving as the index now deals with the immediate resistance zone of 17,450-17,550. Support from the Banking and Auto sector continues. From now on, the most critical aspect for the rest of this week will be whether it will be able to break out above 17,550 and move back into a short-term uptrend or not. A failure to do so, will bring back selling pressure in the overall market next week. We should not forget that based on the daily timeframe, the underlying trend is still weak, and many sectoral indices are also in a downtrend. So one should not be aggressively bullish in this market condition.
Thank you for following my work and please feel free to share your thoughts and suggestions.
Trade Well. Trade Wise.

Nifty Today: “Bounce Back Indeed, But too early to call a BottomNifty View: Benchmark Nifty index managed a healthy bounce back in today's trading session. At a close of 17,273 the index managed a marginal positive gain of just 54 points but what was more encouraging was a healthy bounce back from the intraday low of 17,048. At this low, the index is teasing the psychological level of 17,000, a break below which can bring in new weakness. On the upside, the confluence of residences now stands close to the 17,450 mark. It will be important to observe in the next few trading sessions whether the index shows the strength to carry itself further and break above the immediate resistance zone.
Thank you for following my work and please feel free to share your thoughts and suggestions.
Trade Well. Trade Wise.

good uptrend possibiltyfundamentally good stock can expect it to go back to the 200 levels in the coming months

eicher motor short term for sellTrade based
Weekly DT broken
Day tf trend was reveresed
Hr tf bounce back broken

MGL short sellTrade based:
Overall it was sell trend.
during the sell trend. in inside the hr tf. form a bounce back and also it broken.
so, its a best time to enter for sell.

TRENT short term for sellTrade based
Near the previous day resistance, market change the trend in lower tf.
and also market acting or sustain in major hr support and also its looks like a bounce back. when the market break the support.
then we can expect some in that script.
