BPCL

What will happen to BPCL from here?Just look at the number of times that trend line has been tested. It has not managed to break it. Will it be done this time?
If it breaks it, the move could be HUGE!
Keep this on radar.
Please like and follow.


BPCL... We May See Breakout SoonIf stock sustains above the pink line, we may see the targets of 414, 426 and 436.
To motivate me, Please like the idea If you agree with the analysis.
Happy Trading!
InvestPro India Team


Triangle Pattern Breakout in BPCl
As you can see number of support and resistance it has taken and has honoured the triangle pattern beautifully, Also a Morning star is formed at current level with a volume greater than last five days. Expecting a huge breakout!
Triangle Pattern Breakout
Entry-405.65
Target -480
SL-367.25
Confirm Entry above 424 as it is a major resistance

BPCL with a CUP & HANDLE FORMATION?SWING TRADE OPPORTUNITY IN BPCL
As you can see in the image above that BPCL has broken out of a CUP & HANDLE formation and has come to level which is very favourable level to go long.
A Cup & Handle formation usually comes with its own Targets, which is, the price difference between the neckline of the cup to the lower circumference of the cup. As shown in the image above.
To be on the safe side of the trade, we have taken the Inner Circumference into consideration and not the Outer Circumference for the Price Range , so that we are able to gauge the targets better.
The First Target for this trade is around 450 price levels , the Second Target is around 465 price levels . We can maintain a strict trailing Stop Loss with it starting at 380 . if the trade is succesfull and reaches its 1st Target we get a favoyrable Risk:Reward ratio of 1:3 .
Happy Trading & Investing, let me know if you liked the analysis and please give your feedback to help me publish ideas better.

BPCL LONG SETUPBPCL
Can give good upside move towards upper SUPPLY ZONE in coming days.
View Negates below 355 level.
Must have this in watchlist for coming days.


BPCL - Parallel channel formation at monthly TFBPCL (Bharat Petrol Corp) - Parallel channel formation at monthly TF
Always trade what you see, never trade what you feel. Make this a habit, you won't be requiring any seminar, webinar, or mentor, you will be self-sufficient.
Disclaimer : All charts are purely for educational and information purpose only. Invest or Trade at your own risk.

BPCL : Break out trade potential...BPCL
CMP 380.50
- since June 2020, we observe, BPCL consolidating in channel and then giving a spike up or down
- channel zone is nearing breakout time zone
- momentum might be seen above 389
- multiple support between 355-368
- at CMP & on dips the stock provides good risk::reward ratio to go Long for targets of 408 / 440 / 473
- Stop loss if trades below 353
___________________________________________________________________________________________________________
Alternatively one may consider selling 28 January 2021 expiry
360 Put option between 9-12 (CMP 9.5)
Lot size 1800
Max profit potential Rs 16200/- - Rs 21600/- per lot
Inbuilt Loss protection in strategy for a fall in price up to 351-348 till January 28, 2021
Take care & safe trading...!!!
Hit the Like button / comment below if you find it useful
Follow for more such trading ideas...
Take care & safe trading...!!!
Disclaimer:
- The view expressed here is my personal view
- Past performance is not a guarantee for future predictions
- Use this for educational purpose
- Any decision you take, you need to take responsibility for the same
- It's your hard earned money. Treat it wisely
- Trade / Invest keeping in mind your trading style, goals and objectives, time horizon & risk tolerance
- if trading in F&O, understand that F&O trading involves risk
- Do take proper risk management measures
- Do your own analysis and consult your financial adviser if need be

#BPCL #HINDPETRO #IOC #OIL #ONGC #PETRONET #PETROL #BITCOIN #NSE#BPCL
Bharat Petroleum Corporation Limited.
CMP: 399
TARGET: 436 // 478
G-O-I undertaken stock is in limelight, BPCL. As the state run petroleum company plans for divestment, there is going to be a lot of opportunities for retail investors and traders. Govt. plans to sell off almost 53% stake from the company and it receives MULTIPLE bids. Stock is expected to have a strong valuation and would be expensive from the current rates.
There are various reasons to invest in this stock.
1. Trend Analysis: The stocks is in pace to reach highs. Running in uptrend, climbing ladders, step-by-step. Steadier and stronger with each end of the day prices.
2. Fibonacci Retracement: Retracing from 50% levels to make higher highs. Supports acting strong and giving a better push upside again and again.
3. Moving Averages: All the moving averages running alongside. All the bigger moving averages below the prices gives the candle more strength to be firm and erect. Bears fears. Prices fear to fall.
4. Pattern: Prices are making higher lows to show the pictorial representation of price trend. Making a Bullish Wedge kind of pattern with periodic time span.
5. Volume: Extremely large volume trading has been encountered in the stock. The huge Volume is representation of higher investors' money flowing in towards the stock. The huge Volume candles along with huge BULLISH Price Candles represent the strength of BULLS.
6. Momentum: The stock being in news, a large number of traders rush towards it and make various analysis to get the intrinsic value. The higher the bidding value, the higher is the price. The bids create excess of demand for the stock and thus price moves upside. The stock has just got the momentum. A rally is expected soon.
7. Strong Bull and Weak Bear: The Bullish candles are mightier and look like "katana". Big Bull candles show the presence of demand over and above supply, and thus a potential for upside. On the contrary, the bear candles are small and of less volume. Explaining the distribution and consolidation of previously purchased shares.
Go ahead with the stock, with a limited down side risk.
SL: 385
RR Ratio: 1:2 // 1:5
If you like my work, kindly LIKE the post, SHARE it with your friends and family, and FOLLOW the page to get free stock recommendations frequently.
Thankyou!


BPCL - INVERSE HEAD & SHOULDERS PATTERNAn INVERSE HEAD & SHOULDERS PATTERN is a clear cut indication of a breakout. A BIG BREAKOUT...........
Note:
Avoid the stock if a big gap up or gap down is seen
Enter after the breakout happens and not before it
Do not chase the market, i.e., do not get involved in late entries
Only enter with strict stop-loss and target
This is not a recommendation and is for educational purposes only.
always follow risk-reward and quantity management for the 100% of the times
The above mentioned idea may not work, so beware of the risk you are taking
Follow me to Learn and Earn with me.
Happy Trading!!


Contra Call: BPCLBPCL is available at fantastic levels and the divestment play out for the stock will see minimum levels of at atleast 450-460 if not higher.
Accumulate at these levels. Immediate target at 408-409.
Go long.
Like and follow.
NSE:BPCL

BPCL at important levelNSE:BPCL
BPCL is at demand zone, once it breaks out of resistance trend line it has a scope to reach higher levels 460/500 plus as predicted in chart.

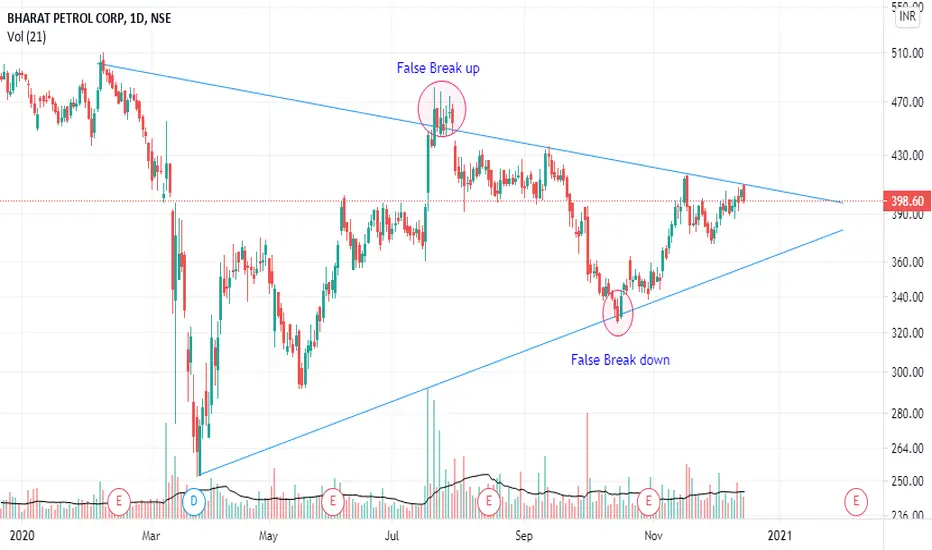
Long term Triangle Pattern in BPCLThe stock is making a long term triangle pattern in daily chart. 2 false breaks are present in this formation. Potential break up. Strong above 440
at closing basis