BPCL : Trading the Confluence of Price Action & Macro TailwindsThe stock has been consolidating within a defined range over the past few weeks and has recently started forming a solid base. While the breakout volume isn’t a classic “God-candle,” price action continues to hold firmly above key moving averages, which is a constructive sign. That said, the price is somewhat extended from the EMAs, increasing the probability of a mean-reversion move. Hence, the stop loss needs to be placed wider rather than just below the basing structure.
The conviction behind this trade comes largely from the current Goldilocks macro environment we’re witnessing in early 2026. With global crude prices remaining comfortably low, BPCL is benefiting from strong marketing margins across petrol and diesel, supporting near-term earnings visibility.
On the fundamental side, a major catalyst is the Government’s LPG compensation package. BPCL is expected to receive a significant share of the ₹30,000 crore payout allocated to OMCs, which materially improves cash flows in H2 FY26. This inflow also acts as a strong deleveraging trigger, further strengthening an already improving balance sheet that has seen a steady decline in debt-equity levels over recent quarters.
So took this position with 1% risk on the net capital.
📢📢📢
If my perspective changes or if I gather additional fundamental data that influences my views, I will provide updates accordingly.
Thank you for following along with this journey, and I remain committed to sharing insights and updates as my trading strategy evolves. As always, please feel free to reach out with any questions or comments.
Other posts related to this particular position and scrip, if any, will be attached underneath. Do check those out too.
Disclaimer : The analysis shared here is for informational purposes only and should not be considered as financial advice. Trading in all markets carries inherent risks, and past performance is not indicative of future results. It’s essential to conduct your own research and assess your risk tolerance before making any investment decisions. The views expressed in this analysis are solely mine. It’s important to note that I am not a SEBI registered analyst, so the analysis provided does not constitute formal investment advice under SEBI regulations.
Bpclanalysis

Resistance Breakout in BPCLBPCL has exhibited a notable resistance breakout on the daily chart, closing above ₹348 and marking a positive uptrend. This move is accompanied by a significant surge in the 350 November call option, up over 50%, confirming bullish sentiment. The breakout is supported by strong candle structure and aligns both spot and option price action, suggesting momentum continuation. Traders may consider BPCL for momentum-based strategies, monitoring for a move towards the next resistance. As always, disciplined risk management is advised when entering trades after key breakouts. This setup strengthens the bullish outlook for BPCL short-term.
B

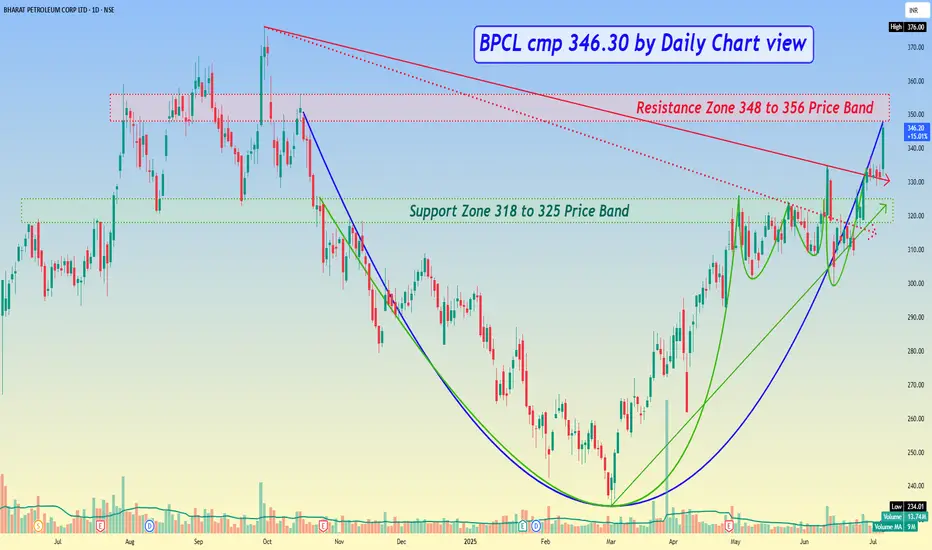
BPCL cmp 346.30 by Daily Chart viewBPCL cmp 346.30 by Daily Chart view
- Support Zone 318 to 325 Price Band
- Resistance Zone 348 to 356 Price Band
- Strong Bullish Technical Chart Setup indicative of good upside once price crossover and sustains closure above Resistance Zone
BPCLBPCL in bearish mode now
BAMM active according to harmonics study
D point is the good investment pick
Bullish Bat harmonics pattern forming is going on
#BPCL

Bharat Petroleum Corporation Ltd - Positional TradeDate : 10-May-2024
Rating : Buy - Positional Trade
LTP : Rs. 618.65
Targets: (1) Rs. 687 --> (2) Rs. 770
SL : Rs. 580 on daily close basis
Technical View:
• NSE:BPCL is in its primary uptrend and was recently going through it's secondary downtrend.
• After touching the high of 687.95 on 16-Feb-2024, it has retraced 19% to 556.40 level.
• On 29-Apr-2024, NSE:BPCL has broke out from its secondary down trend with high volume and re-tested the down trend line twice, on 30-Apr and 9-May.
• NSE:BPCL has also closed above 20 DMA, 50 DMA and 21 DEMA on 10-May-2024.
• RSI is trading at 53.91 and MACD is trading at 4.01.
• Looking good to start a new swing from here.
Disclaimer : I am not a SEBI registered analyst/consultant and not recommending anyone to take any BUY or SELL position in stock market. Investing in stock market is risky and one should do a self analysis and validation before investing in stock market. Ideas are published for learning purpose only.

Bharat petro ( BPCL ) for 620 ++Bharat Petrolium is one of the great stock for fuel sector is ready to roar again.
We do see channel breakout in BPCL and we are expecting a good move in this script.
Moving averages also showing favourable ratio.
CMP: 601
STOP LOSS : 582
TARGET : 627 +

BPCL Breakout target 900+Hi,
Eecepting NSE:BPCL to reach target of 900 Rs. in coming days/weeks. A very nice price action supported by good volume is seen in BPCL. It is also bullish on daily, weekly and Monthly MACD Charts. Expecting the momentum to continue...
NSE:BPCL is currently trading at very good buying levels.
This is for educational purpose only...

BPCL Analysis for Swing Trading 29.01.2024 - Feb 2024It is observed that BPCL is trading at crucial resistance level. Seems time to get corrected. And the results are also going to announce tomorrow.
Keep your SL at 490.
Possible to go down till 461, 449 and 409

Bullish Flag Pattern in BPCLIntroduction:
Bharat Petroleum Corp. Ltd. is a holding company, which engages in the business of refining of crude oil and marketing of petroleum products. It operates through the Downstream Petroleum and Exploration and Production (E&P) segment. The Downstream Petroleum segment includes the refining and marketing of petroleum products. The E&P segment focuses on hydrocarbons. The company was founded on November 3, 1952 and is headquartered in Mumbai, India.
Analysis
A Bullish Flag and Pole pattern is visible on the 4 Hour chart of NSE:BPCL
The Flag and Pole pattern is a bullish continuation pattern and it is visible in charts after a meaningful appreciation in the price.
MACD gave Positive crossover on Daily, Weekly and Monthly chart. So, expecting the momentum to continue.
One can create a fresh position in the scrip near Rs. 395-400 levels with the stoploss of Rs. 380 on Daily closing basis for the following targets 408.15, 415.25, 421.05, 429.15,
437.65, 442.50 and 448.60
Risk Disclaimer:
The trading ideas and analyses presented here are for educational purposes only and do not constitute financial advice. Trading and investing in financial markets involve risk. You should carefully consider your own financial situation, risk tolerance, and investment objectives before making any investment decisions.
The information provided in this analysis is based on my personal interpretation of market conditions and the available data at the time of writing. It is subject to change without notice, and I cannot guarantee the accuracy, completeness, or timeliness of the information provided.
Trading and investing carry the risk of substantial losses, and past performance is not indicative of future results. Always be aware that markets can be unpredictable, and prices may move against your trade or investment.
It is advisable to seek advice from a qualified financial professional and to conduct your own research before making any investment decisions. You should only invest funds that you can afford to lose.
I am not responsible for any trades or investments made based on the information presented in this analysis. By reading and using this information, you acknowledge and accept that you are solely responsible for any losses you may incur.

Weekly Chart Breakout in BPCL @398.00Breakout in BPCL @398.00 Weekly Chart basis.
:: Data Point ::
Breakout Level: @398.00
1st Target: @420.00
2nd Target: @470.00
Stoploss Level: @372.00
Note: BPCL traded above 200 EMA as well as Good Volume showing its Breakout poteintiality.

BPCL Analysis Stock is looking good above 390 above and volume is also good on weekly TF, follow chart for proper support and resistance levels.

BPCL can look for 318-320 dip levelsBPCL can look for 318-320 dip levels for tp of 340-342
risk 1.90% and reward 7%
just watch for the levels in coming days
dc : only for educational purpose

BPCL long target 400+Buy BPCL above between 558 to 365
SL 338
T1 - 387 (1:1)
T2 - 409 (1:2)
Index OIL n Gas Index will try to make higher high so Index will be bullish.
BPCL forming bullish head and shoulder pattern on weekly time frame.
BPCL formed W pattern breakout with volume
Took support from bottom trend line

BPCL 4H TF SHORTLooking good for shorting opportunities, expecting it to give a nice confirmation, wait for 30 mins candle close .
Please follow me for more such trades.

BPCL Next Target is 297/285BPCL Breakout happened in a lower time frame i.e on 15 minutes.
So the next Target expected for BPCL is 297/285.
IN my previous calls, I explained about the movement of the BPCL, ADANIET and JSWSTEEL. Check my prev calls.
Explained about SL and the Target in the video posted in TradingView
Tradingview ( TanujaK) is my profile.
NOTE: Published Ideas are for ‘’EDUCATIONAL PURPOSE ONLY’’ trade at your own risk.
NOTE: RESPECT The risk. SL should not be more than 2% of the capital.
Happy Trading

#BPCL @BPCL BPCL 10% movement downward ;#BPCL @BPCL
BPCL 10% movement downward ;
Breakdown happened on lower timeframe, so expected target is 295
Almost 10% profit
NOTE: Published Ideas are for ‘’EDUCATIONAL PURPOSE ONLY’’ trade at your own risk.
NOTE: RESPECT The risk. SL should not be more than 2% of the capital.
Happy Trading

BPCL - BearishLooks like the trend is over
The stock may go for a correction now
Risk to reward looks better
Trend may take a pause at 336/328 areas
which can be considered as short term target

BPCL LOOKS STRONGBuy BPCL for the marked targets of the chart.
To motivate us, Please like the idea If you agree with the analysis.
Happy Trading!
InvestPro India Team

BPCL: Inverse Head and Shoulder reversal Inverse Head and Shoulders Continuation:
This pattern forms in an extensive upside rally. It consists of a left shoulder, a head, and a right shoulder.
At the end of the left shoulder, a minor correction takes place on the upside which happens on the low volumes comparatively the starting of the left shoulder. After this again a down move can be seen on large volumes forming a head having its bottom is below the left shoulder following an upmove correction on lower volumes & completing the head.
The completion of the head must be above the top of the left shoulder. If the prices rise above the top of the left shoulder then too this pattern remains intact. In the end, the right shoulder is formed usually on smaller volumes comparatively the previous two rallies.
Now if you connect the tops of the left shoulder, head & the right shoulder there will be a formation of the ‘Neckline‘. This line will act as a decision line. If the prices break this neckline & give closing above the line, this will be the confirmation of the breakout of the Inverse head and shoulders pattern.
However, it has been noticed that after breaking of the neckline the prices again attracted towards this neckline. We say this phenomenon as a retest of the neckline which will add some more confidence while trading this pattern.
After retesting if the prices again start rising, this will be the final confirmation of the up move as shown above.
The bookish target of this pattern is taken as the vertical price range from the bottom of the head to the neckline & the bookish Stop loss should be the bottom of the right shoulder. However this stop loss can be big, so it is advised to keep a stop loss of 4-5% of the price range below the neckline.
TRADING STRATEGY:
Buy on cmp add on dips , keeping SL of 320 look for the measured target of 415 and beyond that targets are 443 /500 as per ElliottWave perspective.

BPCL giving a break out of cup and handle pattern.BPCL on the daily time frame has given a break out of a cup and handle pattern.
The stock has taking a halt near the resistance zone and gave a break out after a selling off from the level.
3 points confirmation.
1. Break out of the cup and handle pattern.
2. Closed above both the moving averages.
3. High trading volume on the break out.
The stock has finally given a break out and can remain in bullish move tomorrow.
Let stock price to retest the support and cross 350 price level and enter only after it sustains above the level.
Targets :- 353.5, 359
Stop loss :- 337
Trade can be traded if there is a price action near the support level.
Intraday and swing trades can be initiated in the stock.
Investors can also create positions in the stock with a long term view.

BPCL LTD Technical studies For Swing TradersBPCL looks bearish as it falls below 399 support and goes back 5 days.
BPCL made a big belt candle and started falling. According to past performance, if the trend is weak, the price will make a bunch of bearish candles. The swing dealer can wait for the T1 356 to break.
But if the market breaks the level of 399 , there may be a bullish movement in the market.
If this level is broken then good bearish speed can come.
Targets : 356 - 331 and more
Invalidation : breakout of T1
Thank you!
Money_Dictators
Disclaimer: This is NOT investment advice. Invest your capital at your own risk.

GO LONG ON BPCLNSE:BPCL
This is swing trade
The stock is at support zone and have taken support zone
The first target is at 325 and second target is at 345 there is small resistances at 315 .
This is for educational purpose .

BPCL AnalysisBPCL ANALYSIS
Time Frame Analysis:
--------------------
Monthly: Downtrend
Weekly: Downtrend
Daily: Downtrend
Pattern:
--------
Monthly : Descending Pattern / M pattern
Price & Volume relation:
------------------------
Volume is supporting on Daily, Weekly & but on Monthly not.
Conclusion: We will take entry only when Support breaks or Viceversa, Good RR we can catch here.
